SYSTEM CENTER OPERATIONS MANAGER 2012: AN OVERVIEW Baelson

49 Slides7.31 MB
SYSTEM CENTER OPERATIONS MANAGER 2012: AN OVERVIEW Baelson Duque Senior Program Manager System Center Operations Manager
adfadsfa
DISCLAIMER Session contains product features that are currently under development and therefore subject to change before final release
OBJECTIVES AND TAKEAWAYS Session Objectives: Introduce Operations Manager 2012 Understand how Operations Manager 2012: Helps reduce the customer’s Mean Time to Restore Expands the IT Pro’s visibility of their environment
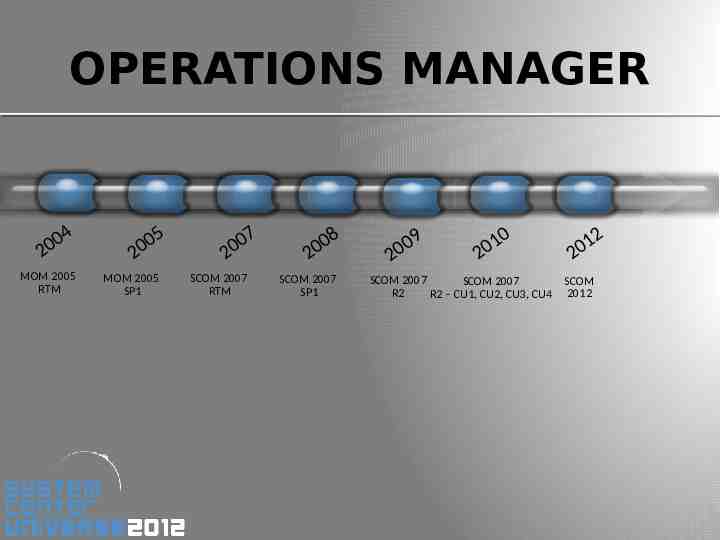
OPERATIONS MANAGER 04 0 2 0 20 MOM 2005 RTM MOM 2005 SP1 5 0 20 SCOM 2007 RTM 7 0 20 8 SCOM 2007 SP1 0 20 9 1 20 0 SCOM 2007 SCOM 2007 R2 R2 – CU1, CU2, CU3, CU4 1 20 SCOM 2012 2
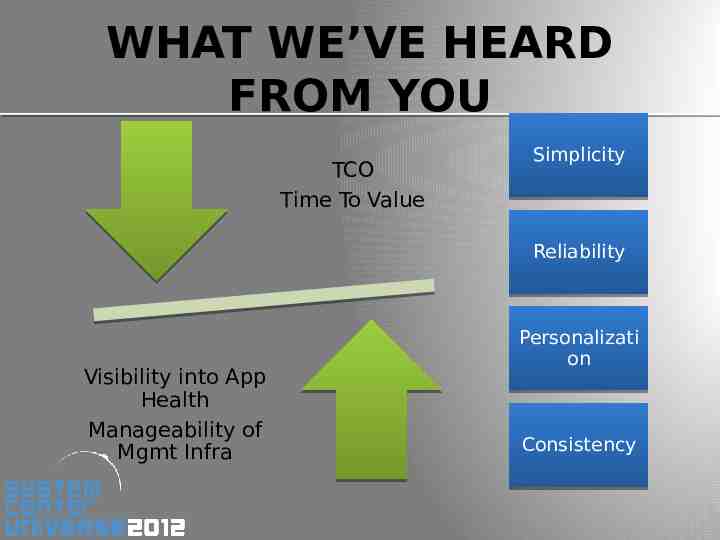
WHAT WE’VE HEARD FROM YOU TCO Time To Value Simplicity Reliability Visibility into App Health Manageability of Mgmt Infra Personalizati on Consistency
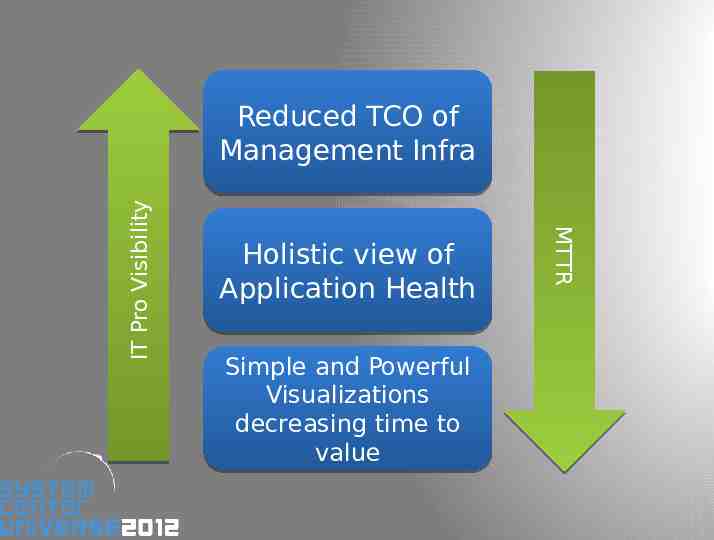
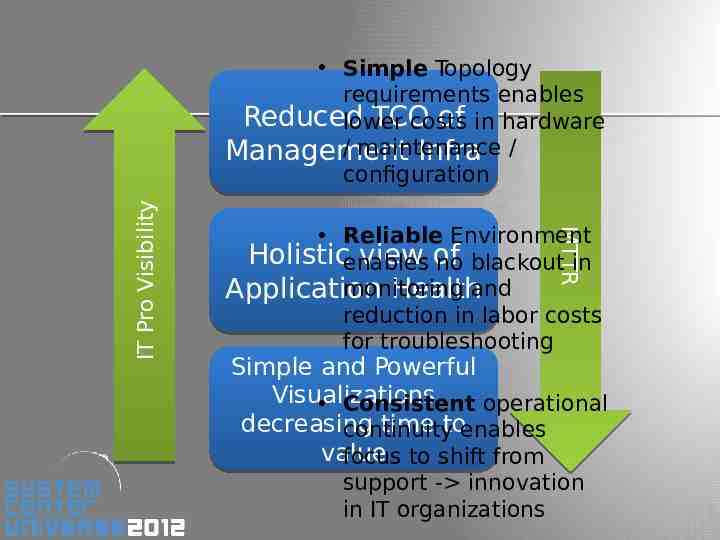
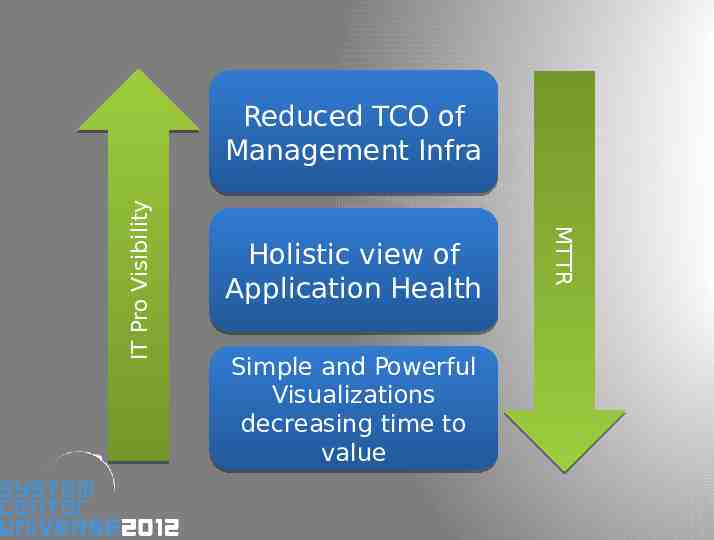
Holistic view of Application Health Simple and Powerful Visualizations decreasing time to value MTTR MTTR IT IT Pro Pro Visibility Visibility Reduced TCO of Management Infra
Reliable Environment Holisticenables view of no blackout in monitoring Application Healthand reduction in labor costs for troubleshooting MTTR MTTR IT IT Pro Pro Visibility Visibility Simple Topology requirements enables Reduced TCO of in hardware lower costs / maintenance Management Infra / configuration Simple and Powerful Visualizations Consistent operational decreasing time toenables continuity value focus to shift from support - innovation in IT organizations
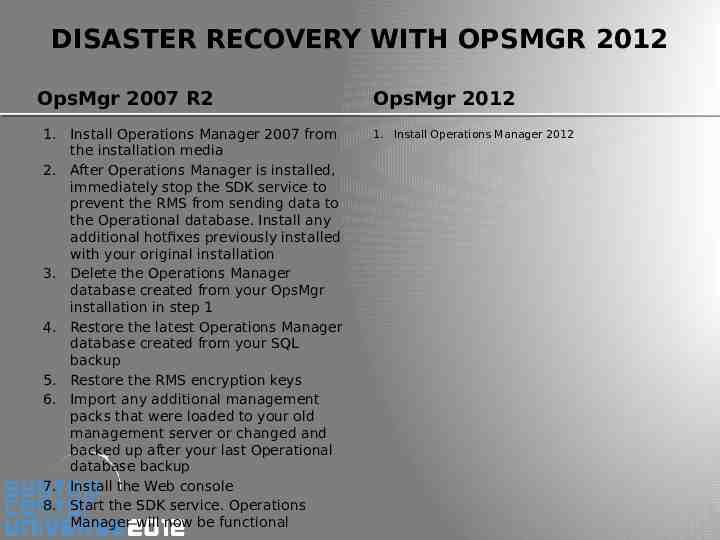
DISASTER RECOVERY WITH OPSMGR 2012 OpsMgr 2007 R2 1. Install Operations Manager 2007 from the installation media 2. After Operations Manager is installed, immediately stop the SDK service to prevent the RMS from sending data to the Operational database. Install any additional hotfixes previously installed with your original installation 3. Delete the Operations Manager database created from your OpsMgr installation in step 1 4. Restore the latest Operations Manager database created from your SQL backup 5. Restore the RMS encryption keys 6. Import any additional management packs that were loaded to your old management server or changed and backed up after your last Operational database backup 7. Install the Web console 8. Start the SDK service. Operations Manager will now be functional OpsMgr 2012 1. Install Operations Manager 2012
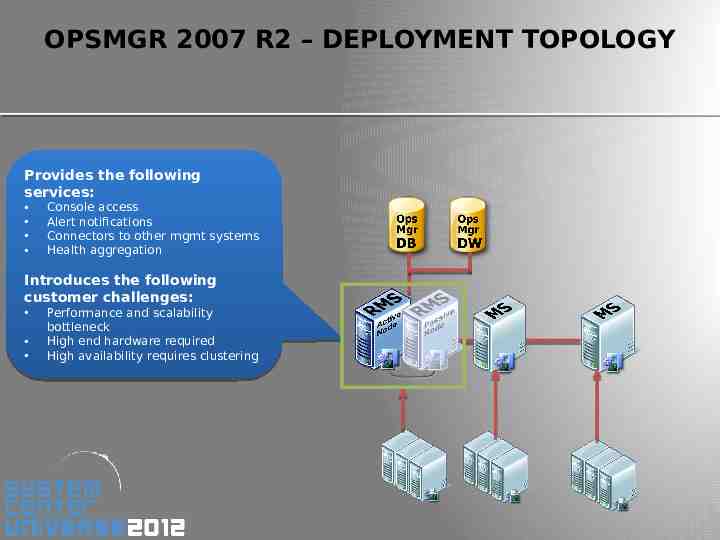
OPSMGR 2007 R2 – DEPLOYMENT TOPOLOGY Provides Provides the the following following services: services: Console Console access access Alert notifications Alert notifications Connectors Connectors to to other other mgmt mgmt systems systems Health aggregation Health aggregation Introduces Introduces the the following following customer challenges: customer challenges: Performance Performance and and scalability scalability bottleneck bottleneck High High end end hardware hardware required required High availability High availability requires requires clustering clustering
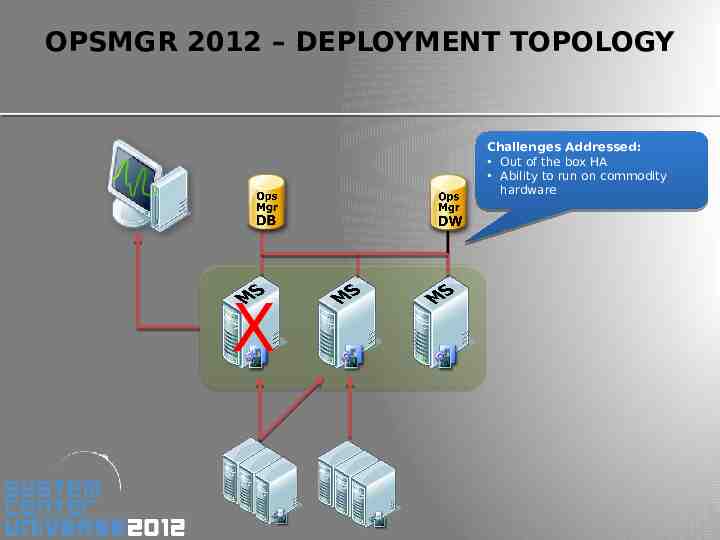
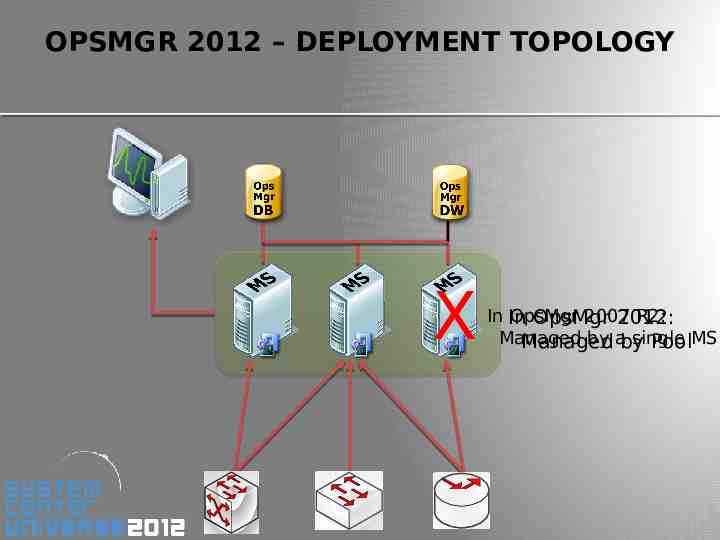
OPSMGR 2012 – DEPLOYMENT TOPOLOGY Challenges Challenges Addressed: Addressed: Out of the box Out of the box HA HA Ability Ability to to run run on on commodity commodity hardware hardware X
OPSMGR 2012 – DEPLOYMENT TOPOLOGY X In In OpsMgr 2007 R2: OpsMgr 2012: Managed by aby single Managed PoolMS
REDUCING MGMT INFRA TCO SUMMARY 1 step setup of High Availability on commodity HW Support for automatic Device monitoring failover
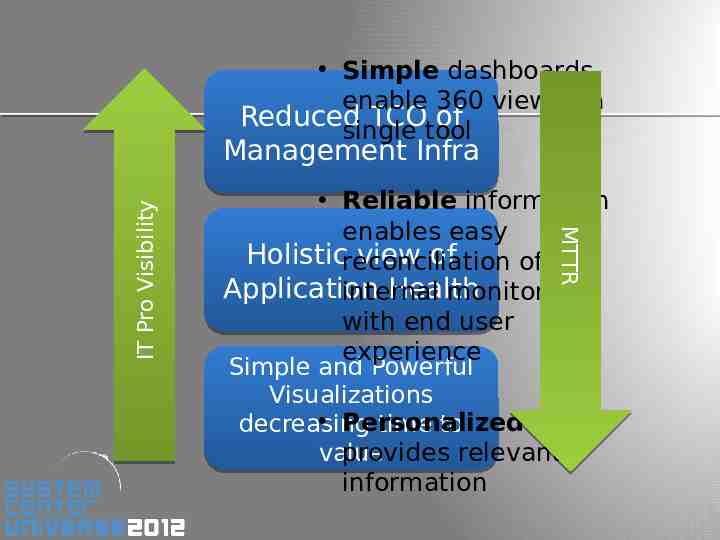
Simple dashboards enable 360 view in a Reduced TCO of single tool Reliable information enables easy Holisticreconciliation view of of Application Health internal monitoring with end user experience Simple and Powerful Visualizations Personalized views decreasing time to provides relevant value information MTTR MTTR IT IT Pro Pro Visibility Visibility Management Infra
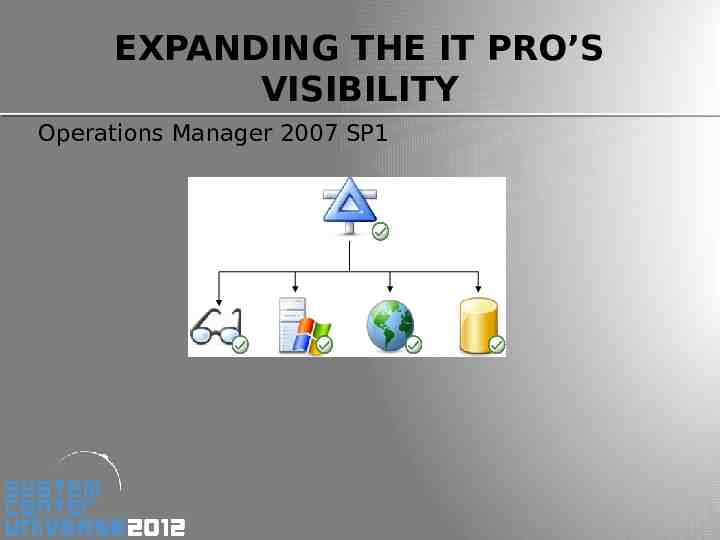
EXPANDING THE IT PRO’S VISIBILITY Operations Manager 2007 SP1
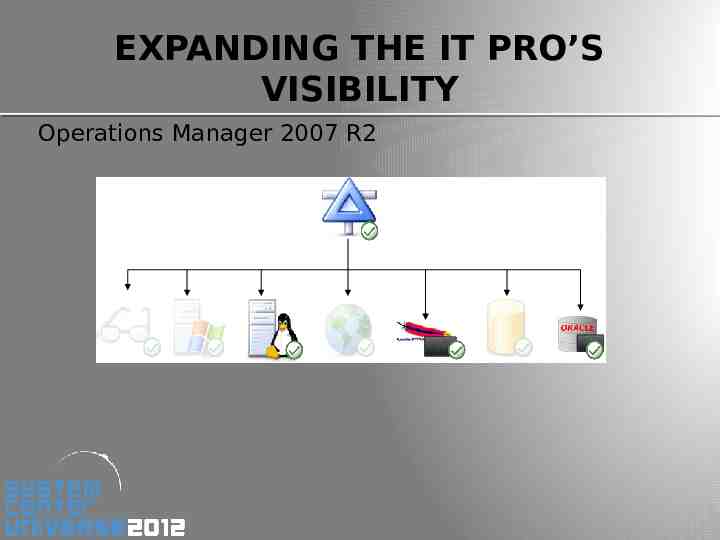
EXPANDING THE IT PRO’S VISIBILITY Operations Manager 2007 R2
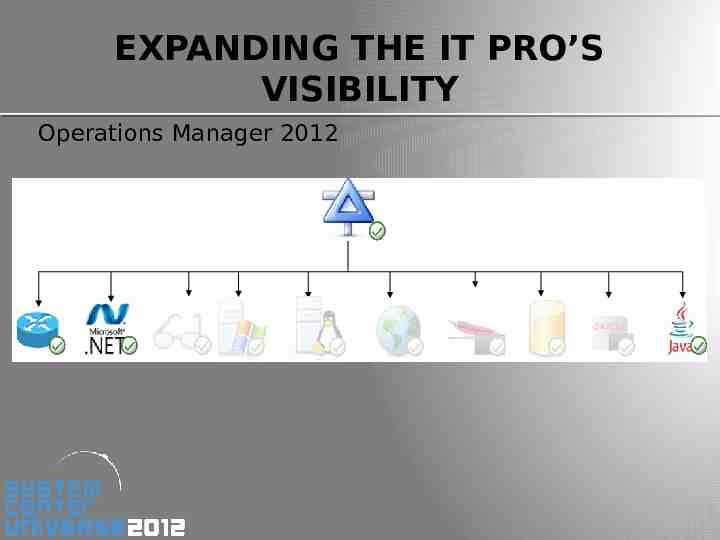
EXPANDING THE IT PRO’S VISIBILITY Operations Manager 2012
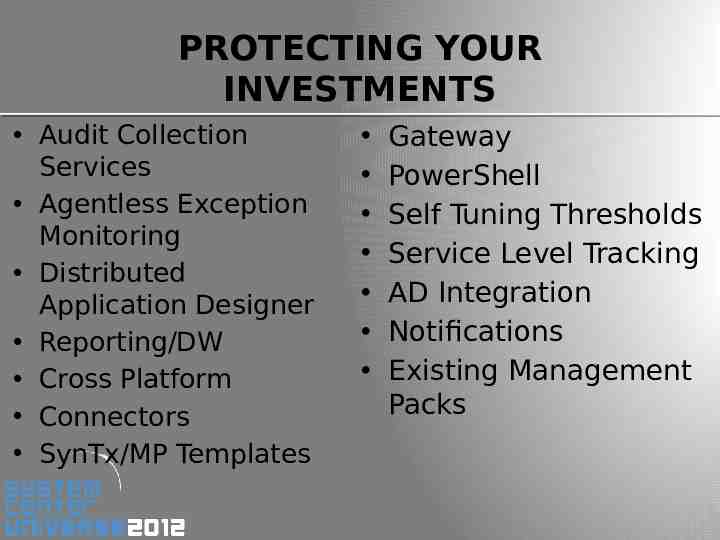
PROTECTING YOUR INVESTMENTS Audit Collection Services Agentless Exception Monitoring Distributed Application Designer Reporting/DW Cross Platform Connectors SynTx/MP Templates Gateway PowerShell Self Tuning Thresholds Service Level Tracking AD Integration Notifications Existing Management Packs
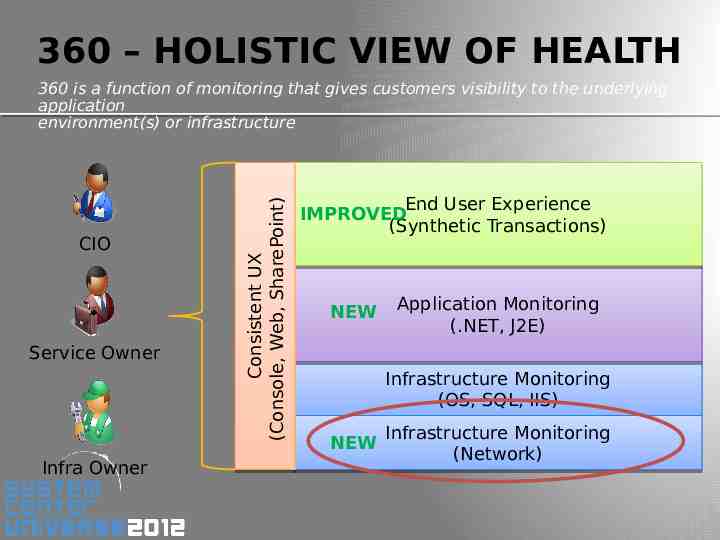
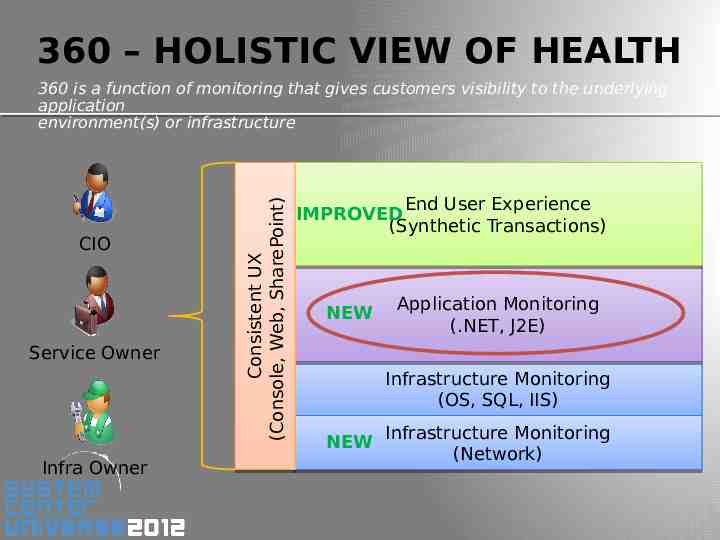
360 – HOLISTIC VIEW OF HEALTH CIO Service Owner Infra Owner Consistent Consistent UX UX (Console, (Console, Web, Web, SharePoint) SharePoint) 360 is a function of monitoring that gives customers visibility to the underlying application environment(s) or infrastructure End User Experience IMPROVED (Synthetic Transactions) NEW Application Monitoring (.NET, J2E) Infrastructure Monitoring (OS, SQL, IIS) Infrastructure Monitoring NEW (Network)
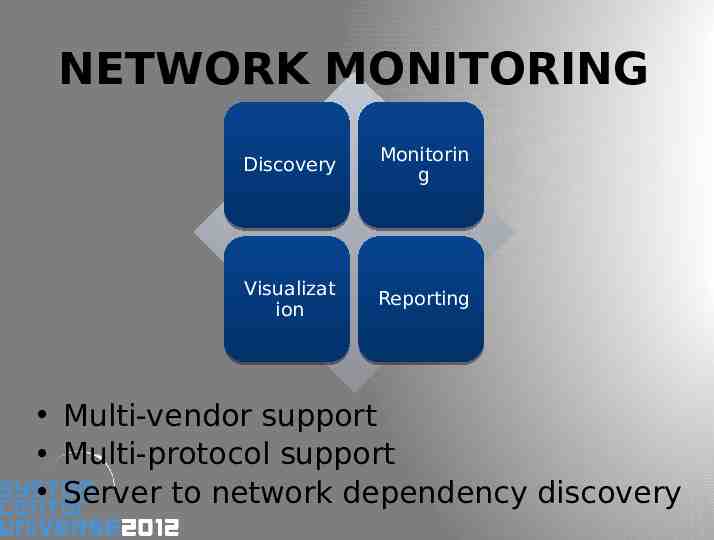
NETWORK MONITORING Discovery Monitorin g Visualizat ion Reporting Multi-vendor support Multi-protocol support Server to network dependency discovery
Demo NETWORK MONITORING
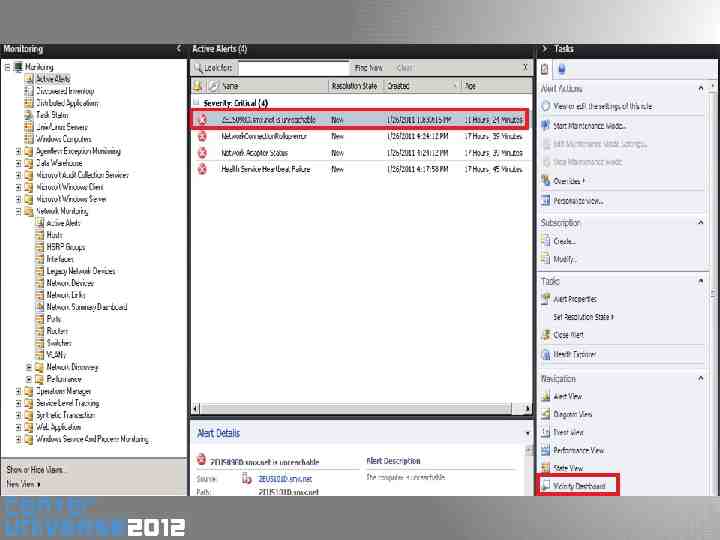
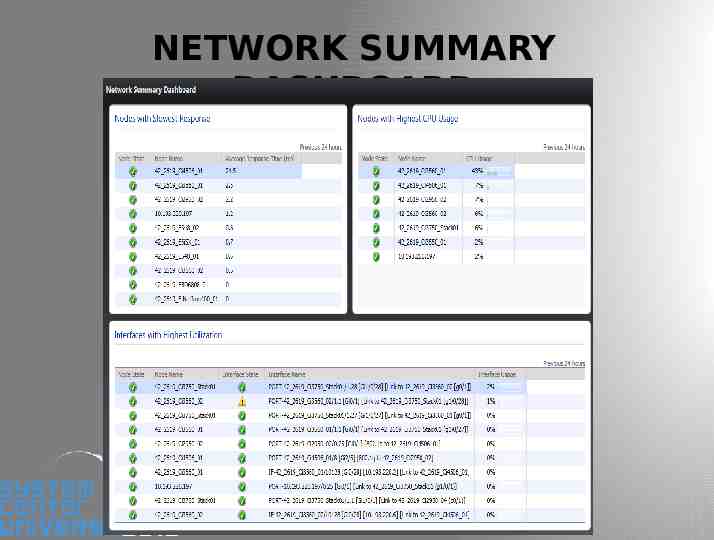
NETWORK SUMMARY DASHBOARD
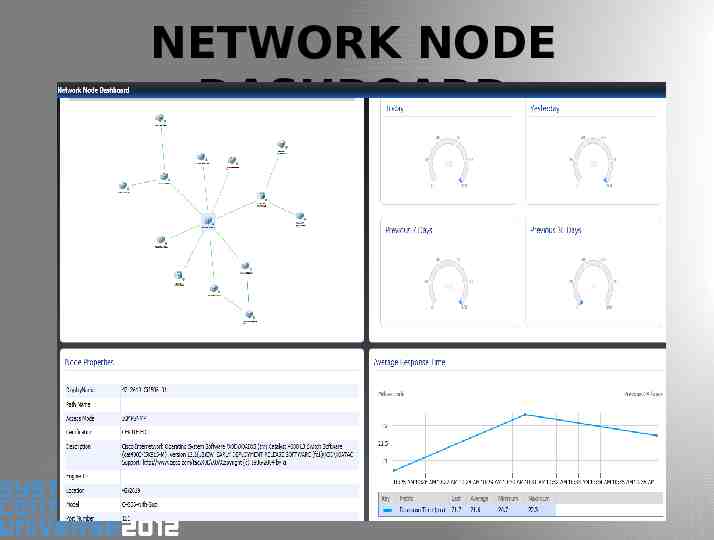
NETWORK NODE DASHBOARD
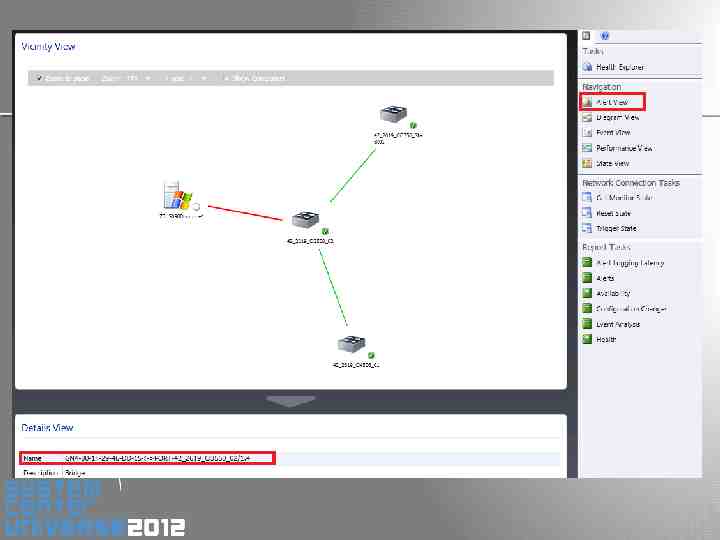
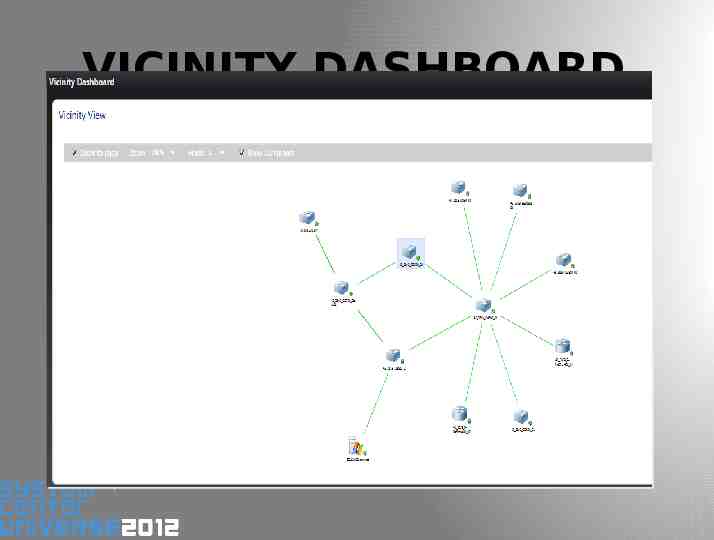
VICINITY DASHBOARD
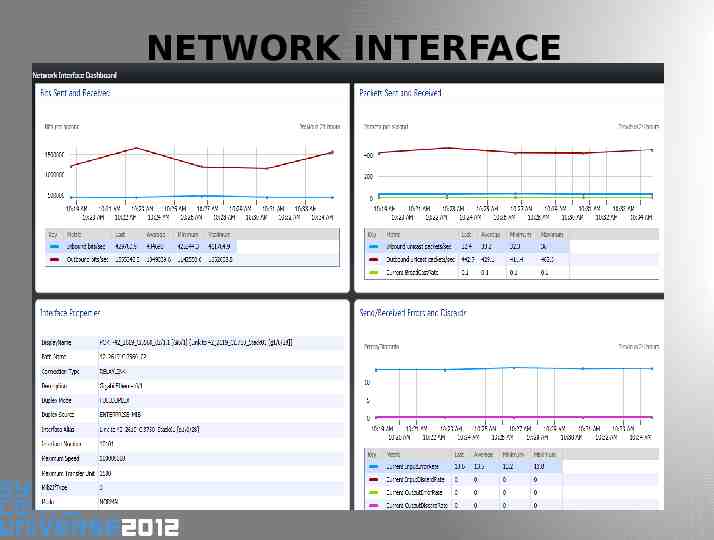
NETWORK INTERFACE DASHBOARD
HOLISTIC VIEW OF APP HEALTH (NETWORK INFRA) Vicinity Dashboard showing contextual Network Map Summary Dashboard of Network Devices See Network Device Details and Health
360 – HOLISTIC VIEW OF HEALTH CIO Service Owner Infra Owner Consistent Consistent UX UX (Console, (Console, Web, Web, SharePoint) SharePoint) 360 is a function of monitoring that gives customers visibility to the underlying application environment(s) or infrastructure End User Experience IMPROVED (Synthetic Transactions) NEW Application Monitoring (.NET, J2E) Infrastructure Monitoring (OS, SQL, IIS) Infrastructure Monitoring NEW (Network)
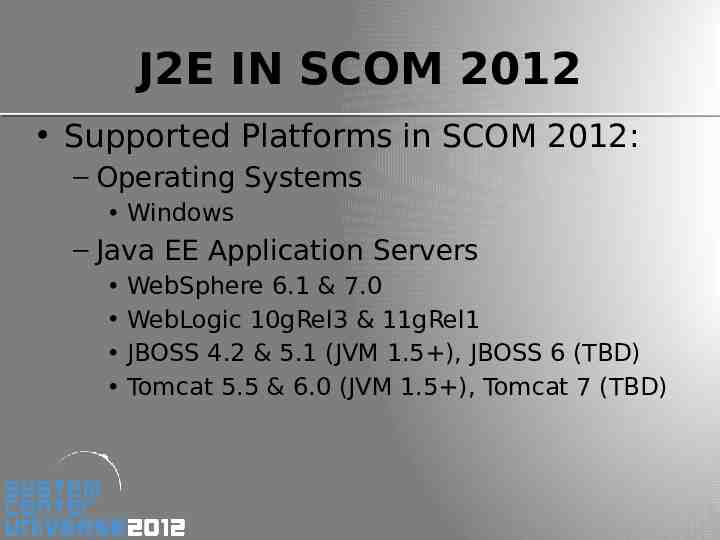
J2E IN SCOM 2012 Supported Platforms in SCOM 2012: – Operating Systems Windows – Java EE Application Servers WebSphere 6.1 & 7.0 WebLogic 10gRel3 & 11gRel1 JBOSS 4.2 & 5.1 (JVM 1.5 ), JBOSS 6 (TBD) Tomcat 5.5 & 6.0 (JVM 1.5 ), Tomcat 7 (TBD)
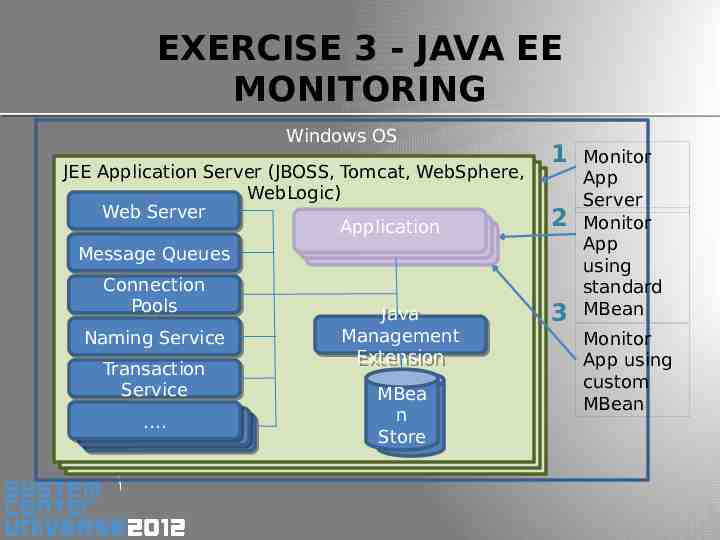
EXERCISE 3 - JAVA EE MONITORING Windows OS JEE Application Server (JBOSS, Tomcat, WebSphere, JEE JEEApplication ApplicationServer Server(JBOSS, (JBOSS,Tomcat, Tomcat,WebSphere, WebSphere, WebLogic) WebLogic) WebLogic) Web Web Server Server Application Application Application Message Queues Message Queues Connection Connection Pools Pools Naming Naming Service Service Transaction Transaction Service Service . . . . . . Java Java Management Management Extension Extension MBea n Store 1 2 3 Monitor App Server Monitor App using standard MBean Monitor App using custom MBean
JAVA EE MONITORING OVERVIEW JEE Application Servers – Automatic discovery – Availability monitoring – Performance Monitoring Memory Garbage Collection Threads Class Loader JIT Compiler JEE Applications – Automatic discovery – Application module discovery – Availability monitoring – Template based custom monitoring
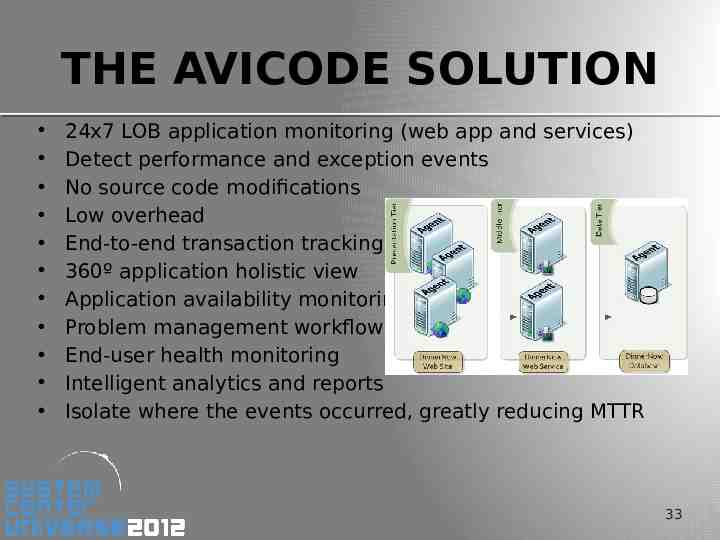
THE AVICODE SOLUTION 24x7 LOB application monitoring (web app and services) Detect performance and exception events No source code modifications Low overhead End-to-end transaction tracking 360º application holistic view Application availability monitoring Problem management workflows End-user health monitoring Intelligent analytics and reports Isolate where the events occurred, greatly reducing MTTR 33
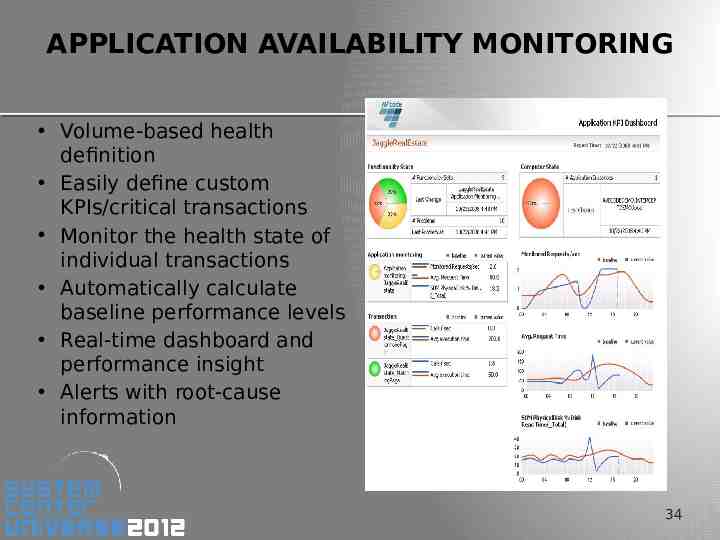
APPLICATION AVAILABILITY MONITORING Volume-based health definition Easily define custom KPIs/critical transactions Monitor the health state of individual transactions Automatically calculate baseline performance levels Real-time dashboard and performance insight Alerts with root-cause information 34
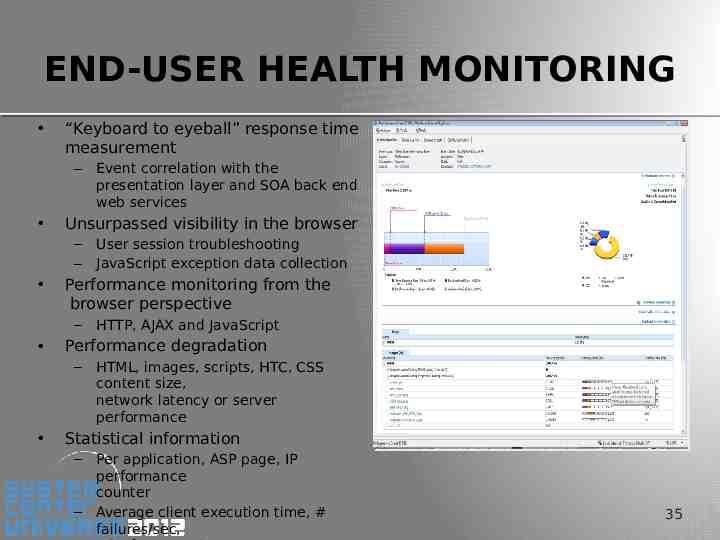
END-USER HEALTH MONITORING “Keyboard to eyeball” response time measurement – Unsurpassed visibility in the browser – – HTTP, AJAX and JavaScript Performance degradation – User session troubleshooting JavaScript exception data collection Performance monitoring from the browser perspective – Event correlation with the presentation layer and SOA back end web services HTML, images, scripts, HTC, CSS content size, network latency or server performance Statistical information – – Per application, ASP page, IP performance counter Average client execution time, # failures/sec, 35
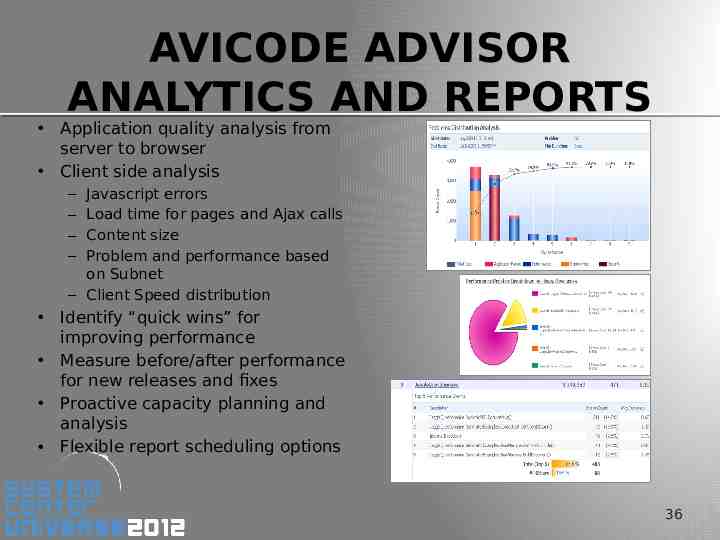
AVICODE ADVISOR ANALYTICS AND REPORTS Application quality analysis from server to browser Client side analysis – – – – Javascript errors Load time for pages and Ajax calls Content size Problem and performance based on Subnet – Client Speed distribution Identify “quick wins” for improving performance Measure before/after performance for new releases and fixes Proactive capacity planning and analysis Flexible report scheduling options 36
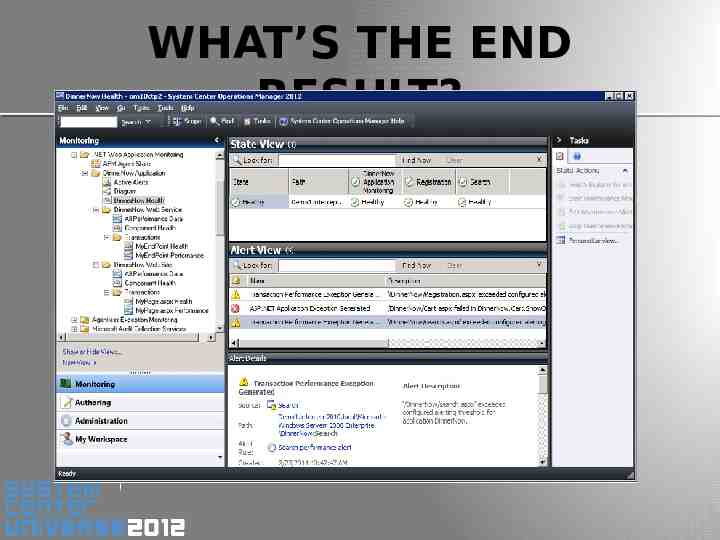
WHAT’S THE END RESULT?
Demo APPLICATION MONITORING
HOLISTIC VIEW OF APP HEALTH (APP MONITORING) Out of box App Discovery and Monitoring Easy to understand Application failures via Resource View Useful Dev information for efficient escalation Increased time to value without custom MP authoring
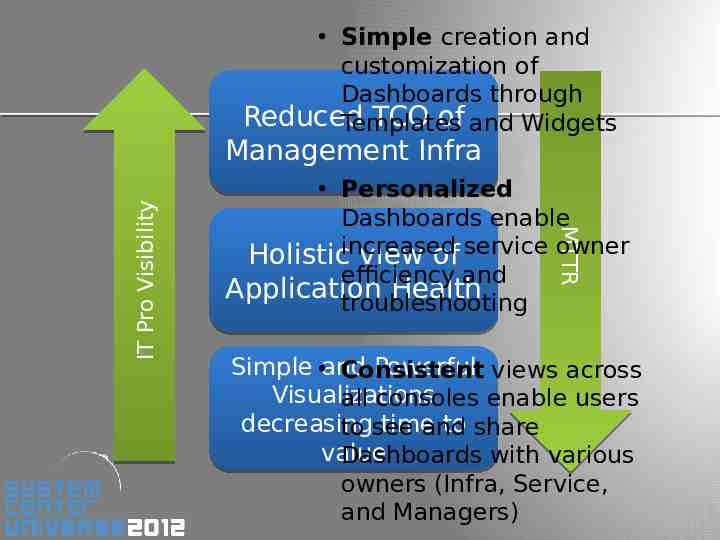
Simple creation and customization of Dashboards through Reduced TCO of and Widgets Templates Personalized Dashboards enable Holisticincreased view of service owner efficiency and Application Health troubleshooting MTTR MTTR IT IT Pro Pro Visibility Visibility Management Infra Simple and Powerful views across Consistent Visualizations all consoles enable users decreasing time to share to see and value Dashboards with various owners (Infra, Service, and Managers)
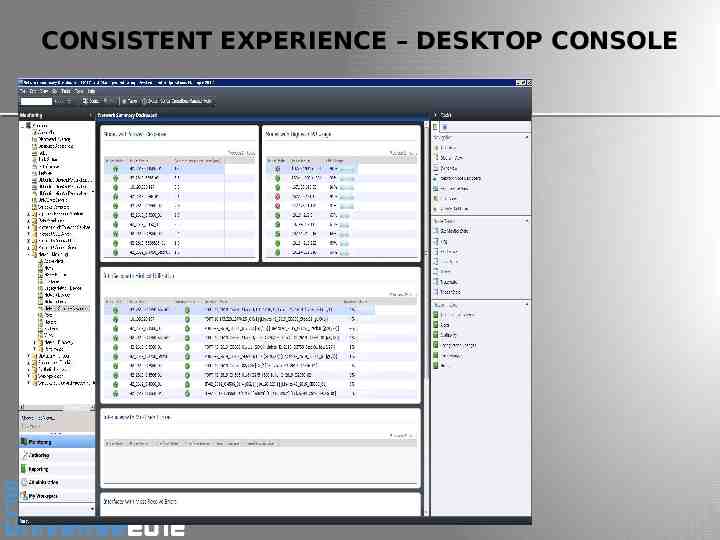
CONSISTENT EXPERIENCE – DESKTOP CONSOLE
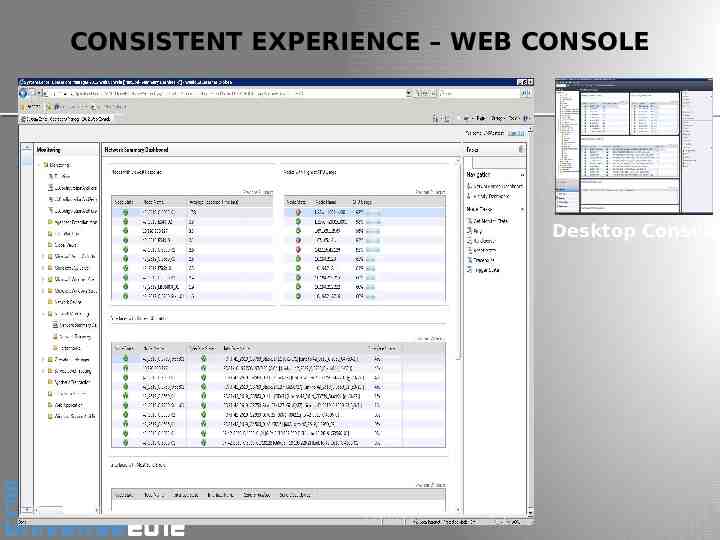
CONSISTENT EXPERIENCE – WEB CONSOLE Desktop Console
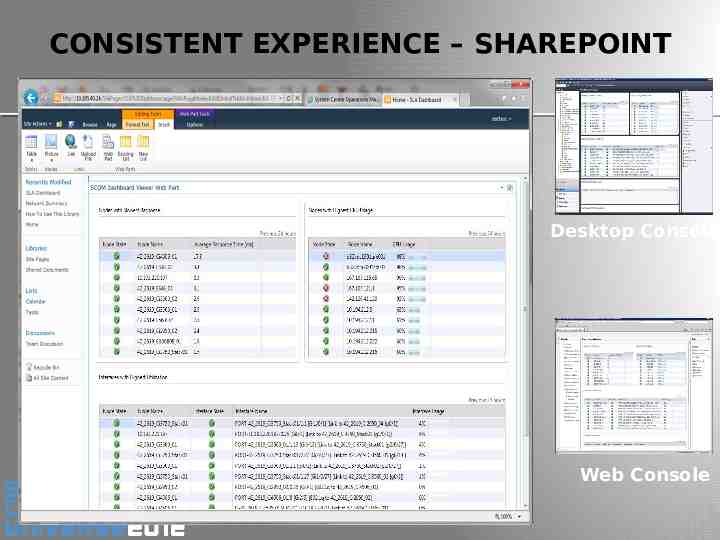
CONSISTENT EXPERIENCE – SHAREPOINT Desktop Console Web Console
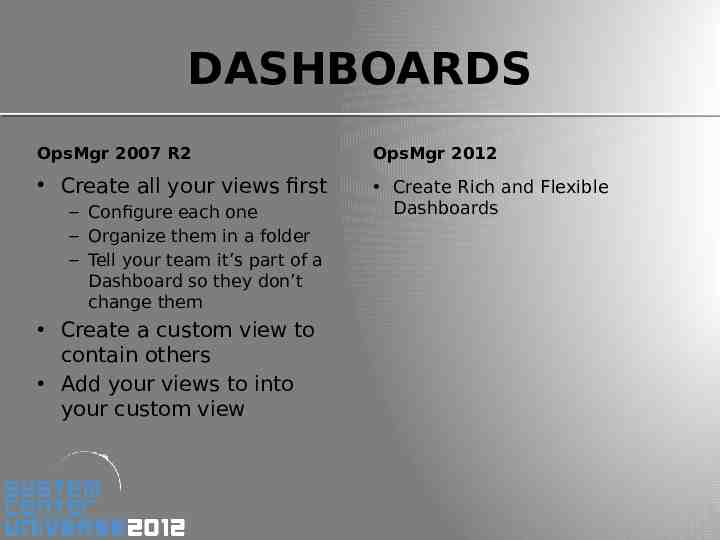
DASHBOARDS OpsMgr 2007 R2 OpsMgr 2012 Create all your views first Create Rich and Flexible Dashboards – Configure each one – Organize them in a folder – Tell your team it’s part of a Dashboard so they don’t change them Create a custom view to contain others Add your views to into your custom view
DASHBOARDS Demo Baelson Duque
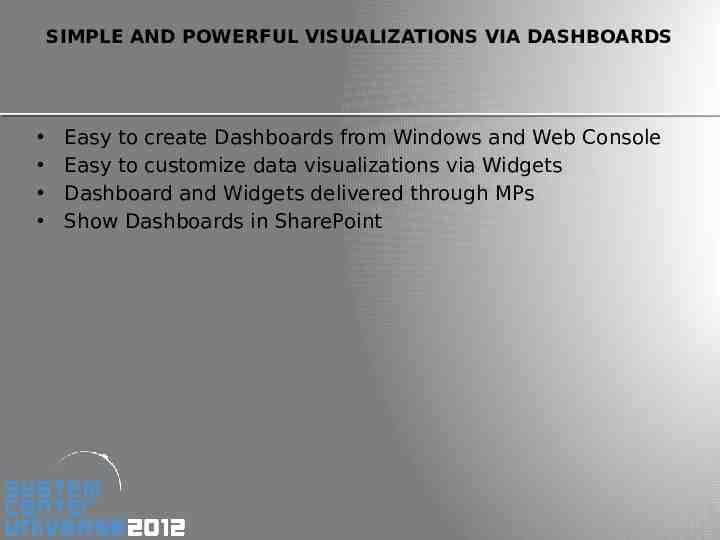
SIMPLE AND POWERFUL VISUALIZATIONS VIA DASHBOARDS Easy to create Dashboards from Windows and Web Console Easy to customize data visualizations via Widgets Dashboard and Widgets delivered through MPs Show Dashboards in SharePoint
Holistic view of Application Health Simple and Powerful Visualizations decreasing time to value MTTR MTTR IT IT Pro Pro Visibility Visibility Reduced TCO of Management Infra
SESSION OBJECTIVES AND TAKEAWAYS Session Objectives: Introduce Operations Manager 2012 Understand how Operations Manager 2012: Helps reduce the customer’s Mean Time to Resolution Expands the IT Pro’s visibility of their environment