Supply Chain Contracts and their Impact on Profitability Double
14 Slides216.00 KB
Supply Chain Contracts and their Impact on Profitability Double Marginalisation Supply Chain Co-ordination via Contracts
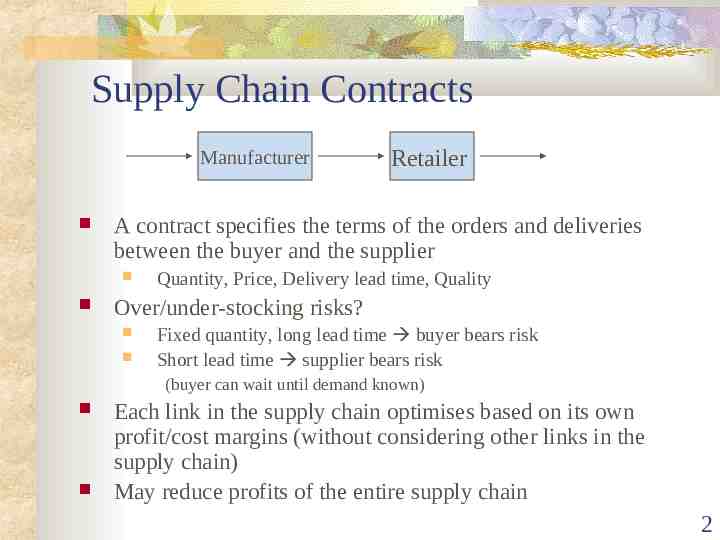
Supply Chain Contracts Manufacturer A contract specifies the terms of the orders and deliveries between the buyer and the supplier Retailer Quantity, Price, Delivery lead time, Quality Over/under-stocking risks? Fixed quantity, long lead time buyer bears risk Short lead time supplier bears risk (buyer can wait until demand known) Each link in the supply chain optimises based on its own profit/cost margins (without considering other links in the supply chain) May reduce profits of the entire supply chain 2
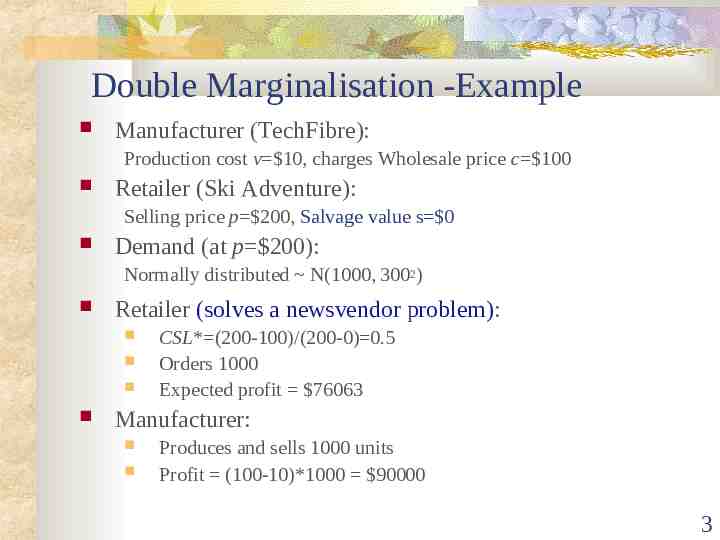
Double Marginalisation -Example Manufacturer (TechFibre): Production cost v 10, charges Wholesale price c 100 Retailer (Ski Adventure): Selling price p 200, Salvage value s 0 Demand (at p 200): Normally distributed N(1000, 3002) Retailer (solves a newsvendor problem): CSL* (200-100)/(200-0) 0.5 Orders 1000 Expected profit 76063 Manufacturer: Produces and sells 1000 units Profit (100-10)*1000 90000 3
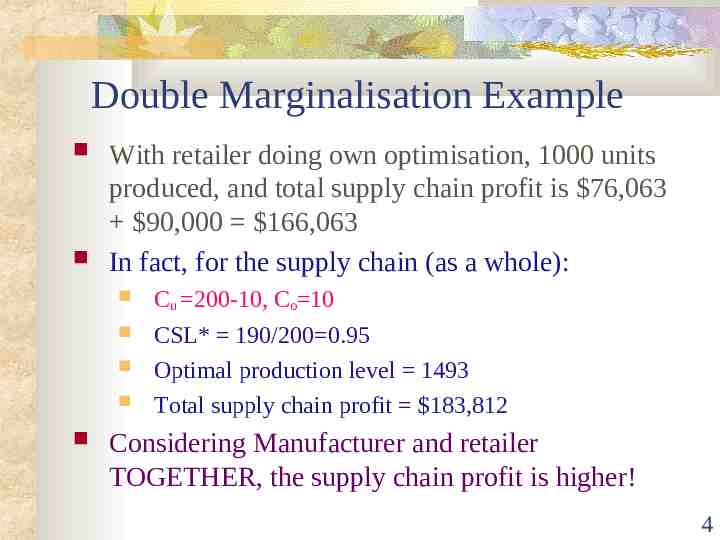
Double Marginalisation Example With retailer doing own optimisation, 1000 units produced, and total supply chain profit is 76,063 90,000 166,063 In fact, for the supply chain (as a whole): Cu 200-10, Co 10 CSL* 190/200 0.95 Optimal production level 1493 Total supply chain profit 183,812 Considering Manufacturer and retailer TOGETHER, the supply chain profit is higher! 4
Double Marginalisation If each party makes decisions considering only a part of the supply chain, the decisions may not maximize profits for the whole supply chain! 5
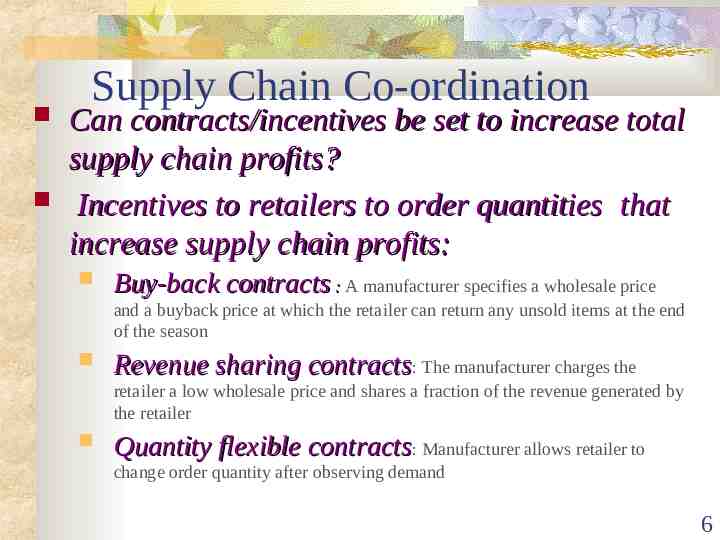
Supply Chain Co-ordination Can contracts/incentives be set to increase total supply chain profits? Incentives to retailers to order quantities that increase supply chain profits: Buy-back contracts : A manufacturer specifies a wholesale price and a buyback price at which the retailer can return any unsold items at the end of the season Revenue sharing contracts: The manufacturer charges the retailer a low wholesale price and shares a fraction of the revenue generated by the retailer Quantity flexible contracts: Manufacturer allows retailer to change order quantity after observing demand 6
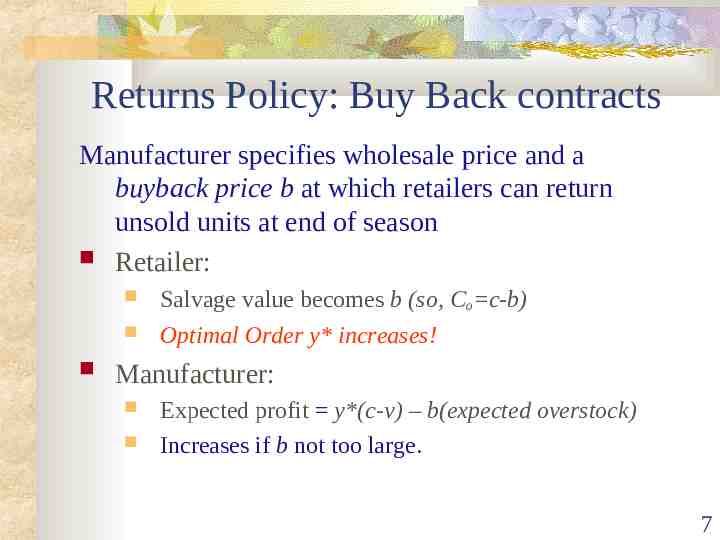
Returns Policy: Buy Back contracts Manufacturer specifies wholesale price and a buyback price b at which retailers can return unsold units at end of season Retailer: Salvage value becomes b (so, Co c-b) Optimal Order y* increases! Manufacturer: Expected profit y*(c-v) – b(expected overstock) Increases if b not too large. 7
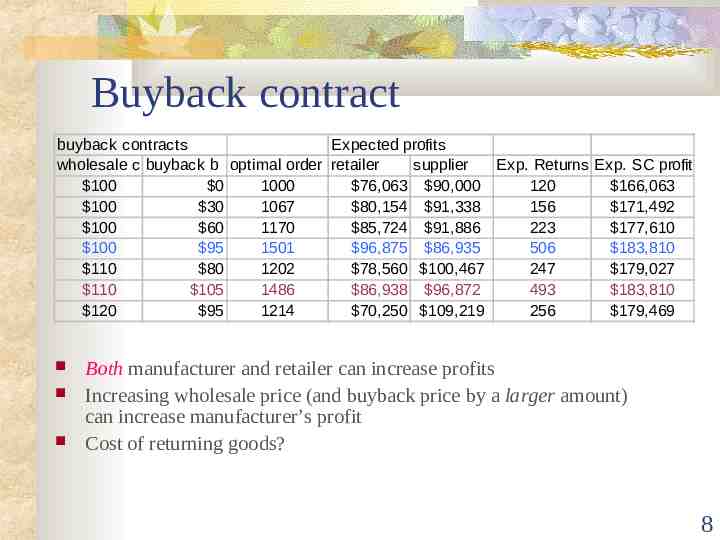
Buyback contract buyback contracts Expected profits wholesale c buyback b optimal order retailer supplier Exp. Returns Exp. SC profit 100 0 1000 76,063 90,000 120 166,063 100 30 1067 80,154 91,338 156 171,492 100 60 1170 85,724 91,886 223 177,610 100 95 1501 96,875 86,935 506 183,810 110 80 1202 78,560 100,467 247 179,027 110 105 1486 86,938 96,872 493 183,810 120 95 1214 70,250 109,219 256 179,469 Both manufacturer and retailer can increase profits Increasing wholesale price (and buyback price by a larger amount) can increase manufacturer’s profit Cost of returning goods? 8
Revenue Sharing Contracts Manufacturer charges a low wholesale price and shares a fraction (f) of the revenue generated by the retailer Lower wholesale price decreases cost of overstocking, so retailer increases level of product availability increase profit for BOTH manufacturer and retailer 9
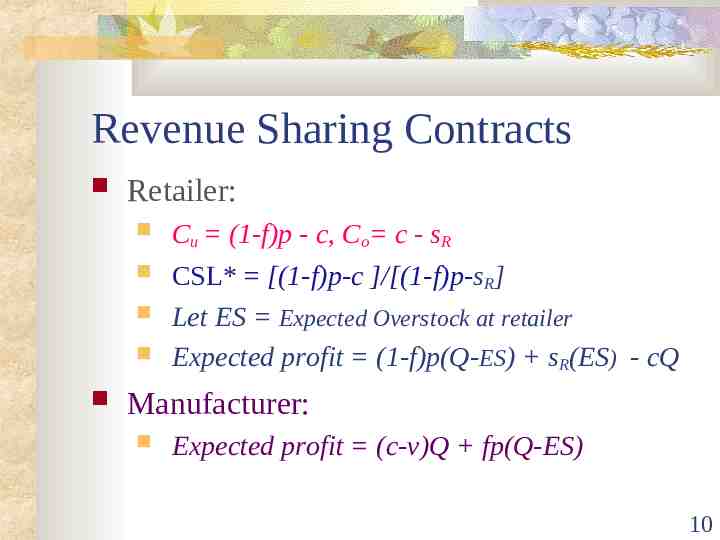
Revenue Sharing Contracts Retailer: Cu (1-f)p - c, Co c - sR CSL* [(1-f)p-c ]/[(1-f)p-sR] Let ES Expected Overstock at retailer Expected profit (1-f)p(Q-ES) sR(ES) - cQ Manufacturer: Expected profit (c-v)Q fp(Q-ES) 10
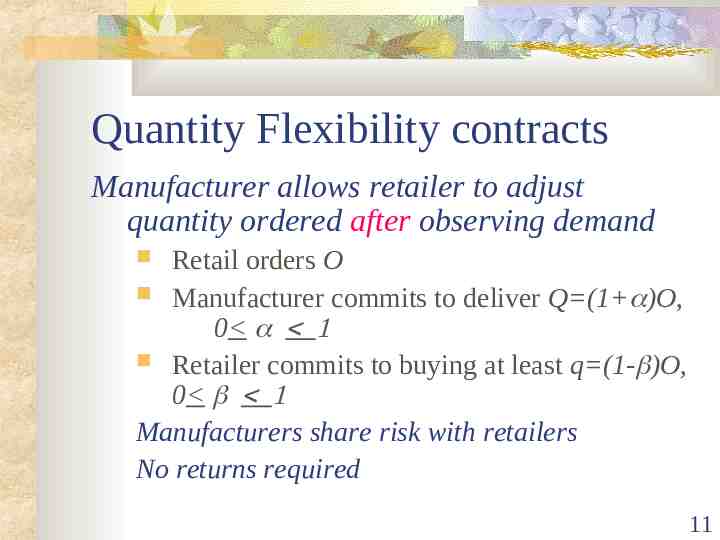
Quantity Flexibility contracts Manufacturer allows retailer to adjust quantity ordered after observing demand Retail orders O Manufacturer commits to deliver Q (1 )O, 0 Retailer commits to buying at least q (1- )O, 0 Manufacturers share risk with retailers No returns required 11
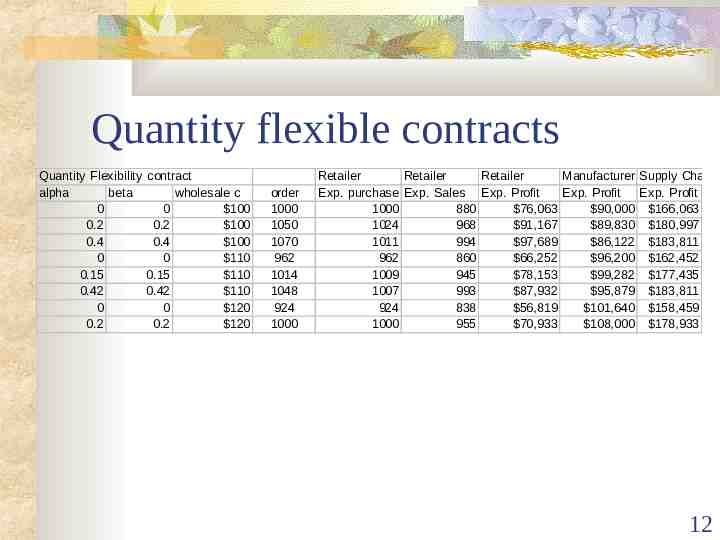
Quantity flexible contracts Quantity Flexibility contract alpha beta wholesale c 0 0 100 0.2 0.2 100 0.4 0.4 100 0 0 110 0.15 0.15 110 0.42 0.42 110 0 0 120 0.2 0.2 120 order 1000 1050 1070 962 1014 1048 924 1000 Retailer Retailer Retailer Manufacturer Supply Chain Exp. purchase Exp. Sales Exp. Profit Exp. Profit Exp. Profit 1000 880 76,063 90,000 166,063 1024 968 91,167 89,830 180,997 1011 994 97,689 86,122 183,811 962 860 66,252 96,200 162,452 1009 945 78,153 99,282 177,435 1007 993 87,932 95,879 183,811 924 838 56,819 101,640 158,459 1000 955 70,933 108,000 178,933 12
Vendor Managed Inventory (VMI) Manufacturer controls replenishments decisions Retailers share sales information VMI can mitigate the effects of double marginalisation VMI can improve manufacturer forecasts Retailers stock goods from competitors Confidentiality? Substitutability ignored by BOTH manufacturers - stock too high for retailers 13
Summary Newsvendor model Supply chain co-ordination by contracts Tradeoff cost of over-stock and lost sales Buy-back Revenue sharing Quantity-flexible Vendor-managed inventory Incentives? Making supply meet demand! 14