Squirrel Overview Donna Sueper Aerodyne, University of

27 Slides2.40 MB
Squirrel Overview Donna Sueper Aerodyne, University of Colorado, Boulder
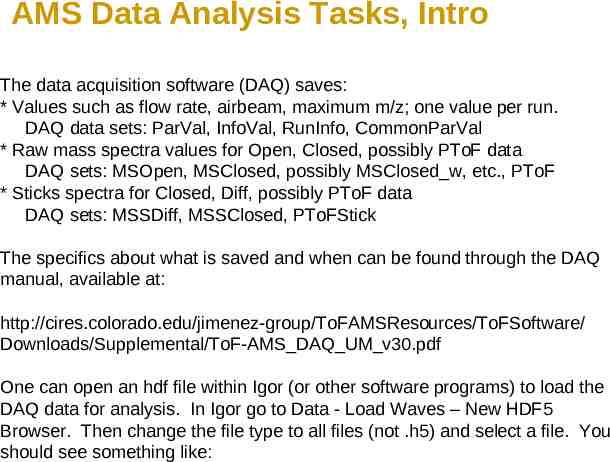
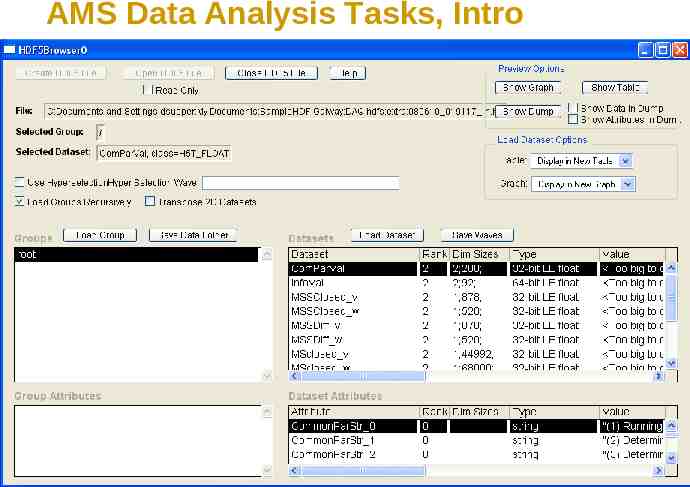
AMS Data Analysis Tasks, Intro The data acquisition software (DAQ) saves: * Values such as flow rate, airbeam, maximum m/z; one value per run. DAQ data sets: ParVal, InfoVal, RunInfo, CommonParVal * Raw mass spectra values for Open, Closed, possibly PToF data DAQ sets: MSOpen, MSClosed, possibly MSClosed w, etc., PToF * Sticks spectra for Closed, Diff, possibly PToF data DAQ sets: MSSDiff, MSSClosed, PToFStick The specifics about what is saved and when can be found through the DAQ manual, available at: http://cires.colorado.edu/jimenez-group/ToFAMSResources/ToFSoftware/ Downloads/Supplemental/ToF-AMS DAQ UM v30.pdf One can open an hdf file within Igor (or other software programs) to load the DAQ data for analysis. In Igor go to Data - Load Waves – New HDF5 Browser. Then change the file type to all files (not .h5) and select a file. You should see something like:
AMS Data Analysis Tasks, Intro
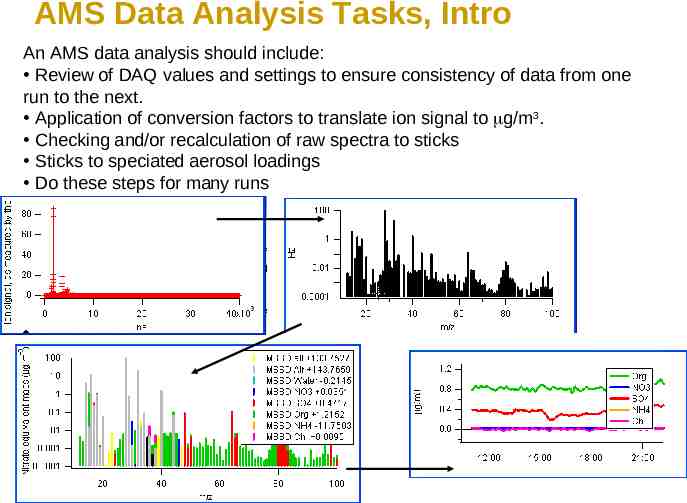
AMS Data Analysis Tasks, Intro An AMS data analysis should include: Review of DAQ values and settings to ensure consistency of data from one run to the next. Application of conversion factors to translate ion signal to g/m3. Checking and/or recalculation of raw spectra to sticks Sticks to speciated aerosol loadings Do these steps for many runs
Outline Squirrel Motivation What, Why, How Squirrel Analysis Flow Chart Outline major steps, Quick & Complete Analysis Squirrel Features AMS Igor Panel Screen Shots, Resulting Graphs Squirrel Future Bug list & Feature requests Closing Remarks
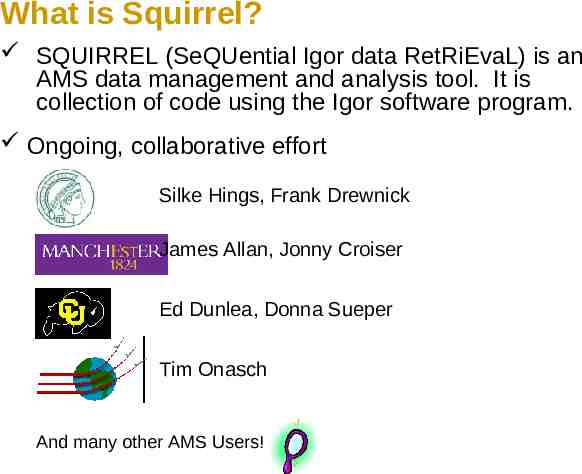
What is Squirrel? SQUIRREL (SeQUential Igor data RetRiEvaL) is an AMS data management and analysis tool. It is collection of code using the Igor software program. Ongoing, collaborative effort Silke Hings, Frank Drewnick James Allan, Jonny Croiser Ed Dunlea, Donna Sueper Tim Onasch And many other AMS Users!
Why Squirrel? Aerodyne AMS generates large data sets * Not feasible to load all data into memory * The squirrel approach is to load sufficient data for task at hand (diagnostics, quick look ) Recreation of James Allan’s quad program * Generates mass spectra averages, size distributions, time trends; uses same frag list and batch files Familiarity with Igor * Publication-quality graphs * Users can write custom code
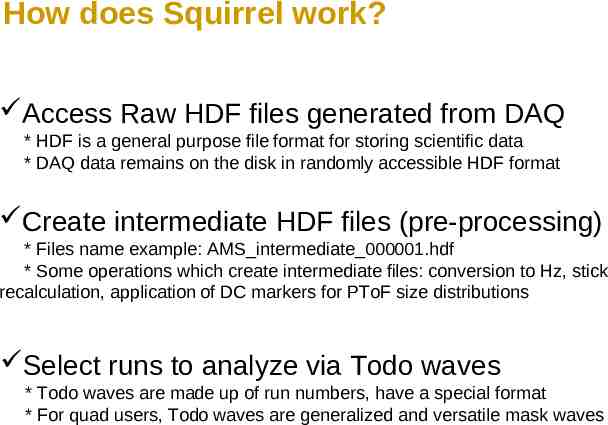
How does Squirrel work? Access Raw HDF files generated from DAQ * HDF is a general purpose file format for storing scientific data * DAQ data remains on the disk in randomly accessible HDF format Create intermediate HDF files (pre-processing) * Files name example: AMS intermediate 000001.hdf * Some operations which create intermediate files: conversion to Hz, stick recalculation, application of DC markers for PToF size distributions Select runs to analyze via Todo waves * Todo waves are made up of run numbers, have a special format * For quad users, Todo waves are generalized and versatile mask waves
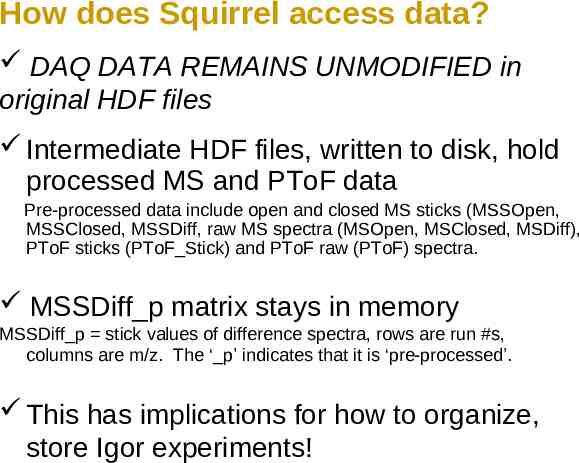
How does Squirrel access data? DAQ DATA REMAINS UNMODIFIED in original HDF files Intermediate HDF files, written to disk, hold processed MS and PToF data Pre-processed data include open and closed MS sticks (MSSOpen, MSSClosed, MSSDiff, raw MS spectra (MSOpen, MSClosed, MSDiff), PToF sticks (PToF Stick) and PToF raw (PToF) spectra. MSSDiff p matrix stays in memory MSSDiff p stick values of difference spectra, rows are run #s, columns are m/z. The ‘ p’ indicates that it is ‘pre-processed’. This has implications for how to organize, store Igor experiments!
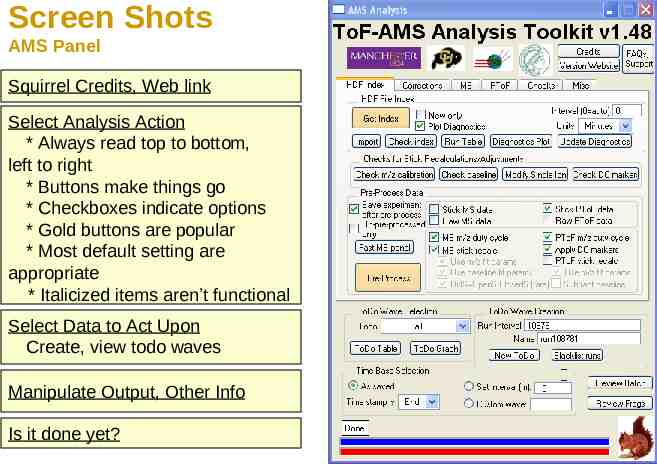
Screen Shots AMS Panel Squirrel Credits, Web link Select Analysis Action * Always read top to bottom, left to right * Buttons make things go * Checkboxes indicate options * Gold buttons are popular * Most default setting are appropriate * Italicized items aren’t functional Select Data to Act Upon Create, view todo waves Manipulate Output, Other Info Is it done yet?
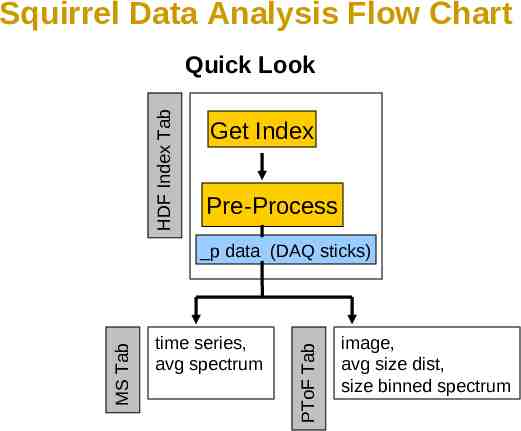
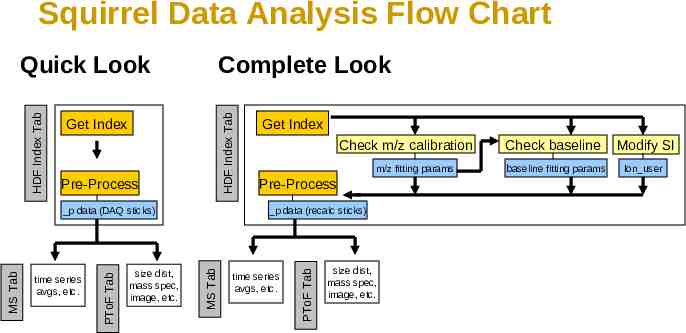
Squirrel Data Analysis Flow Chart HDF Index Tab Quick Look Get Index Pre-Process time series, avg spectrum PToF Tab MS Tab p data (DAQ sticks) image, avg size dist, size binned spectrum
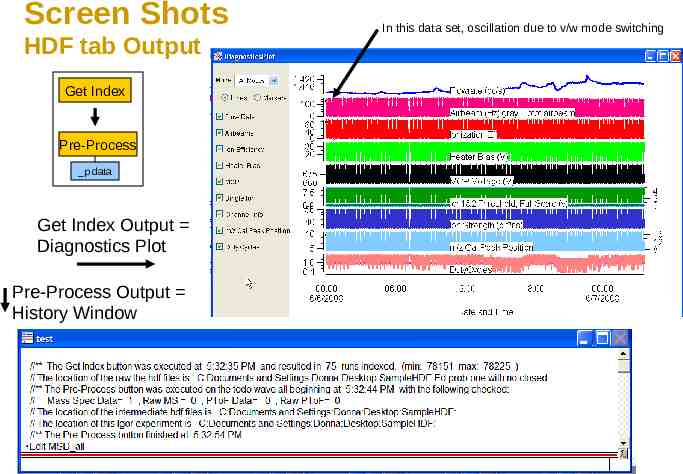
Screen Shots HDF tab Output Get Index Pre-Process p data Get Index Output Diagnostics Plot Pre-Process Output History Window In this data set, oscillation due to v/w mode switching
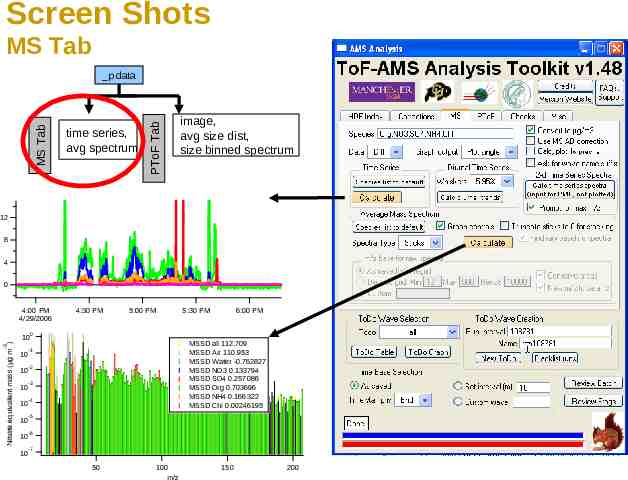
Screen Shots MS Tab time series, avg spectrum PToF Tab MS Tab p data image, avg size dist, size binned spectrum 12 8 4 0 4:00 PM 4/29/2006 4:30 PM 5:00 PM 5:30 PM 6:00 PM 0 -3 Nitrate equivalent mass (µg m ) 10 10 -1 10 -2 10 -3 10 -4 10 -5 10 -6 10 -7 MSSD all 112.709 MSSD Air 110.953 MSSD Water -0.762827 MSSD NO3 0.133794 MSSD SO4 0.257086 MSSD Org 0.703696 MSSD NH4 0.166322 MSSD Chl 0.00246195 50 100 m/z 150 200
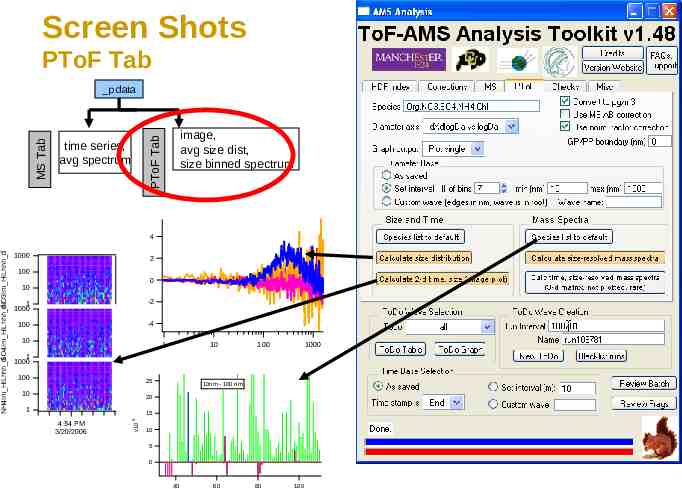
Screen Shots PToF Tab image, avg size dist, size binned spectrum PToF Tab MS Tab p data time series, avg spectrum 1000 2 100 0 10 1 1000 -2 100 -4 10 1 10 100 1000 1 1000 100 25 10 20 1 10nm - 100 nm -3 15 4:54 PM 3/20/2006 x10 NH4im HiLhhh dSO4im HiLhhh dNO3im HiLhhh d 4 10 5 0 40 60 80 100
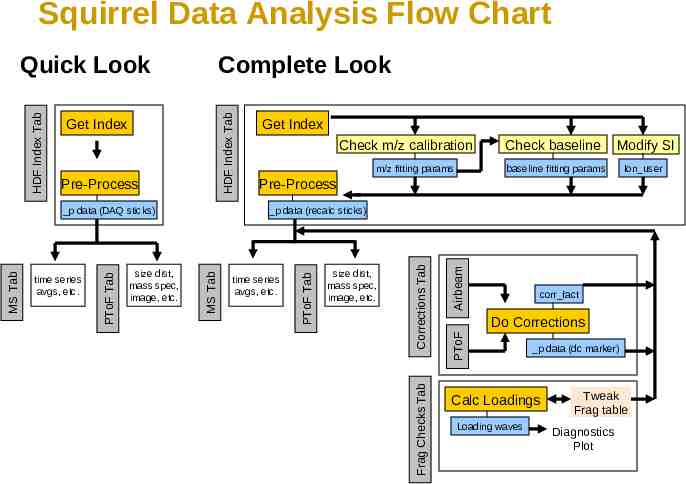
Squirrel Data Analysis Flow Chart Complete Look HDF Index Tab Get Index Pre-Process size dist, mass spec, image, etc. Check m/z calibration m/z fitting params Pre-Process p data (recalc sticks) MS Tab time series avgs, etc. PToF Tab MS Tab p data (DAQ sticks) Get Index time series avgs, etc. PToF Tab HDF Index Tab Quick Look size dist, mass spec, image, etc. Check baseline baseline fitting params Modify SI Ion user
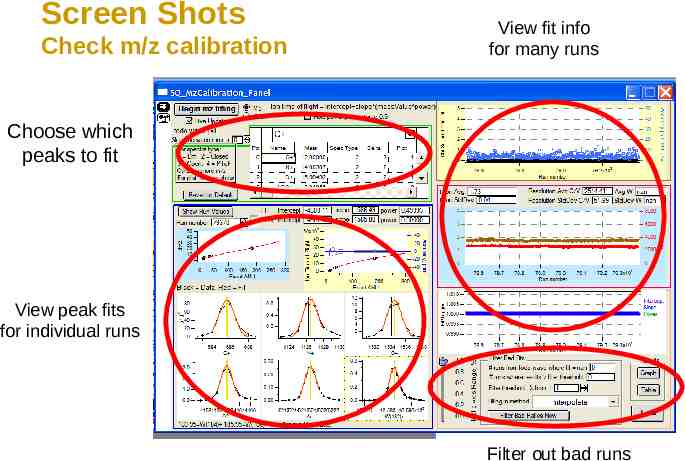
Screen Shots Check m/z calibration View fit info for many runs Choose which peaks to fit View peak fits for individual runs Filter out bad runs
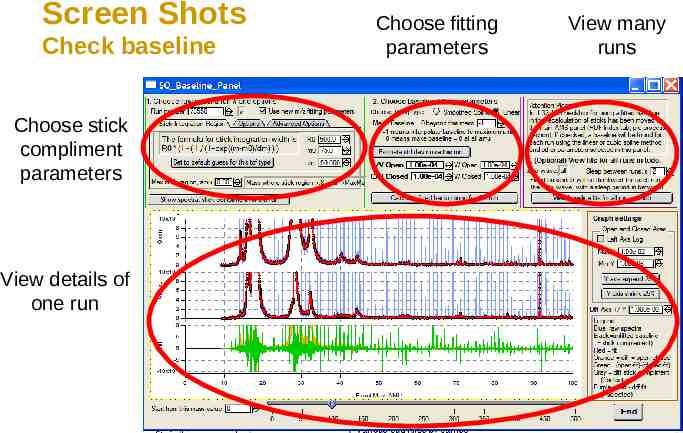
Screen Shots Check baseline Choose stick compliment parameters View details of one run Choose fitting parameters View many runs
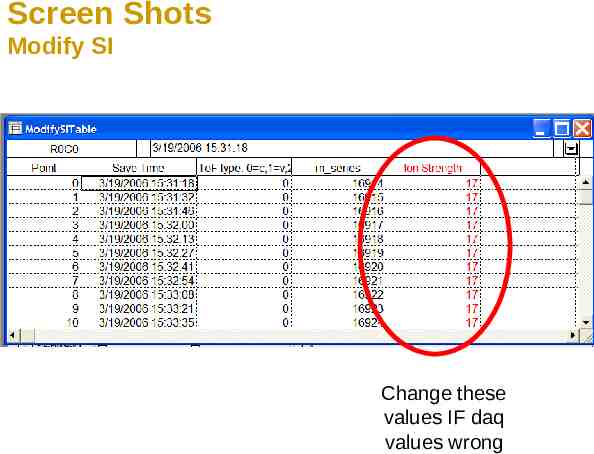
Screen Shots Modify SI Change these values IF daq values wrong
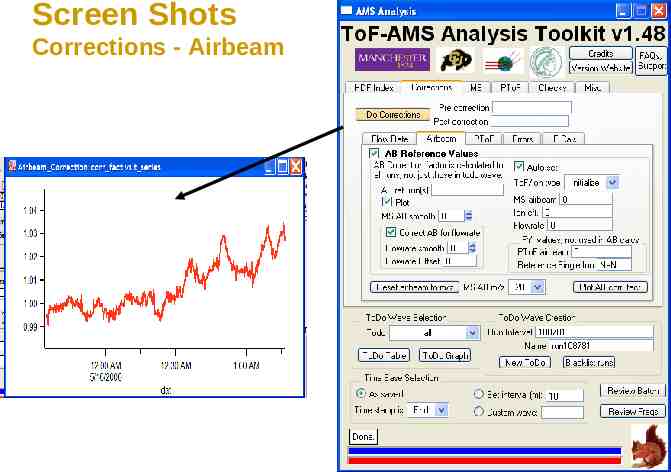
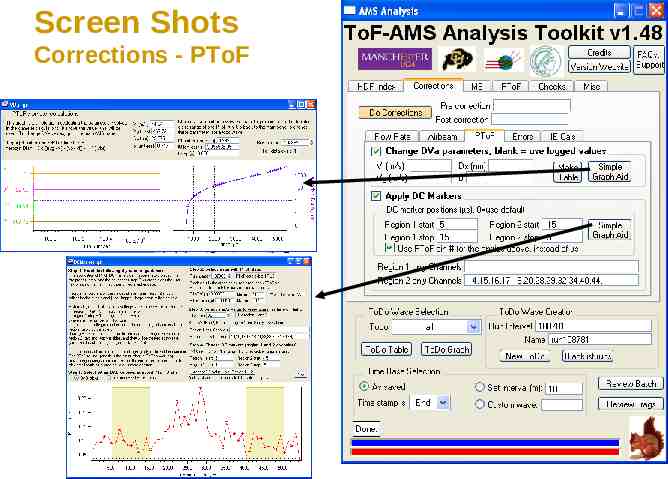
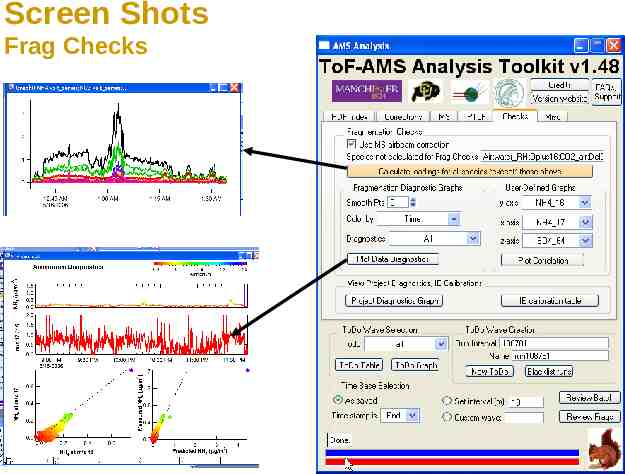
Squirrel Data Analysis Flow Chart Complete Look HDF Index Tab Get Index Pre-Process m/z fitting params Check baseline Modify SI baseline fitting params Ion user Pre-Process Airbeam corr fact Do Corrections PToF size dist, mass spec, image, etc. Corrections Tab time series avgs, etc. Frag Checks Tab size dist, mass spec, image, etc. Check m/z calibration p data (recalc sticks) MS Tab time series avgs, etc. PToF Tab MS Tab p data (DAQ sticks) Get Index PToF Tab HDF Index Tab Quick Look p data (dc marker) Calc Loadings Loading waves Tweak Frag table Diagnostics Plot
Screen Shots Corrections - Airbeam
Screen Shots Corrections - PToF
Screen Shots Frag Checks
Squirrel Data Analysis Flow Chart Complete Look HDF Index Tab Get Index Pre-Process m/z fitting params Check baseline Modify SI baseline fitting params Ion user Pre-Process Airbeam corr fact Do Corrections PToF size dist, mass spec, image, etc. Corrections Tab time series avgs, etc. Frag Checks Tab size dist, mass spec, image, etc. Check m/z calibration p data (recalc sticks) MS Tab time series avgs, etc. PToF Tab MS Tab p data (DAQ sticks) Get Index PToF Tab HDF Index Tab Quick Look p data (dc marker) Calc Loadings Loading waves Tweak Frag table Diagnostics Plot
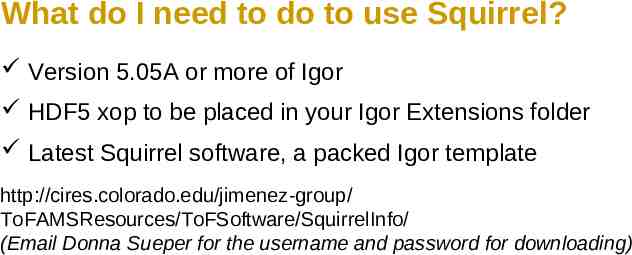
What do I need to do to use Squirrel? Version 5.05A or more of Igor HDF5 xop to be placed in your Igor Extensions folder Latest Squirrel software, a packed Igor template http://cires.colorado.edu/jimenez-group/ ToFAMSResources/ToFSoftware/SquirrelInfo/ (Email Donna Sueper for the username and password for downloading)
What is next for Squirrel? Continued bug fixing Implement existing feature requests * Journal interface * Misc panel & graph tweaking
Where can I go for more Squirrel info? http://cires.colorado.edu/jimenez-group/wiki/index.php/ToF-A MS Analysis Software
Thanks! Thanks to fellow coders Special thanks to James Allan Thanks in advance for the ongoing collaboration We are squirrel !