Selecting a Valid Sample Size for Longitudinal and Multilevel


94 Slides2.10 MB
Selecting a Valid Sample Size for Longitudinal and Multilevel Studies in Cancer Research: Software and Methods Deborah H. Glueck, Sarah M. Kreidler, Brandy M. Ringham, Keith E. Muller 1
Outline Determining sample size and power for complex designs Calculating power with our free, web-based software Writing the grant Novel results for missing data Questions 2
Outline Determining sample size and power for complex designs Calculating power with our free, web-based software Writing the grant Novel results for missing data Questions 3
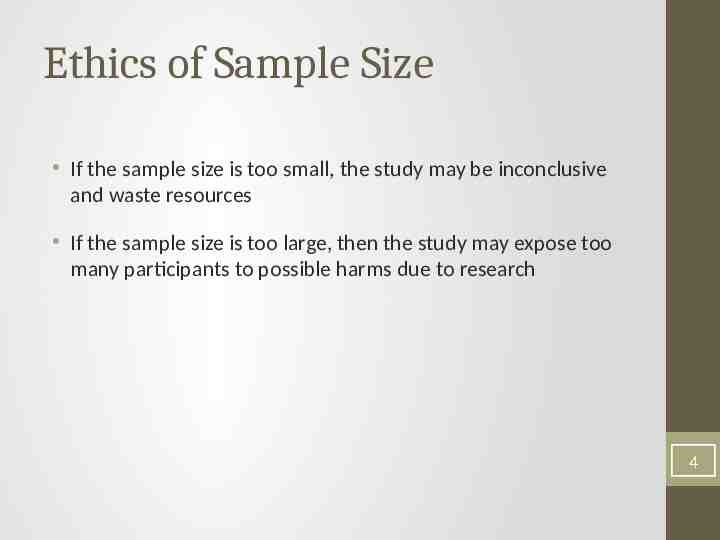
Ethics of Sample Size If the sample size is too small, the study may be inconclusive and waste resources If the sample size is too large, then the study may expose too many participants to possible harms due to research 4
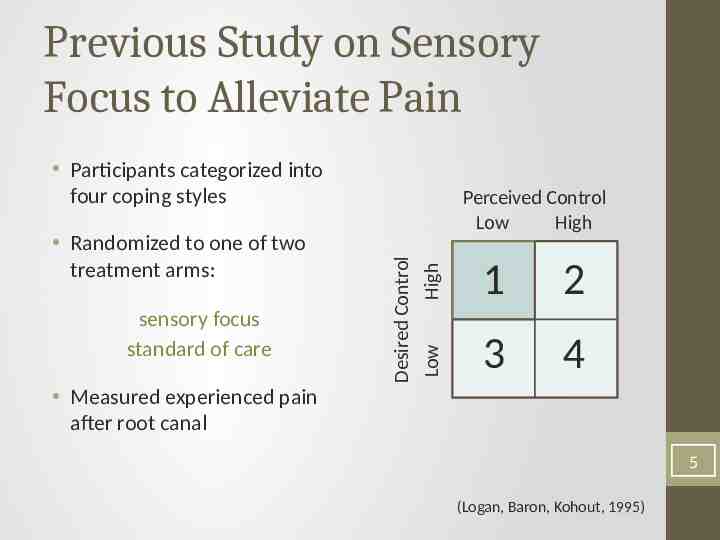
Previous Study on Sensory Focus to Alleviate Pain Participants categorized into four coping styles High 1 2 Low sensory focus standard of care Desired Control Randomized to one of two treatment arms: Perceived Control High Low 3 4 Measured experienced pain after root canal 5 (Logan, Baron, Kohout, 1995)
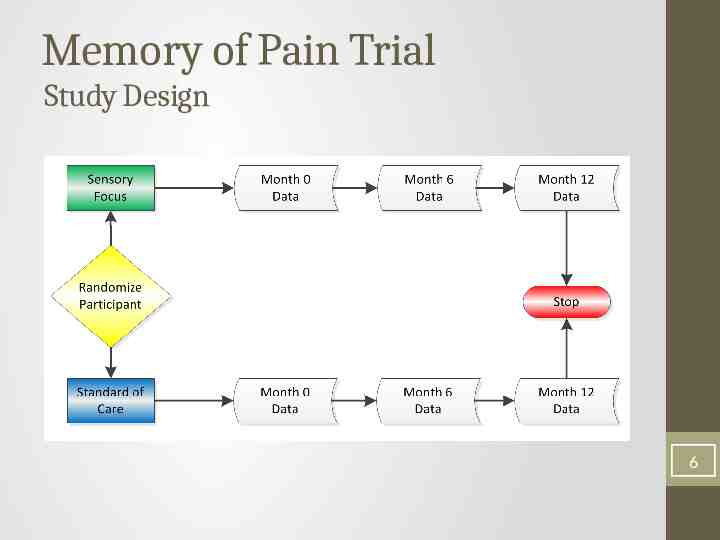
Memory of Pain Trial Study Design 6
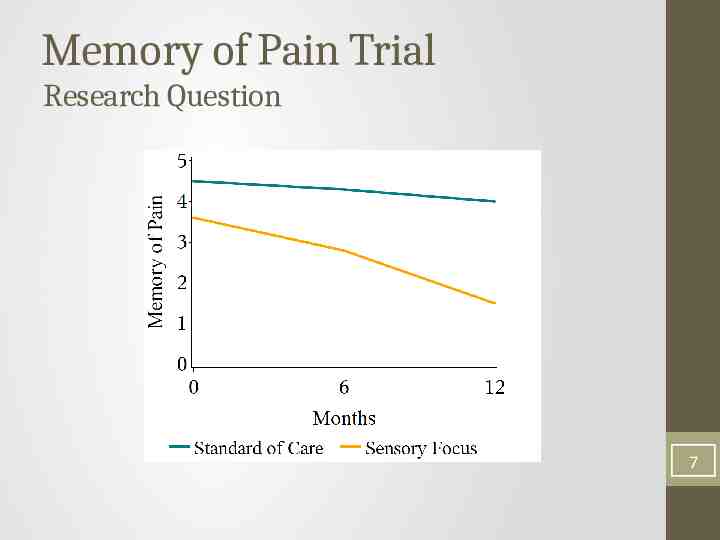
Memory of Pain Trial Research Question 7
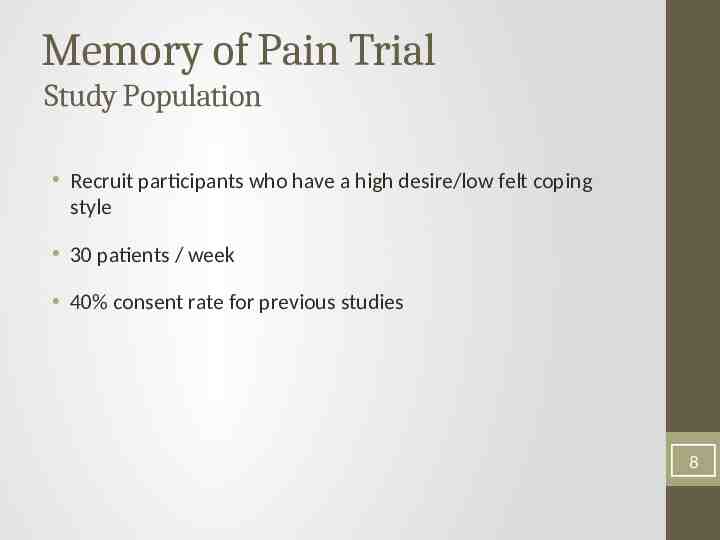
Memory of Pain Trial Study Population Recruit participants who have a high desire/low felt coping style 30 patients / week 40% consent rate for previous studies 8
How do we calculate an accurate sample size? 9
Inputs for Power Analysis Type I error rate: Desired power: Loss to follow-up: 10
Inputs for Power Analysis Type I error rate: 0.01 Desired power: Loss to follow-up: 11
Inputs for Power Analysis Type I error rate: 0.01 Desired power: 0.90 Loss to follow-up: 12
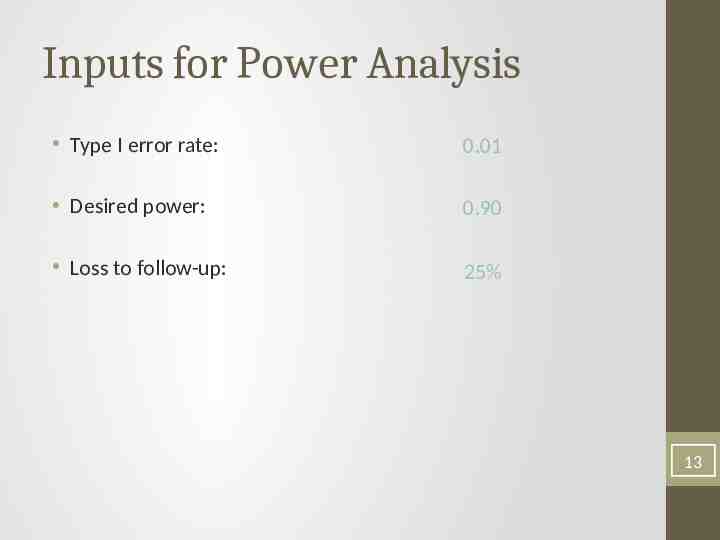
Inputs for Power Analysis Type I error rate: 0.01 Desired power: 0.90 Loss to follow-up: 25% 13
Outline Determining sample size and power for complex designs Calculating power with our free, web-based software Writing the grant Novel results for missing data Questions 14
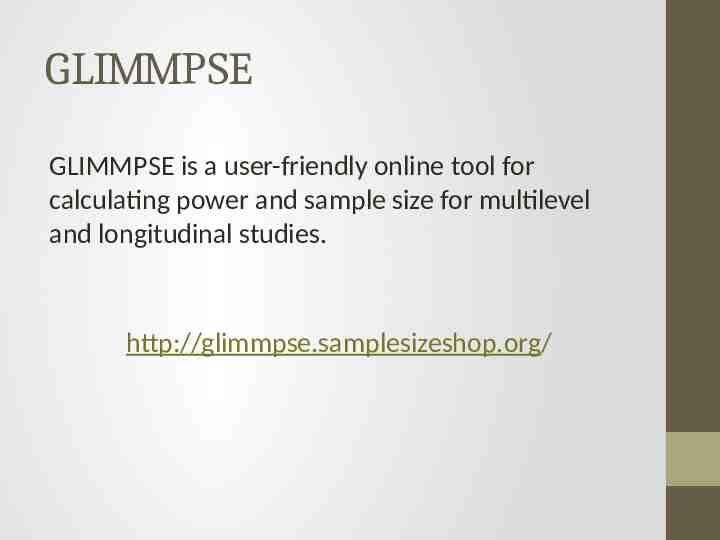
GLIMMPSE GLIMMPSE is a user-friendly online tool for calculating power and sample size for multilevel and longitudinal studies. http://glimmpse.samplesizeshop.org/
Salient Software Features Free Requires no programming expertise Allows saving study designs for later use Also available on smartphones Coming soon on iPad
Create a Study Design 17
Create a Study Design Select Guided Study Design 18
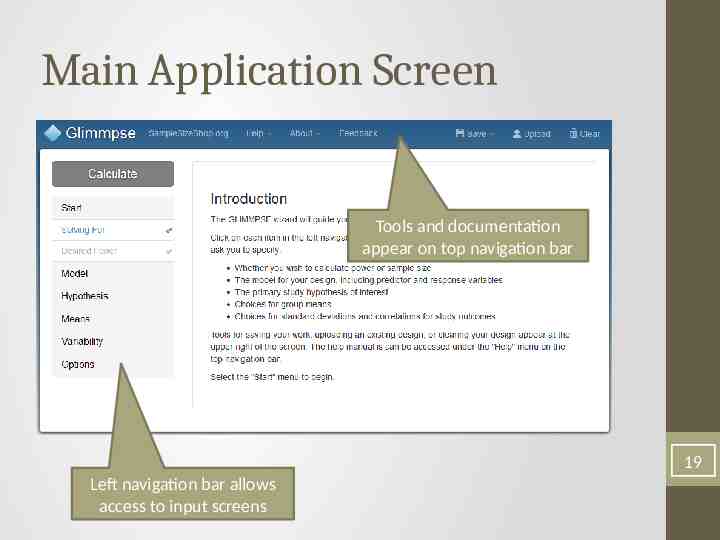
Main Application Screen Tools and documentation appear on top navigation bar 19 Left navigation bar allows access to input screens
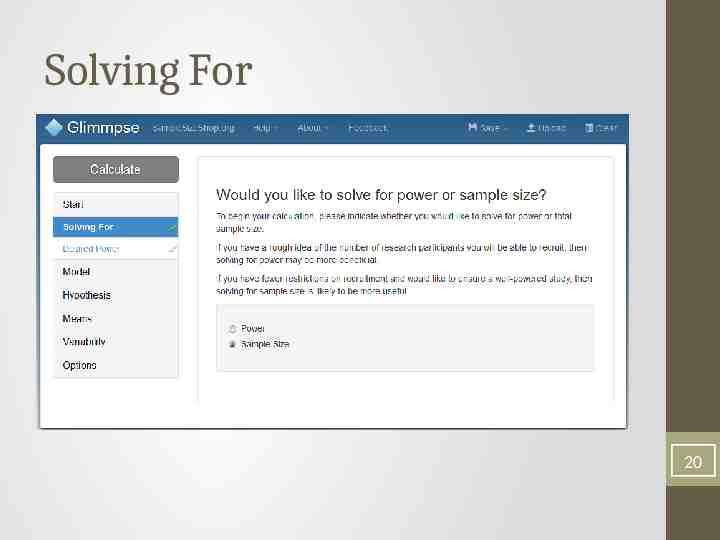
Solving For 20
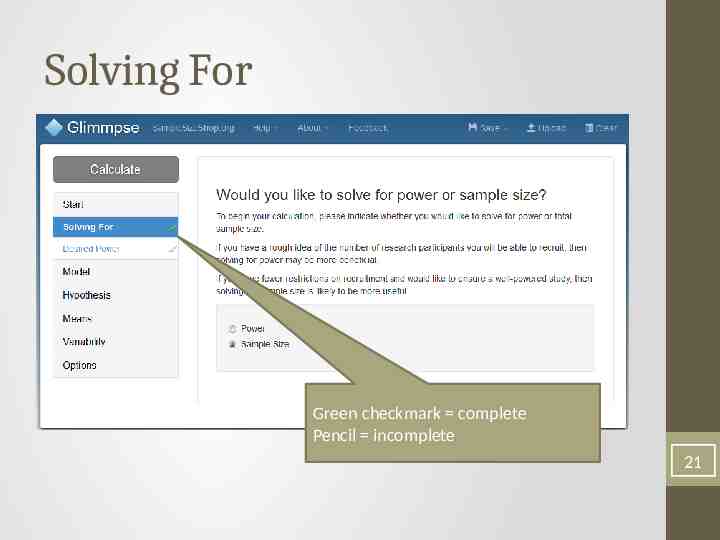
Solving For Green checkmark complete Pencil incomplete 21
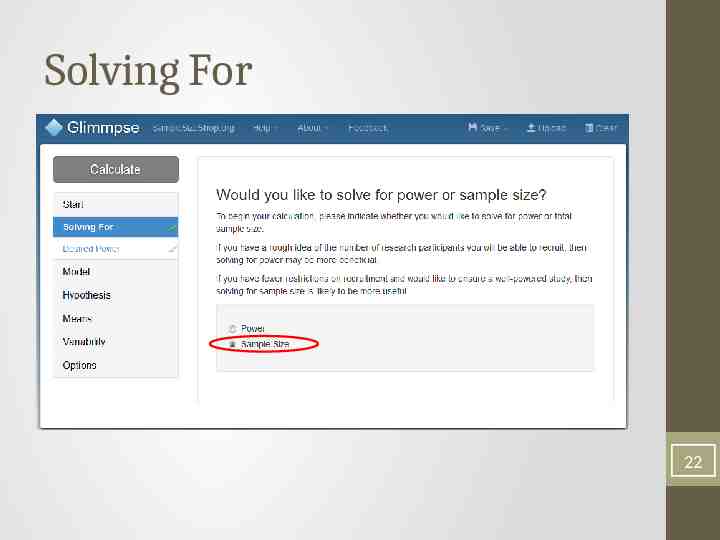
Solving For 22
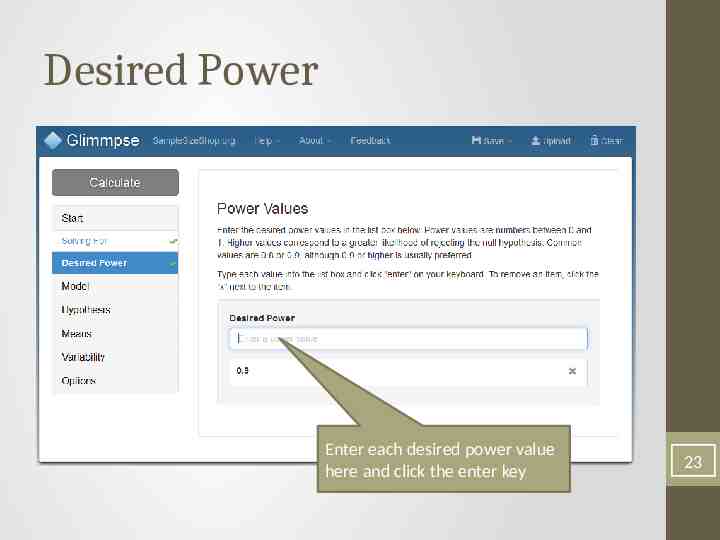
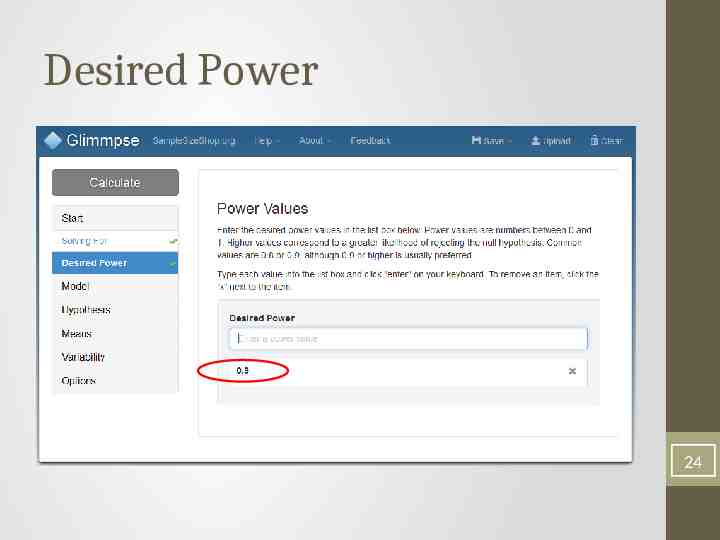
Desired Power Enter each desired power value here and click the enter key 23
Desired Power 24
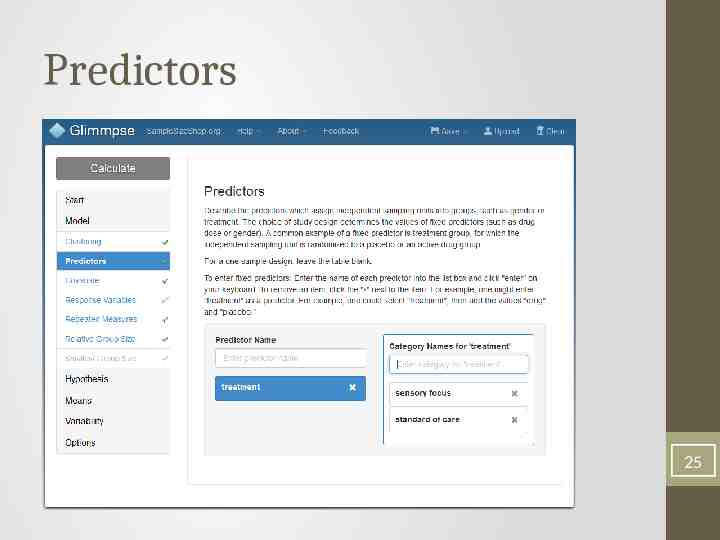
Predictors 25
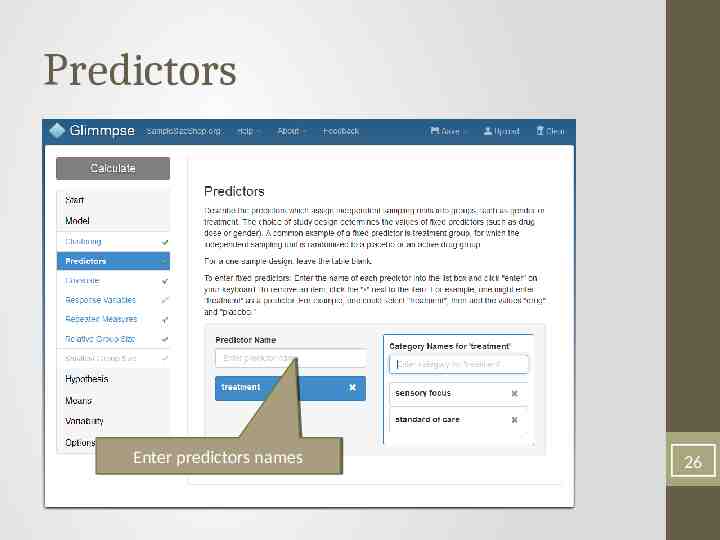
Predictors Enter Enter predictors predictors names names 26
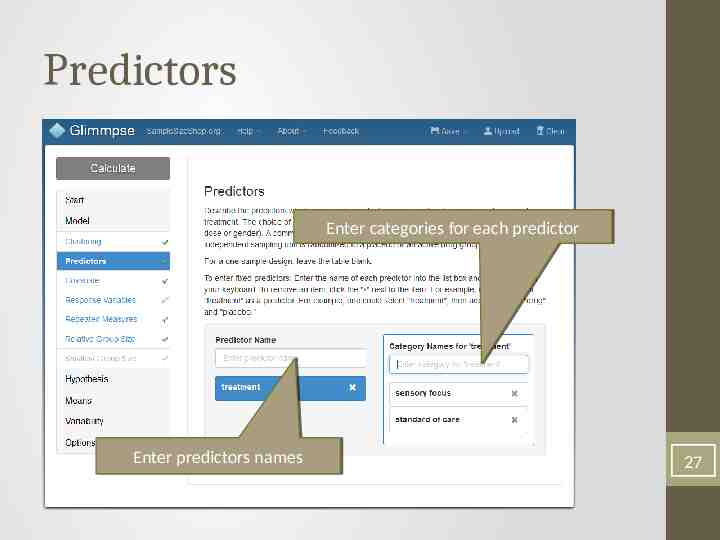
Predictors Enter Enter categories categories for for each each predictor predictor Enter Enter predictors predictors names names 27
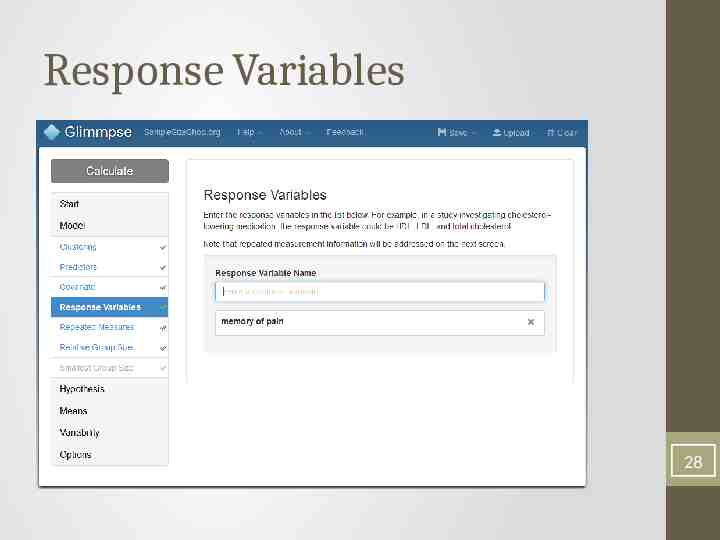
Response Variables 28
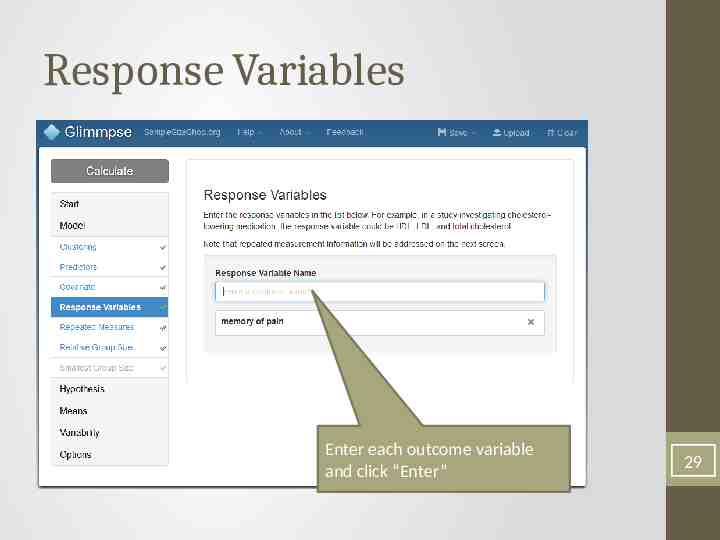
Response Variables Enter each outcome variable and click “Enter” 29
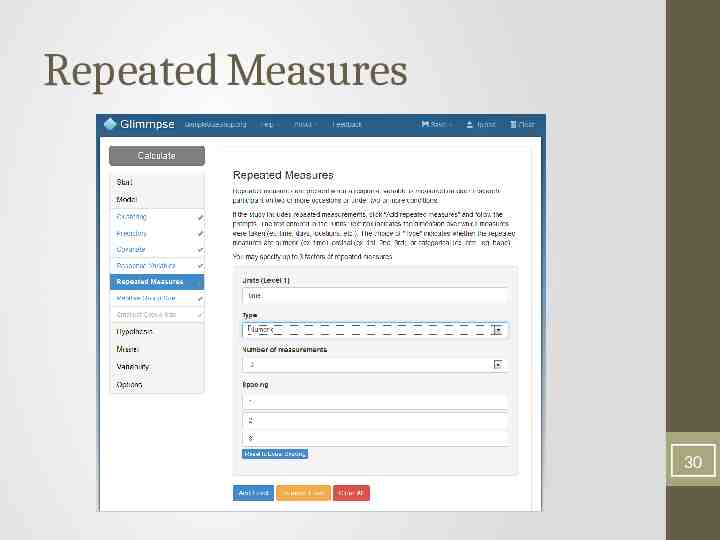
Repeated Measures 30
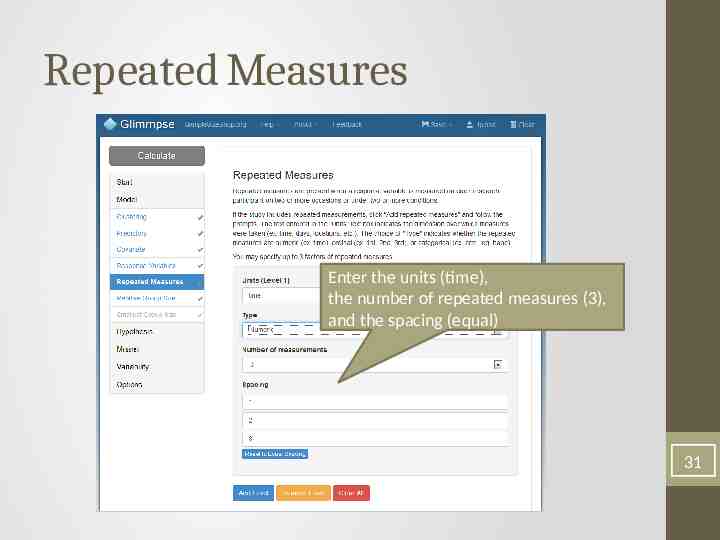
Repeated Measures Enter the units (time), the number of repeated measures (3), and the spacing (equal) 31
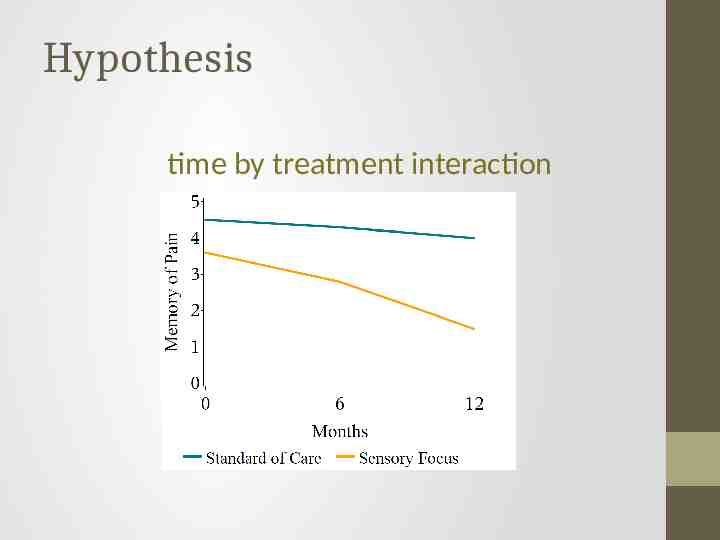
Hypothesis time by treatment interaction
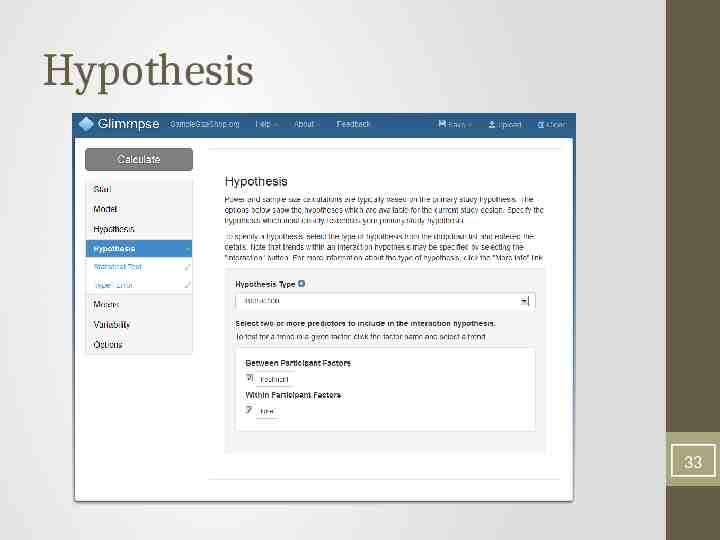
Hypothesis 33
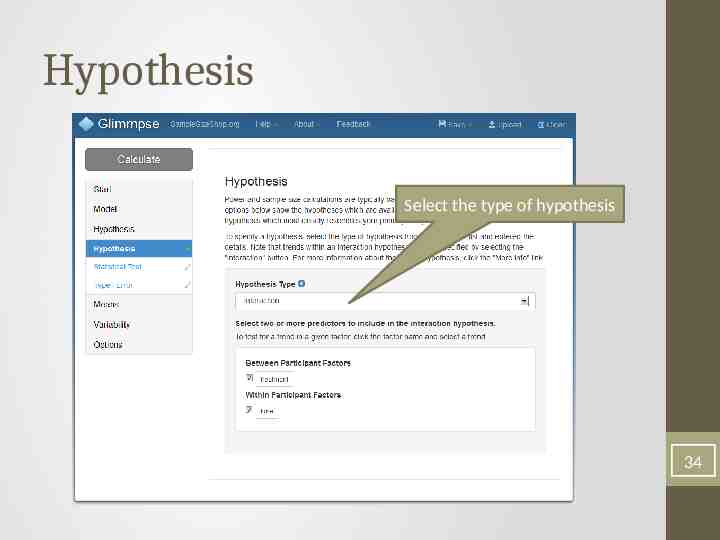
Hypothesis Select the type of hypothesis 34
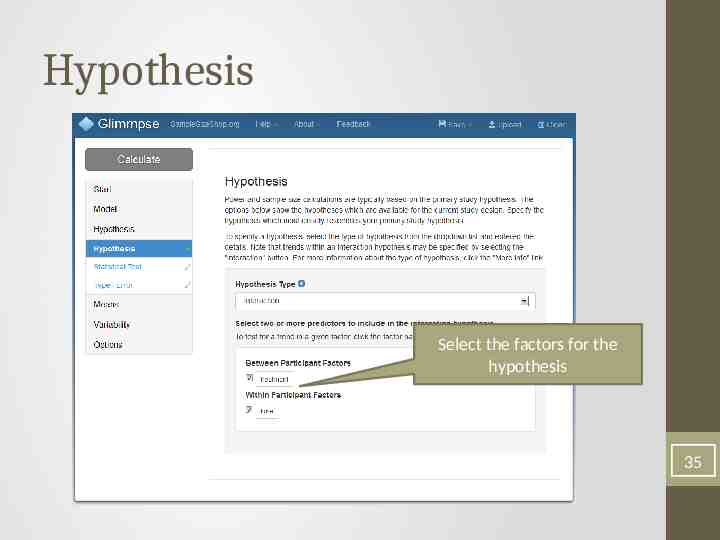
Hypothesis Select the factors for the hypothesis 35
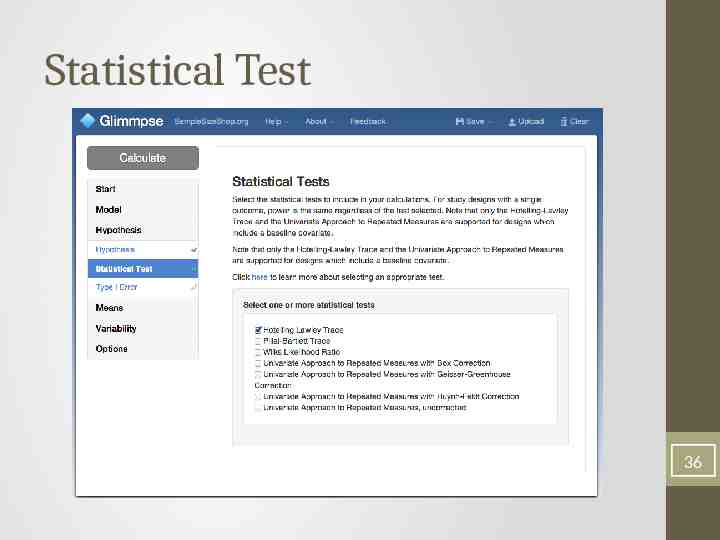
Statistical Test 36
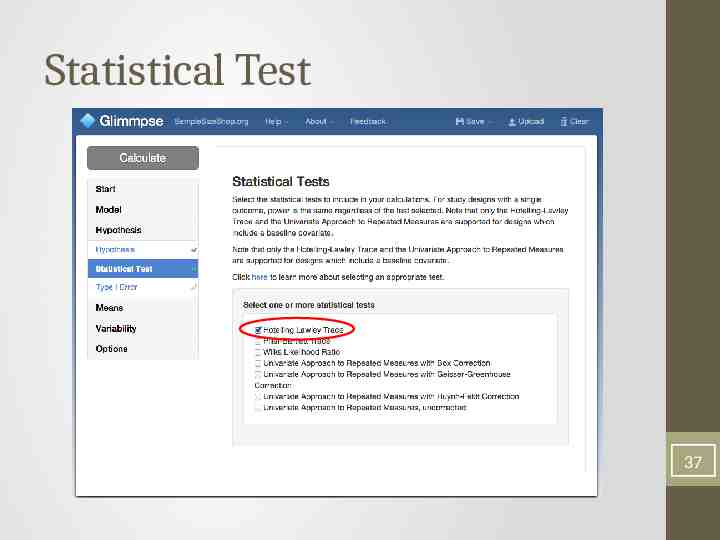
Statistical Test 37
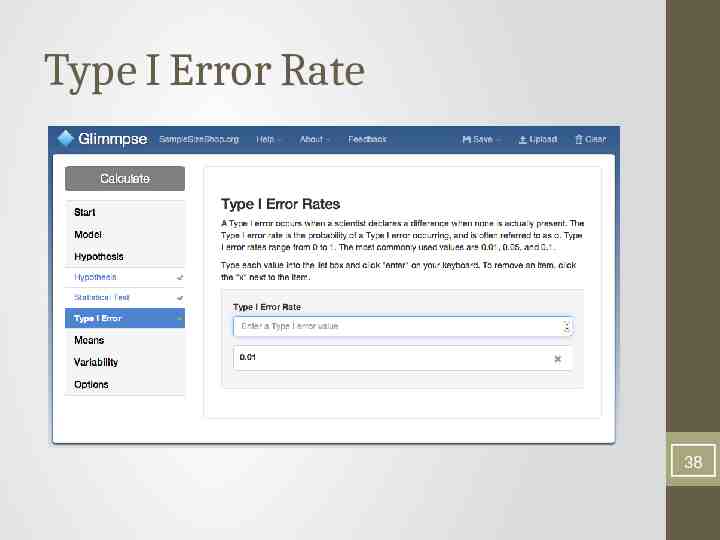
Type I Error Rate 38
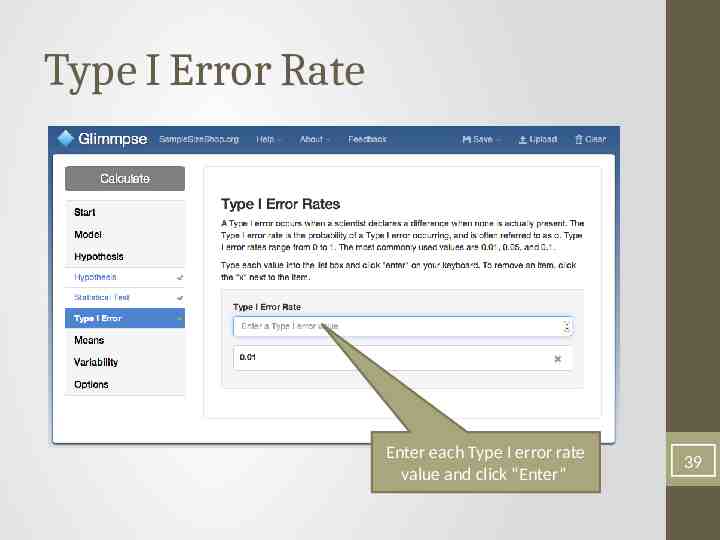
Type I Error Rate Enter each Type I error rate value and click “Enter” 39
Choices for Means and Variance So far, all inputs are known as part of the study design We now must obtain reasonable values for mean differences and variability to complete the calculation 40
Where Can I Find Means, Variances, and Correlations? Pilot study Similar published research Unpublished internal studies Clinical experience 41
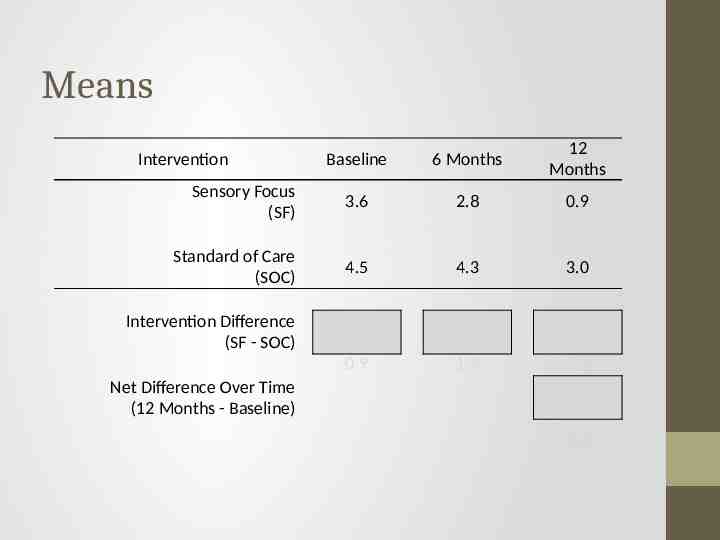
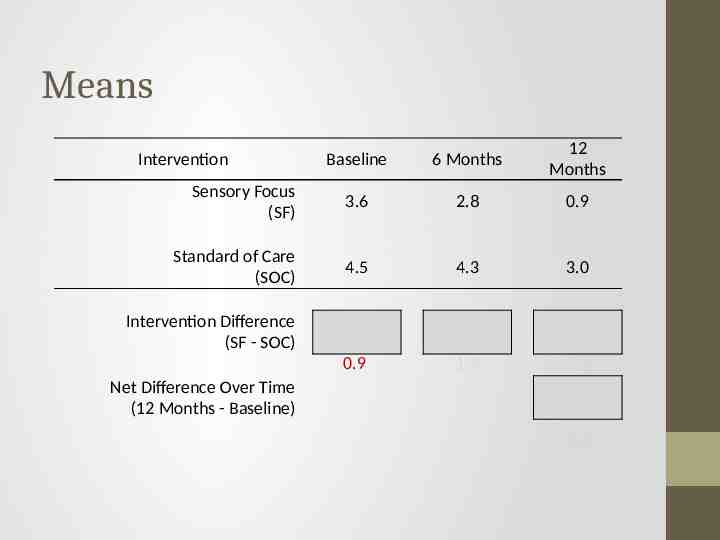
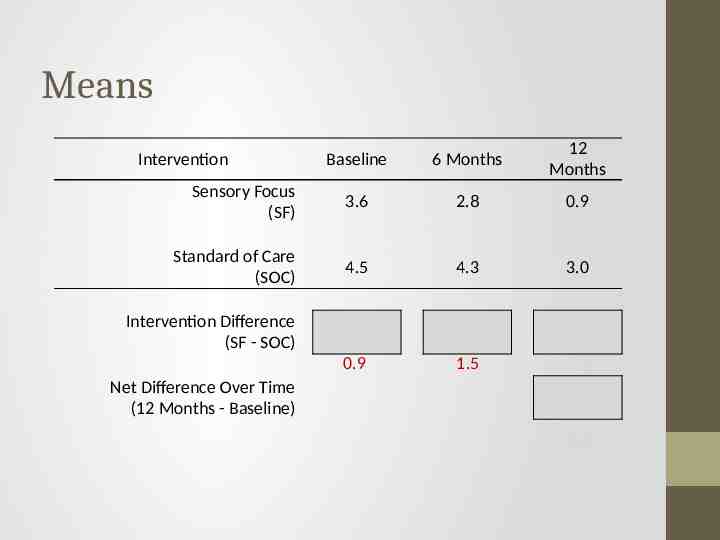
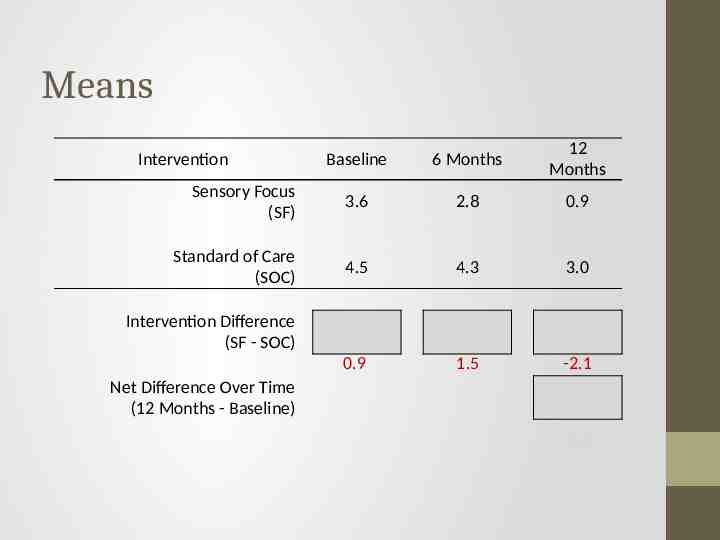
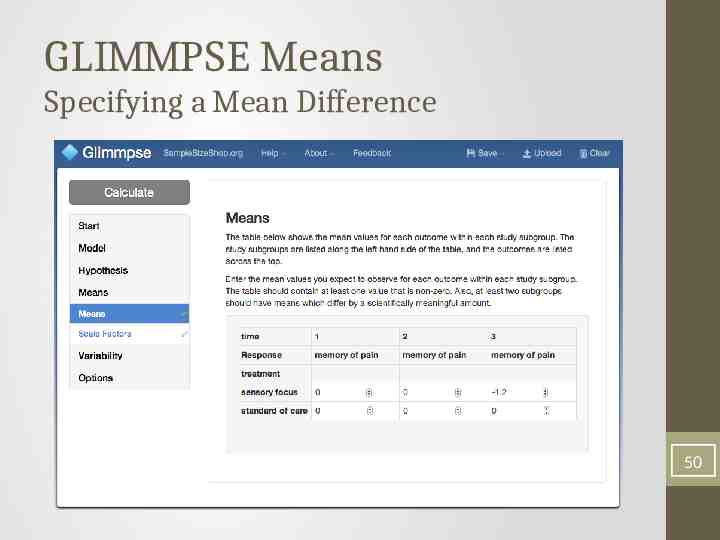
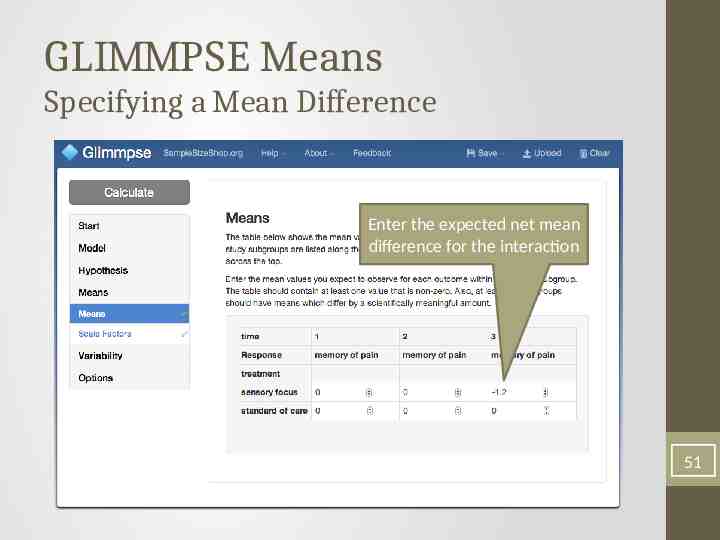
Means Baseline 6 Months 12 Months Sensory Focus (SF) 3.6 2.8 0.9 Standard of Care (SOC) 4.5 4.3 3.0 0.9 1.5 -2.1 Intervention Intervention Difference (SF - SOC) Net Difference Over Time (12 Months - Baseline) -1.2
Means Baseline 6 Months 12 Months Sensory Focus (SF) 3.6 2.8 0.9 Standard of Care (SOC) 4.5 4.3 3.0 0.9 1.5 -2.1 Intervention Intervention Difference (SF - SOC) Net Difference Over Time (12 Months - Baseline) -1.2
Means Baseline 6 Months 12 Months Sensory Focus (SF) 3.6 2.8 0.9 Standard of Care (SOC) 4.5 4.3 3.0 0.9 1.5 -2.1 Intervention Intervention Difference (SF - SOC) Net Difference Over Time (12 Months - Baseline) -1.2
Means Baseline 6 Months 12 Months Sensory Focus (SF) 3.6 2.8 0.9 Standard of Care (SOC) 4.5 4.3 3.0 0.9 1.5 -2.1 Intervention Intervention Difference (SF - SOC) Net Difference Over Time (12 Months - Baseline) -1.2
Means Baseline 6 Months 12 Months Sensory Focus (SF) 3.6 2.8 0.9 Standard of Care (SOC) 4.5 4.3 3.0 0.9 1.5 -2.1 Intervention Intervention Difference (SF - SOC) Net Difference Over Time (12 Months - Baseline) -1.2
Variances and Correlations Consider the sources of variability and correlation in the study design Repeated measures within a given participant will be correlated Outcome measurements will vary between participants
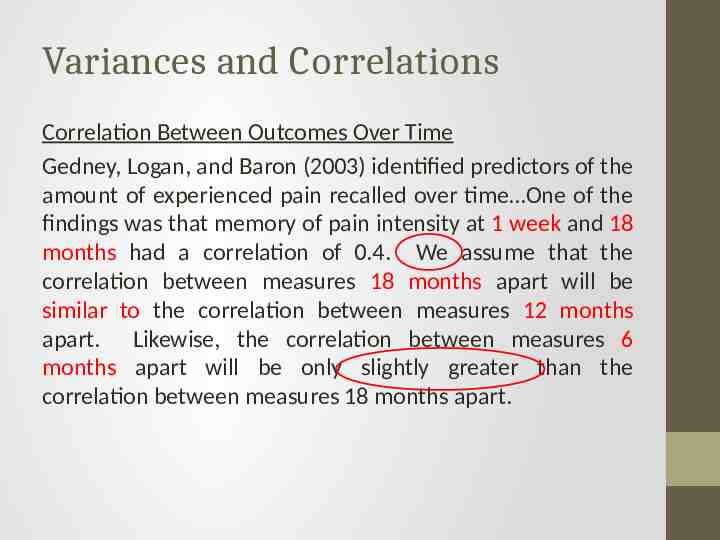
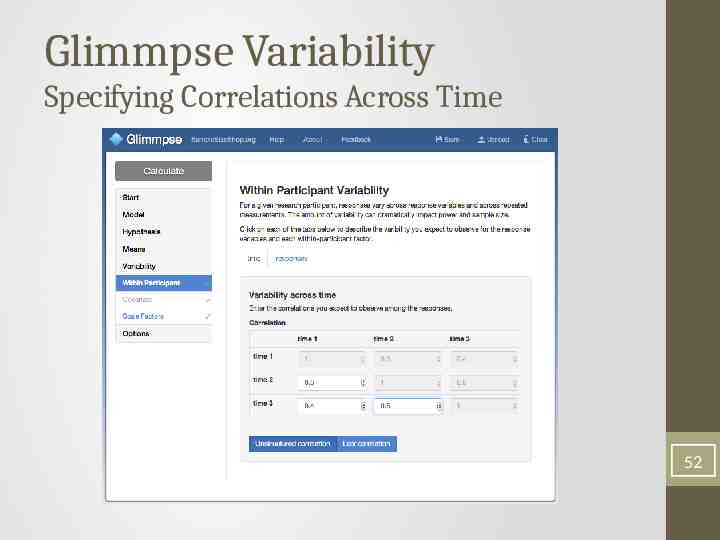
Variances and Correlations Correlation Between Outcomes Over Time Gedney, Logan, and Baron (2003) identified predictors of the amount of experienced pain recalled over time One of the findings was that memory of pain intensity at 1 week and 18 months had a correlation of 0.4. We assume that the correlation between measures 18 months apart will be similar to the correlation between measures 12 months apart. Likewise, the correlation between measures 6 months apart will be only slightly greater than the correlation between measures 18 months apart.
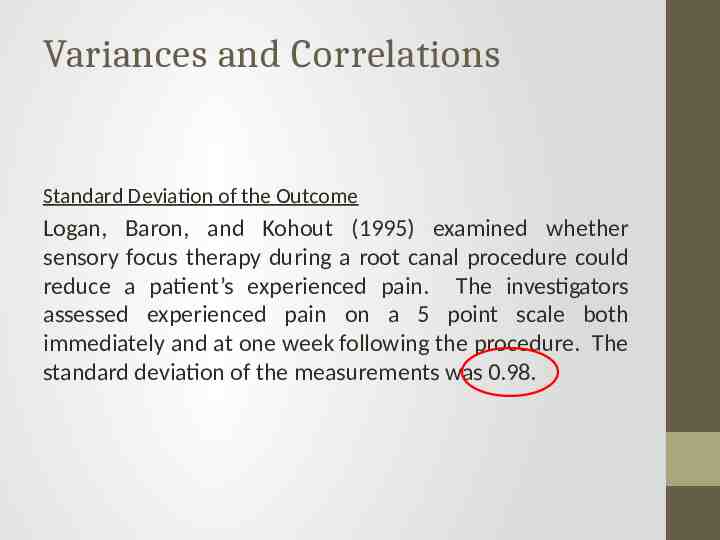
Variances and Correlations Standard Deviation of the Outcome Logan, Baron, and Kohout (1995) examined whether sensory focus therapy during a root canal procedure could reduce a patient’s experienced pain. The investigators assessed experienced pain on a 5 point scale both immediately and at one week following the procedure. The standard deviation of the measurements was 0.98.
GLIMMPSE Means Specifying a Mean Difference 50
GLIMMPSE Means Specifying a Mean Difference Enter the expected net mean difference for the interaction 51
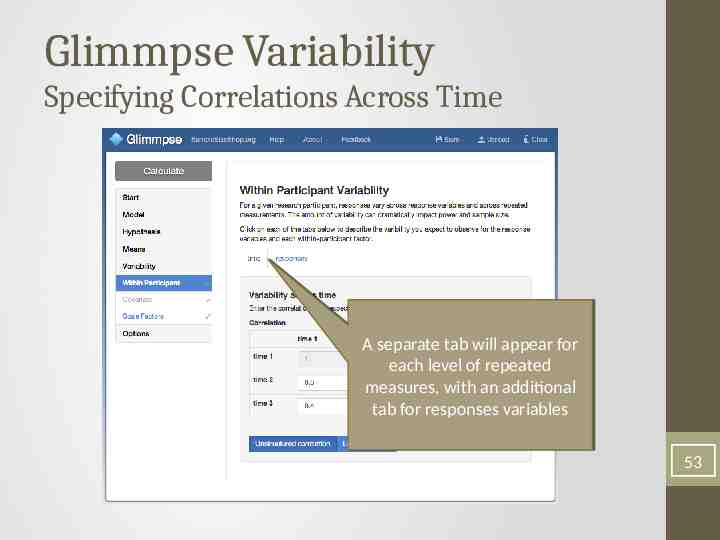
Glimmpse Variability Specifying Correlations Across Time 52
Glimmpse Variability Specifying Correlations Across Time AA separate separate tab tab will will appear appear for for each each level level of of repeated repeated measures, measures, with with an an additional additional tab tab for for responses responses variables variables 53
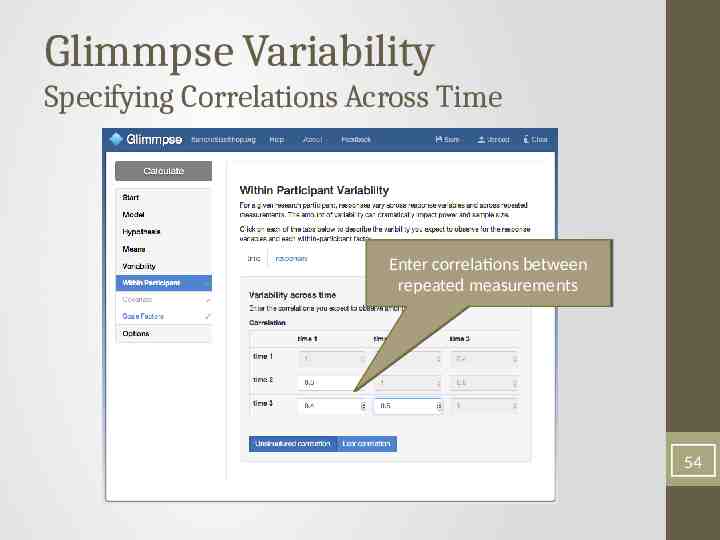
Glimmpse Variability Specifying Correlations Across Time Enter Enter correlations correlations between between repeated repeated measurements measurements 54
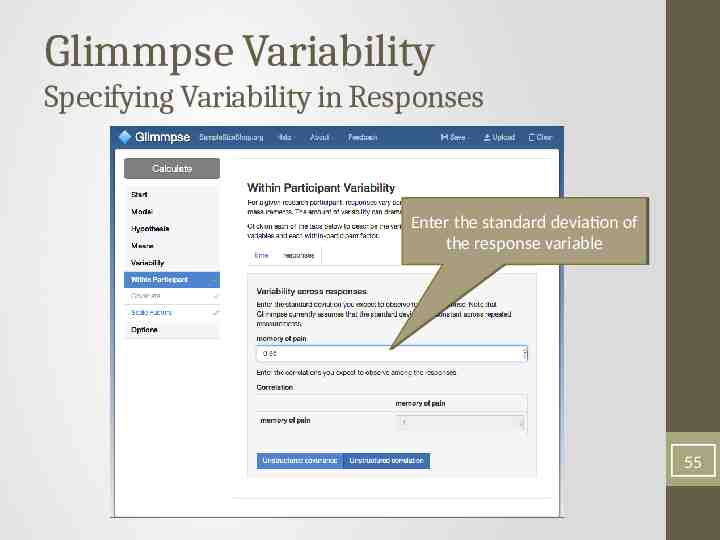
Glimmpse Variability Specifying Variability in Responses Enter Enter the the standard standard deviation deviation of of the the response response variable variable 55
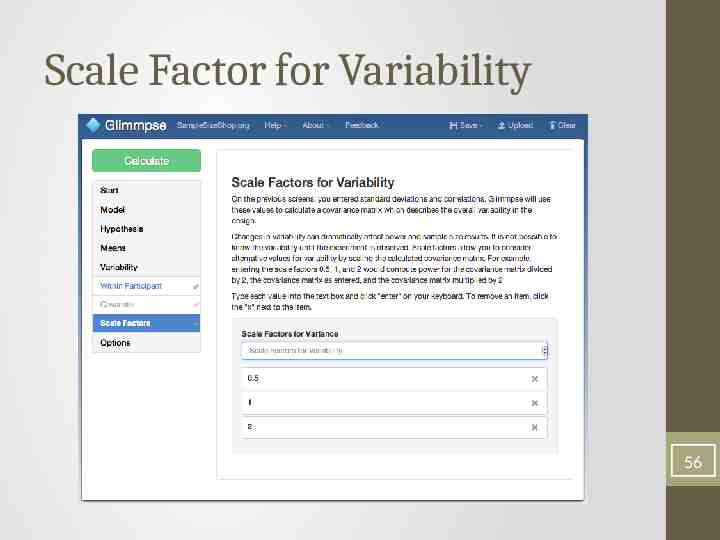
Scale Factor for Variability 56
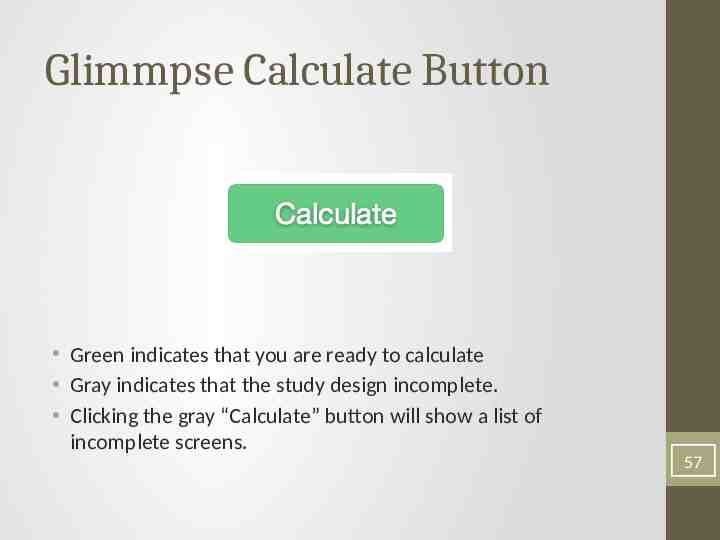
Glimmpse Calculate Button Green indicates that you are ready to calculate Gray indicates that the study design incomplete. Clicking the gray “Calculate” button will show a list of incomplete screens. 57
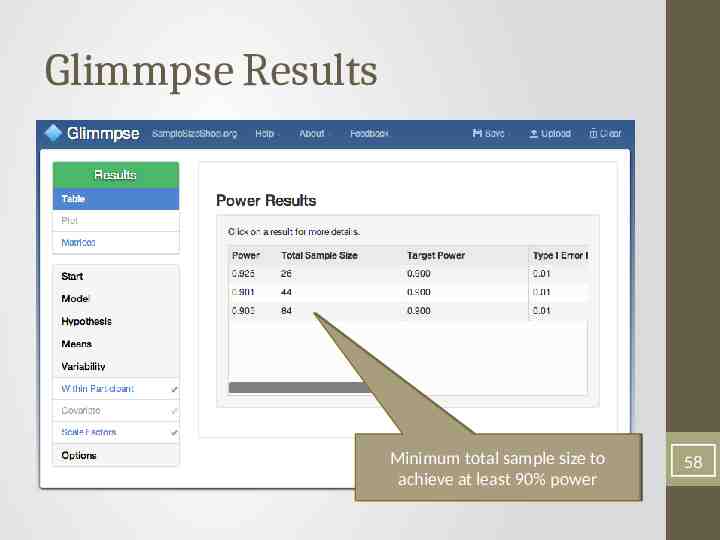
Glimmpse Results Minimum Minimum total total sample sample size size to to achieve achieve at at least least 90% 90% power power 58
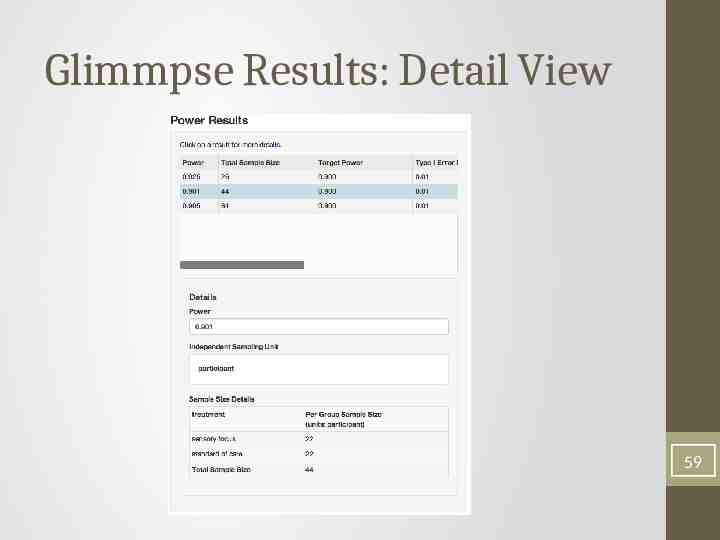
Glimmpse Results: Detail View 59
Outline Determining sample size and power for complex designs Calculating power with our free, web-based software Writing the grant Novel results for missing data Questions 60
Sample Size Calculation Summary We plan a repeated measures ANOVA using the Hotelling-Lawley trace to test for a time by treatment interaction. 61
Sample Size Calculation Summary We plan a repeated measures ANOVA using the Hotelling-Lawley trace to test for a time by treatment interaction. 62
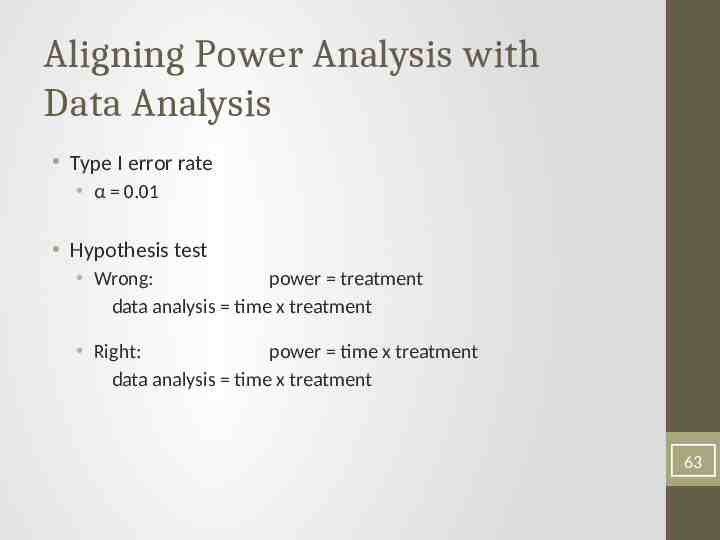
Aligning Power Analysis with Data Analysis Type I error rate α 0.01 Hypothesis test Wrong: power treatment data analysis time x treatment Right: power time x treatment data analysis time x treatment 63
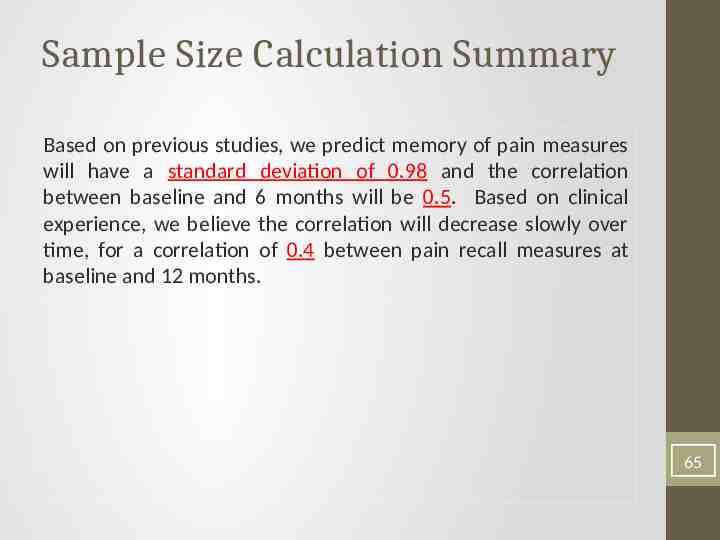
Sample Size Calculation Summary Based on previous studies, we predict memory of pain measures will have a standard deviation of 0.98 and the correlation between baseline and 6 months will be 0.5. Based on clinical experience, we believe the correlation will decrease slowly over time, for a correlation of 0.4 between pain recall measures at baseline and 12 months. 64
Sample Size Calculation Summary Based on previous studies, we predict memory of pain measures will have a standard deviation of 0.98 and the correlation between baseline and 6 months will be 0.5. Based on clinical experience, we believe the correlation will decrease slowly over time, for a correlation of 0.4 between pain recall measures at baseline and 12 months. 65
Justifying the Power Analysis Give all the values needed to recreate the power analysis Provide appropriate citation 66
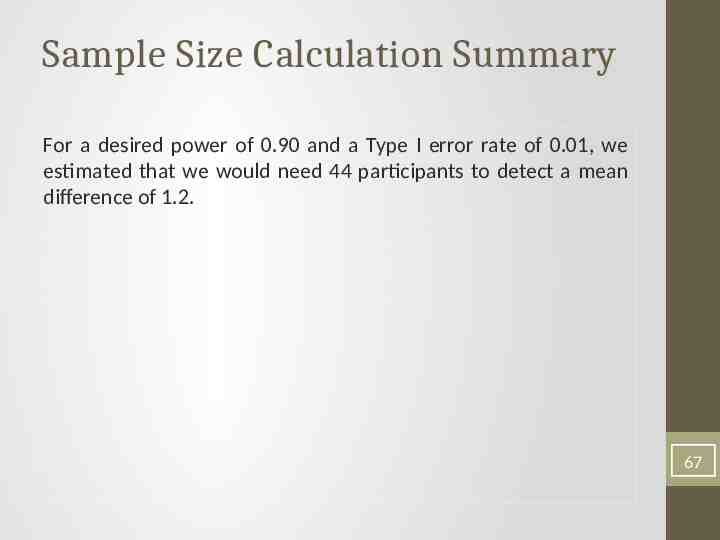
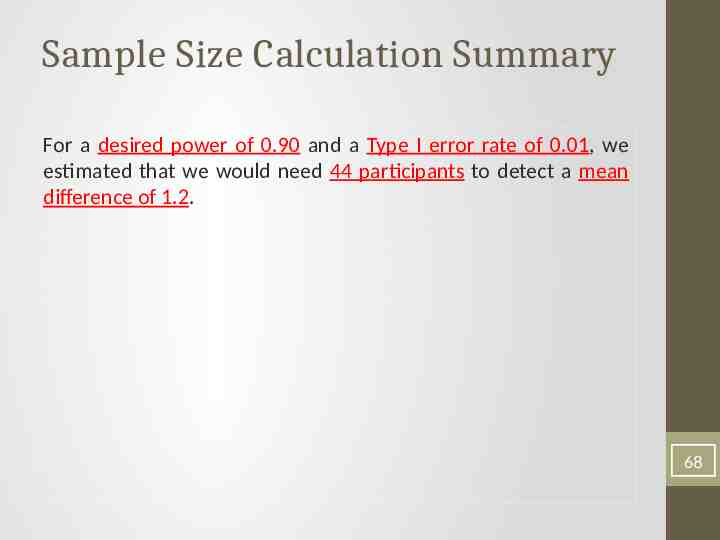
Sample Size Calculation Summary For a desired power of 0.90 and a Type I error rate of 0.01, we estimated that we would need 44 participants to detect a mean difference of 1.2. 67
Sample Size Calculation Summary For a desired power of 0.90 and a Type I error rate of 0.01, we estimated that we would need 44 participants to detect a mean difference of 1.2. 68
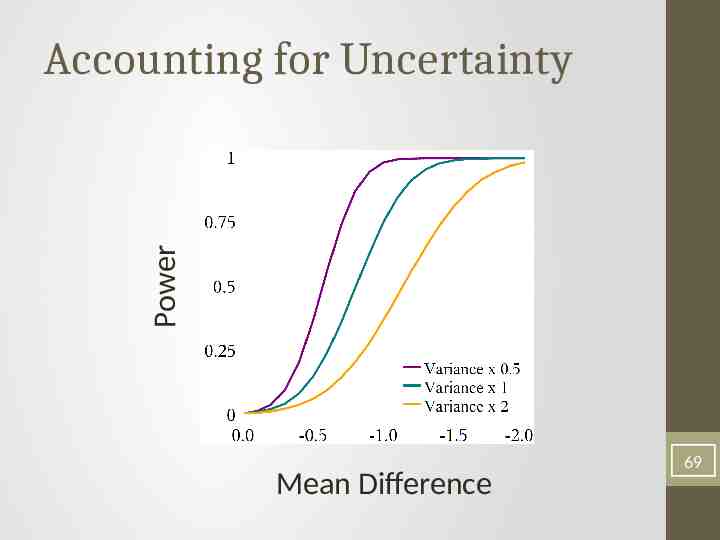
Power Accounting for Uncertainty Mean Difference 69
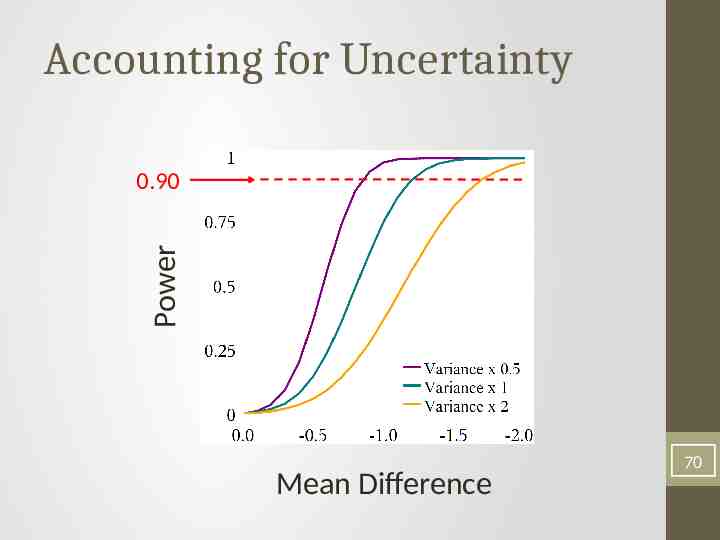
Accounting for Uncertainty Power 0.90 Mean Difference 70
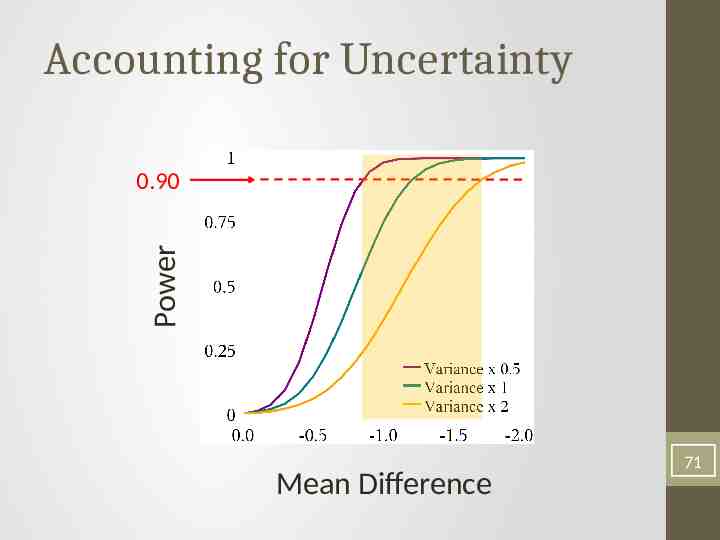
Accounting for Uncertainty Power 0.90 Mean Difference 71
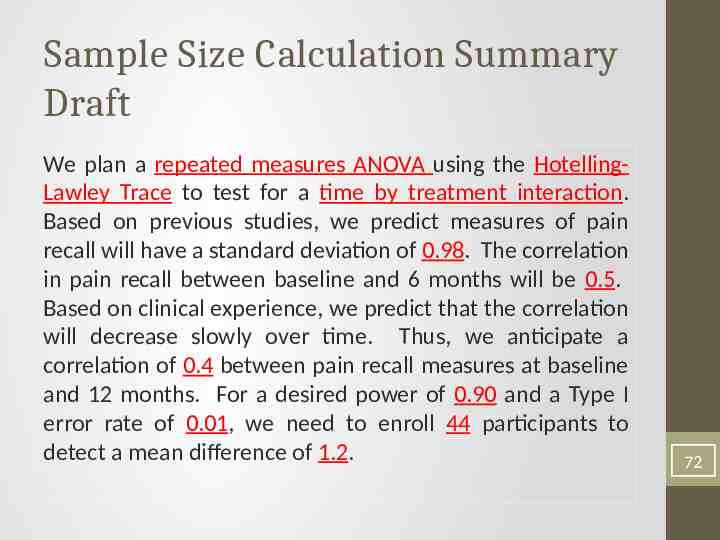
Sample Size Calculation Summary Draft We plan a repeated measures ANOVA using the HotellingLawley Trace to test for a time by treatment interaction. Based on previous studies, we predict measures of pain recall will have a standard deviation of 0.98. The correlation in pain recall between baseline and 6 months will be 0.5. Based on clinical experience, we predict that the correlation will decrease slowly over time. Thus, we anticipate a correlation of 0.4 between pain recall measures at baseline and 12 months. For a desired power of 0.90 and a Type I error rate of 0.01, we need to enroll 44 participants to detect a mean difference of 1.2. 72
Handling Missing Data 25% loss to follow-up Inflate calculated sample size by 25% 73
Handling Missing Data 25% loss to follow-up Inflate calculated sample size by 25% 74
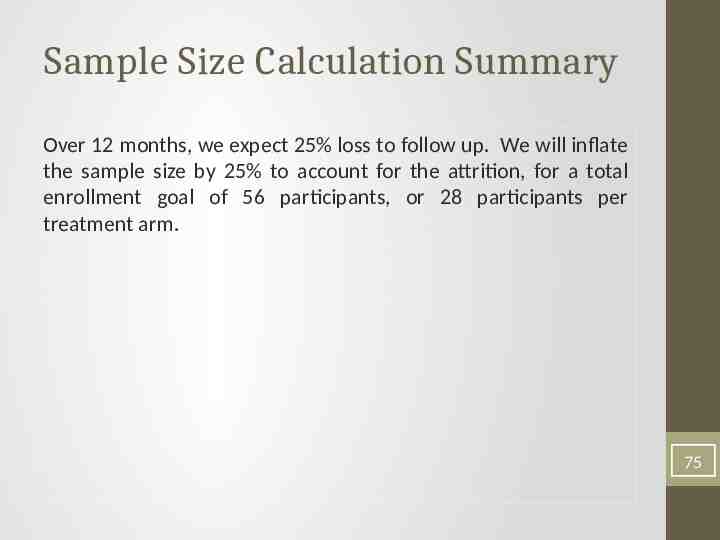
Sample Size Calculation Summary Over 12 months, we expect 25% loss to follow up. We will inflate the sample size by 25% to account for the attrition, for a total enrollment goal of 56 participants, or 28 participants per treatment arm. 75
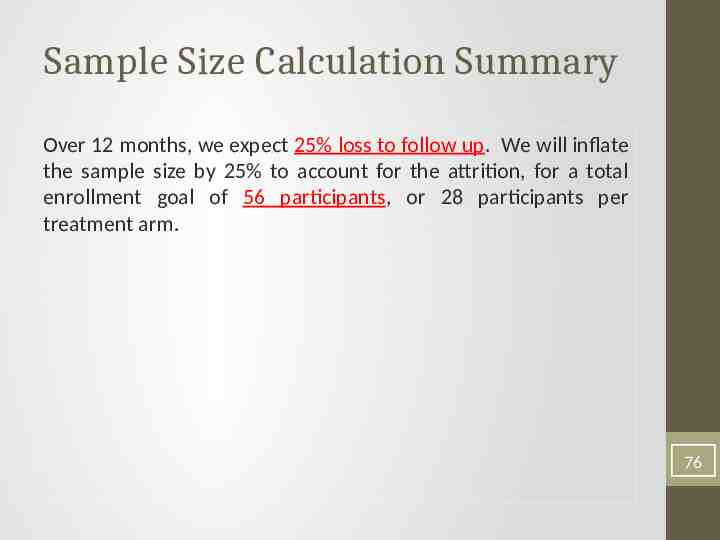
Sample Size Calculation Summary Over 12 months, we expect 25% loss to follow up. We will inflate the sample size by 25% to account for the attrition, for a total enrollment goal of 56 participants, or 28 participants per treatment arm. 76
Demonstrating Enrollment Feasibility Is the target population sufficiently large? Can recruitment be completed in the proposed time period? 77
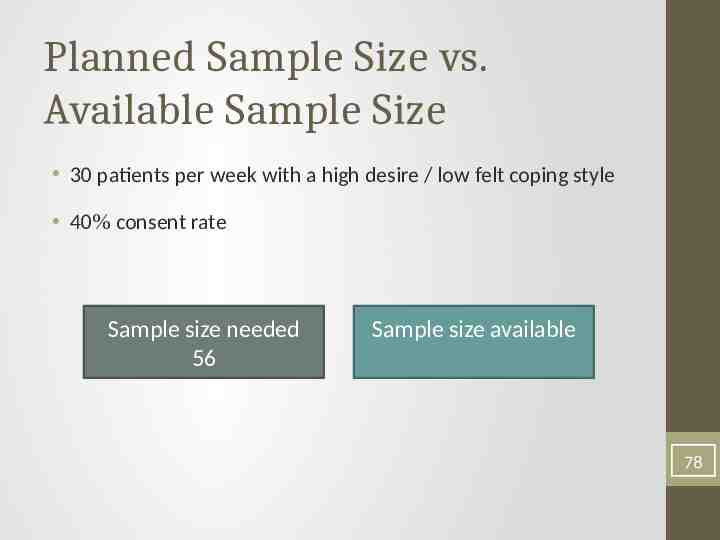
Planned Sample Size vs. Available Sample Size 30 patients per week with a high desire / low felt coping style 40% consent rate Sample size needed 56 Sample size available 78
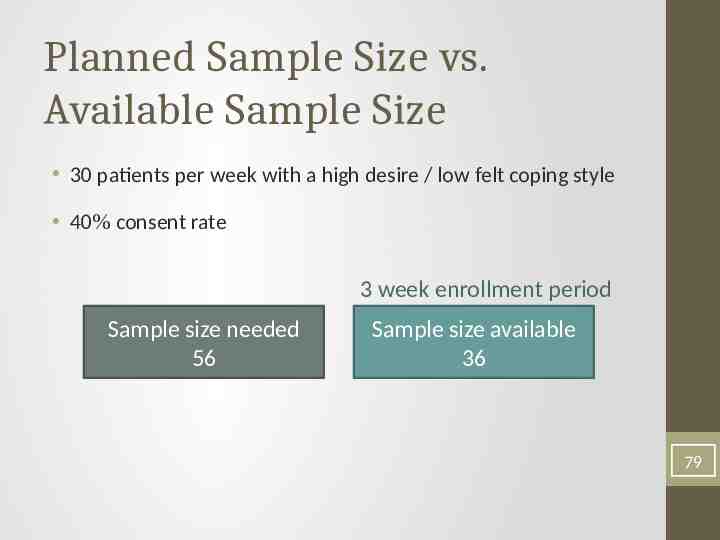
Planned Sample Size vs. Available Sample Size 30 patients per week with a high desire / low felt coping style 40% consent rate 3 week enrollment period Sample size needed 56 Sample size available 36 79
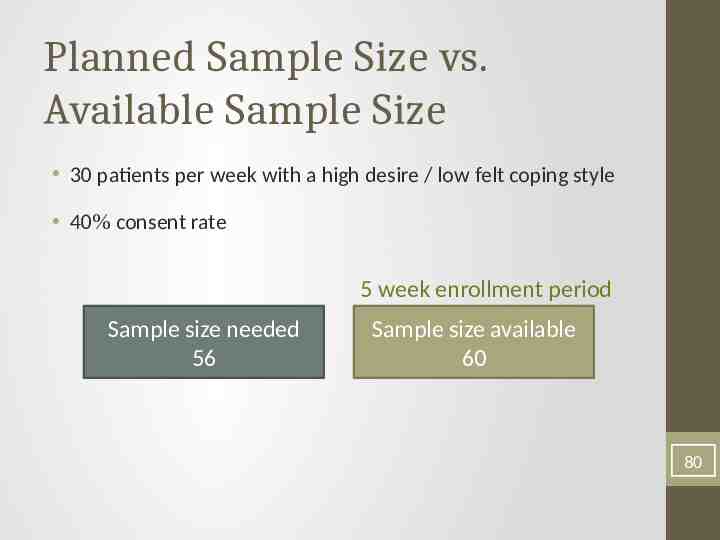
Planned Sample Size vs. Available Sample Size 30 patients per week with a high desire / low felt coping style 40% consent rate 5 week enrollment period Sample size needed 56 Sample size available 60 80
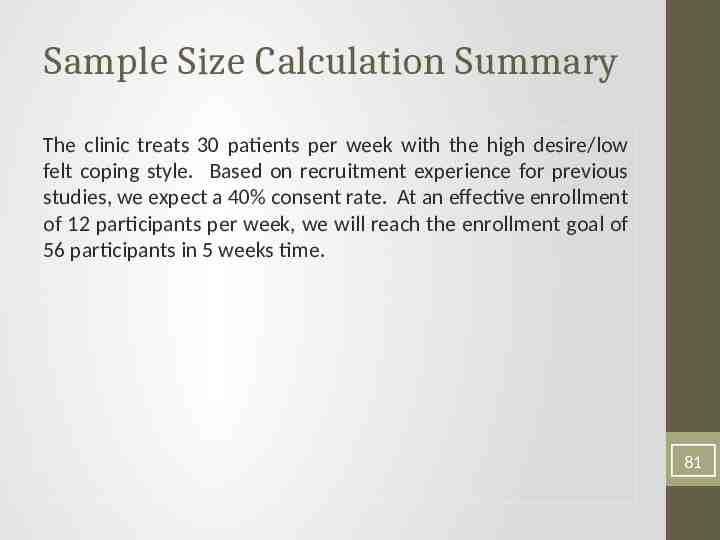
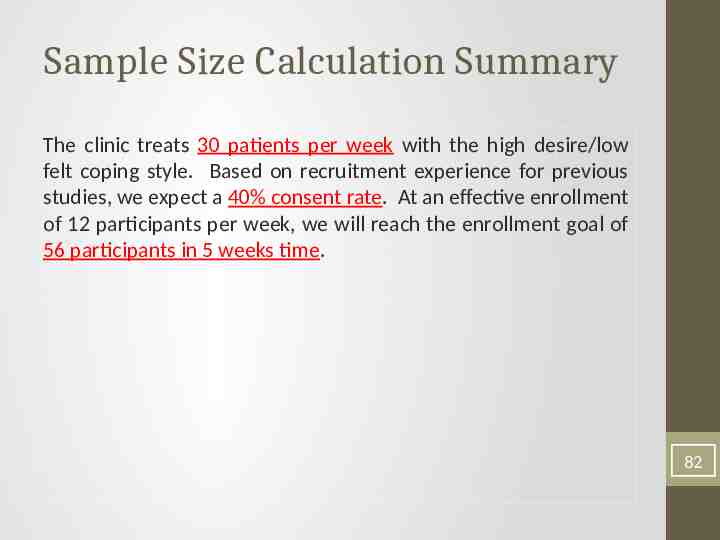
Sample Size Calculation Summary The clinic treats 30 patients per week with the high desire/low felt coping style. Based on recruitment experience for previous studies, we expect a 40% consent rate. At an effective enrollment of 12 participants per week, we will reach the enrollment goal of 56 participants in 5 weeks time. 81
Sample Size Calculation Summary The clinic treats 30 patients per week with the high desire/low felt coping style. Based on recruitment experience for previous studies, we expect a 40% consent rate. At an effective enrollment of 12 participants per week, we will reach the enrollment goal of 56 participants in 5 weeks time. 82
Planning for Multiple Aims Aims typically represent different hypotheses Maximum of the sample sizes calculated for each aim 83
Outline Determining sample size and power for complex designs Calculating power with our free, web-based software Writing the grant Novel results for missing data Questions 84
Background The Kenward and Roger Wald test in the linear mixed model improves Type I error control for small samples. For data analysis, Kenward and Roger described a scaled Wald statistic and corresponding central F reference distribution We describe a noncentral F power approximation for the Kenward and Roger (1997) Wald test
Existing power method for mixed models Helms (1992) described a noncentral F power approximation for the unscaled Wald test Stroup (1999) suggested an “exemplary data” approach Tu et al. (2004, 2007) derived a power function based on the asymptotic distribution of GEE estimates Muller et al. (2007) presented power methods for “reversible” mixed models
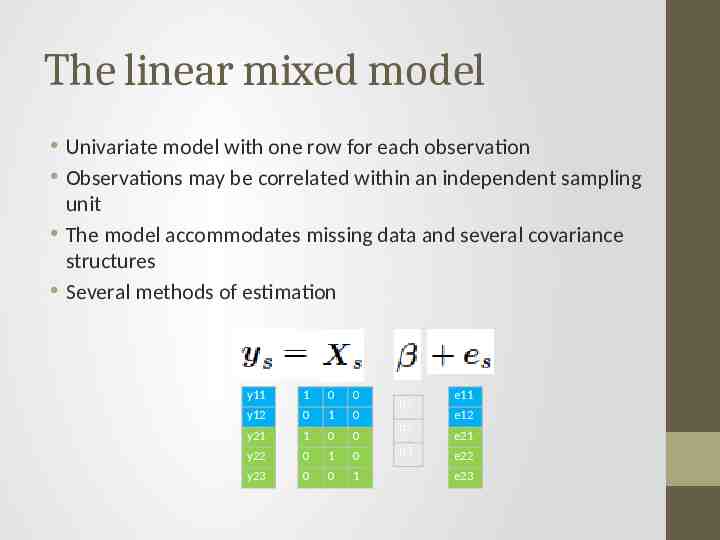
The linear mixed model Univariate model with one row for each observation Observations may be correlated within an independent sampling unit The model accommodates missing data and several covariance structures Several methods of estimation y11 1 0 0 y12 0 1 0 y21 1 0 0 y22 0 1 0 y23 0 0 1 μ1 μ2 μ3 e11 e12 e21 e22 e23
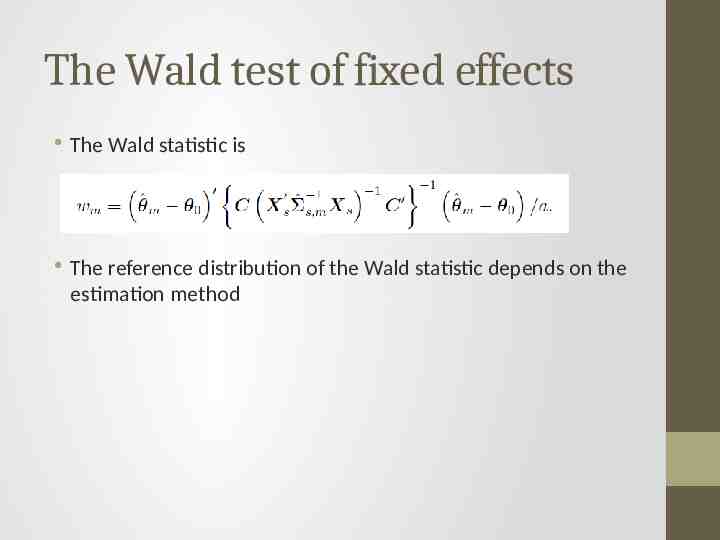
The Wald test of fixed effects The Wald statistic is The reference distribution of the Wald statistic depends on the estimation method
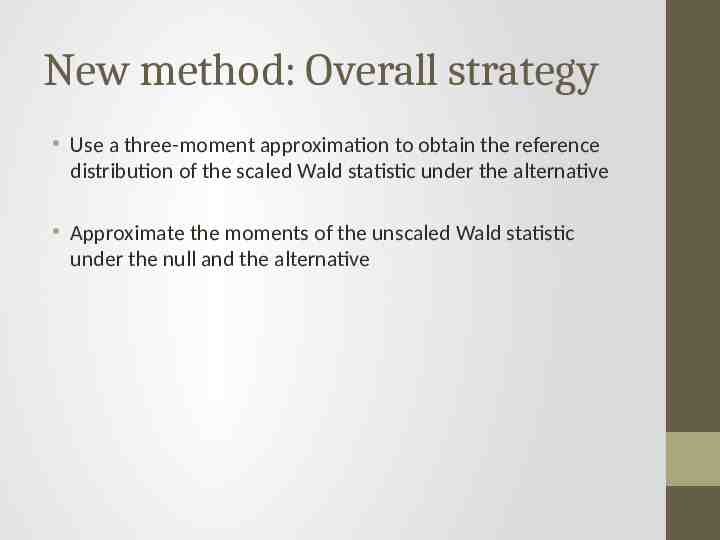
New method: Overall strategy Use a three-moment approximation to obtain the reference distribution of the scaled Wald statistic under the alternative Approximate the moments of the unscaled Wald statistic under the null and the alternative
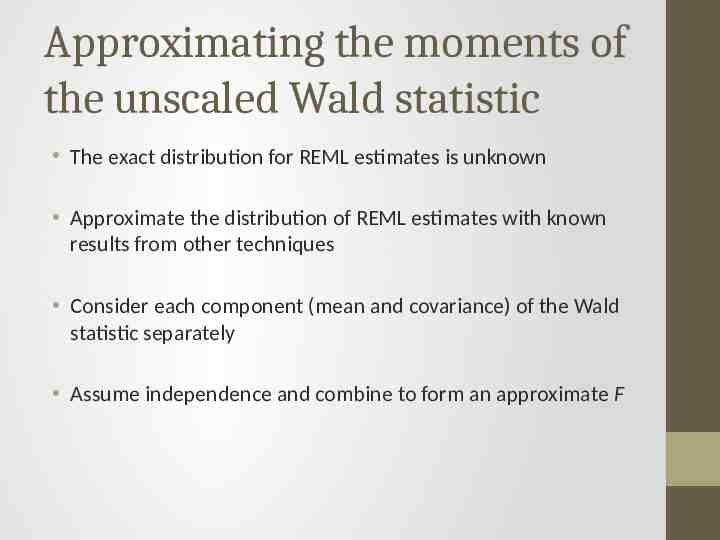
Approximating the moments of the unscaled Wald statistic The exact distribution for REML estimates is unknown Approximate the distribution of REML estimates with known results from other techniques Consider each component (mean and covariance) of the Wald statistic separately Assume independence and combine to form an approximate F
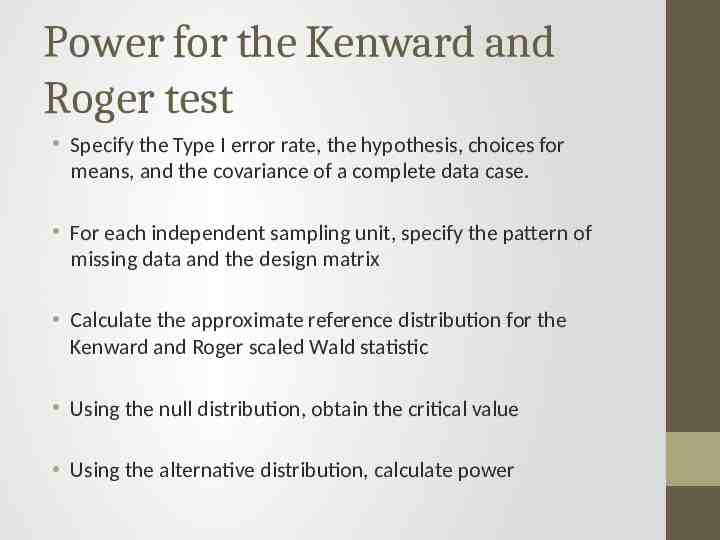
Power for the Kenward and Roger test Specify the Type I error rate, the hypothesis, choices for means, and the covariance of a complete data case. For each independent sampling unit, specify the pattern of missing data and the design matrix Calculate the approximate reference distribution for the Kenward and Roger scaled Wald statistic Using the null distribution, obtain the critical value Using the alternative distribution, calculate power
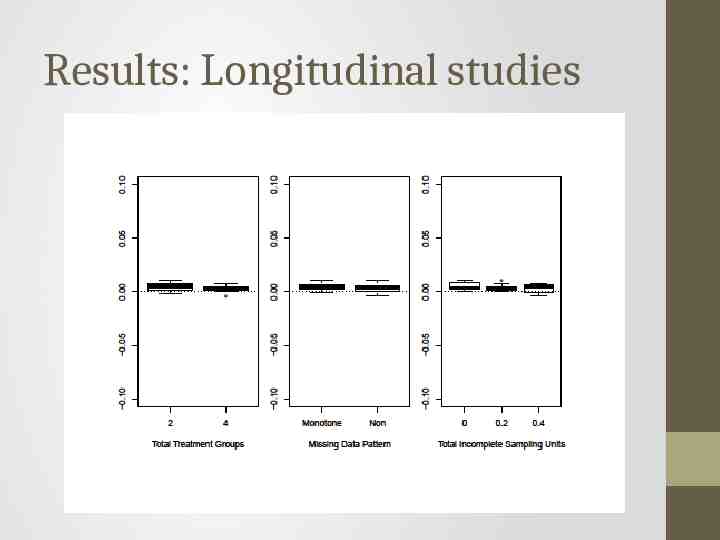
Results: Longitudinal studies
Outline Determining sample size and power for complex designs Calculating power with our free, web-based software Writing the grant Handling missing data Questions 93
Questions? 94