Sectoral Economic Linkages and the Tourism Satellite Account:
39 Slides606.00 KB
Sectoral Economic Linkages and the Tourism Satellite Account: The Canadian Experience Presented by: Scott Meis World Trade Organization, Geneva, Feb. 232-24, 2001
Outline Introduction- the Canadian TSA Rationale Key Concepts Key Economic Results Structural Findings and linkages Conclusions Canadian Tourism Commission
Introduction : CTC Created in 1995 & 2001 OBJECTIVES: Market Canada as a destination “BRAND Canada” Provide accurate and timely information to aid decision making Canadian Tourism Commission
Rationale : Information Gaps 1992/93 Inadequacy Of Data & Analysis Lack aggregate summary Lack view of industry Lack credibility Lack indicators of performance Incomparable with economy Incomparable with other Canadian Tourism Commission
Rationale - User Requirements Application Requirements (NTFTD, 1986) Advocacy, planning and public awareness; Marketing; Investment, operations and management; Manpower, education and training Canadian Tourism Commission
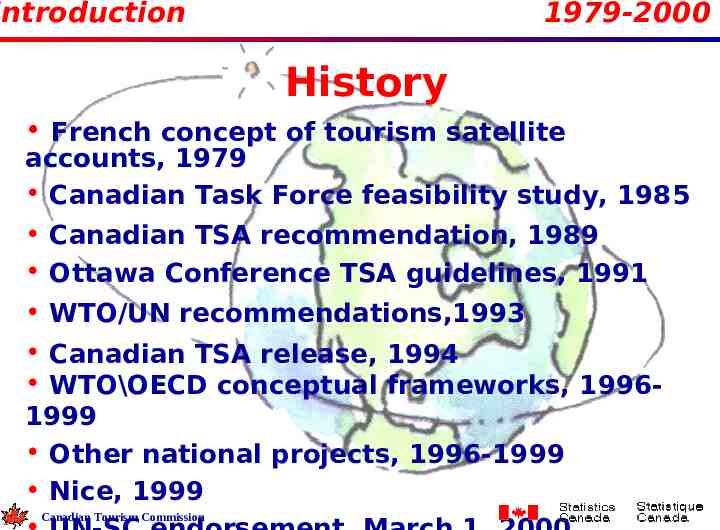
Introduction 1979-2000 History French concept of tourism satellite accounts, 1979 Canadian Task Force feasibility study, 1985 Canadian TSA recommendation, 1989 Ottawa Conference TSA guidelines, 1991 WTO/UN recommendations,1993 Canadian TSA release, 1994 WTO\OECD conceptual frameworks, 19961999 Other national projects, 1996-1999 Nice, 1999 Canadian Tourism Commission
ationale: A New Statistical Instrument Tourism Satellite Account Integrates/interrelates dispersed phenomena Separate linked extension of SNA Unit of analysis - monetary values Set of detailed statistics measuring structure and scope of tourism outputs, expenditures and employment. Tourism specific summary of observations Comparable with total economy Comparable to other industries Canadian Tourism Commission
Canadian TSA: extensions Current Extensions National Tourism Indicators Government revenue module Tourism Economic Impact Model Benchmark updates Canadian Tourism Commission
Key Concepts: Tourism Commodities Tourism Commodity A product or service produced mostly for tourism, eg., tours on steam trains. Non- tourism Commodity A product or service not specific to or characteristics of tourism, eg., clothing, suntan lotion. Canadian Tourism Commission
Key Concepts: Tourism Industries Tourism Industry Any industry that serves visitors directly and would cease to exist or whose level of activity would be substantially reduced wiithout tourism, eg., hotels. Canadian Tourism Commission
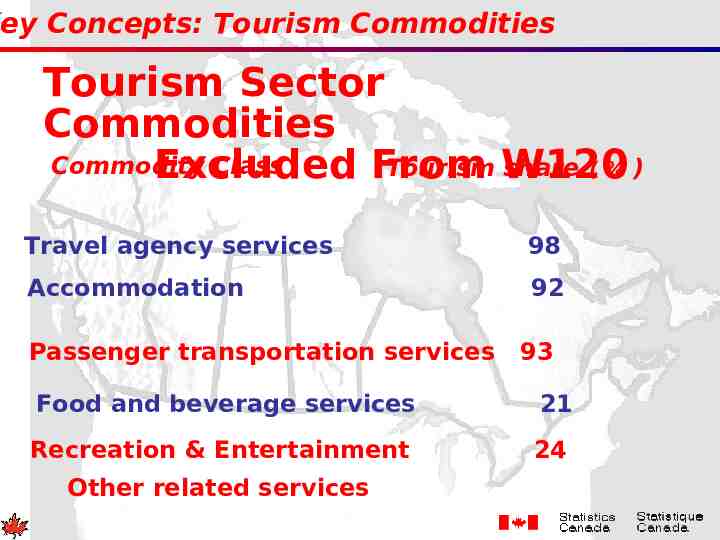
Key Concepts: Tourism Commodities Tourism Sector Commodities Commodity Class Tourism W120 share ( % ) Excluded From Travel agency services 98 Accommodation 92 Passenger transportation services 93 Food and beverage services 21 Recreation & Entertainment 24 Other related services
ey Concepts : Tourism Business Tourism Operator Tourism Operator/Business Any tourism enterprise or establishment within an empirically identified characteristic or specific tourism industry, eg., hotels. Canadian Tourism Commission
Key Concepts : Tourism GDP Tourism Gross Domestic Product ( TGDP ) Tourism specific GDP Total value added by tourism and non-tourism industries generated by provision of goods and services to visitors Total value at purchaser’s price minus costs and taxes Canadian Tourism Commission
Key Concepts : Employment Definition of Employment Persons employed, whether fulltime or part-time. Count only employment due to tourism demand Includes both tourism and nontourism industries Canadian Tourism Commission
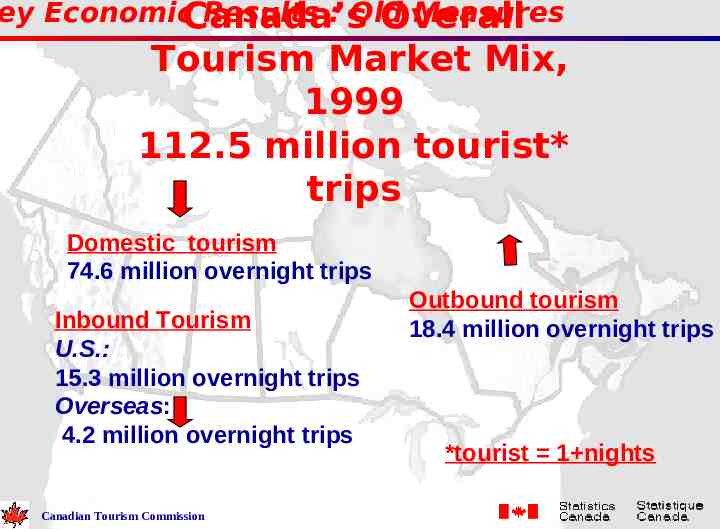
ey EconomicCanada’s Results : Old Measures Overall Tourism Market Mix, 1999 112.5 million tourist* trips Domestic tourism 74.6 million overnight trips Inbound Tourism U.S.: 15.3 million overnight trips Overseas: 4.2 million overnight trips Canadian Tourism Commission Outbound tourism 18.4 million overnight trips *tourist 1 nights
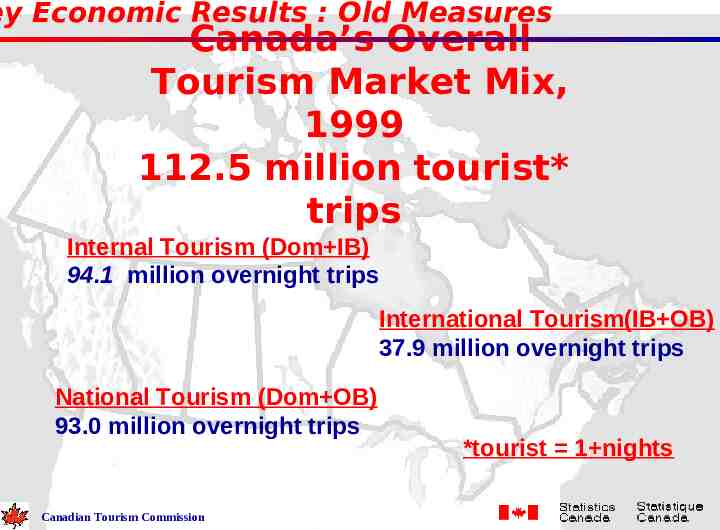
ey Economic Results : Old Measures Canada’s Overall Tourism Market Mix, 1999 112.5 million tourist* trips Internal Tourism (Dom IB) 94.1 million overnight trips International Tourism(IB OB) 37.9 million overnight trips National Tourism (Dom OB) 93.0 million overnight trips Canadian Tourism Commission *tourist 1 nights
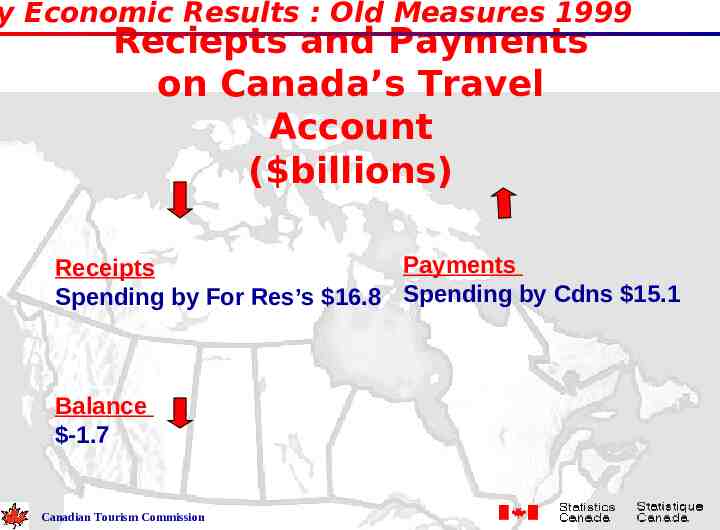
y Economic Results : Old Measures 1999 Reciepts and Payments on Canada’s Travel Account ( billions) Payments Receipts Spending by For Res’s 16.8 Spending by Cdns 15.1 Balance -1.7 Canadian Tourism Commission
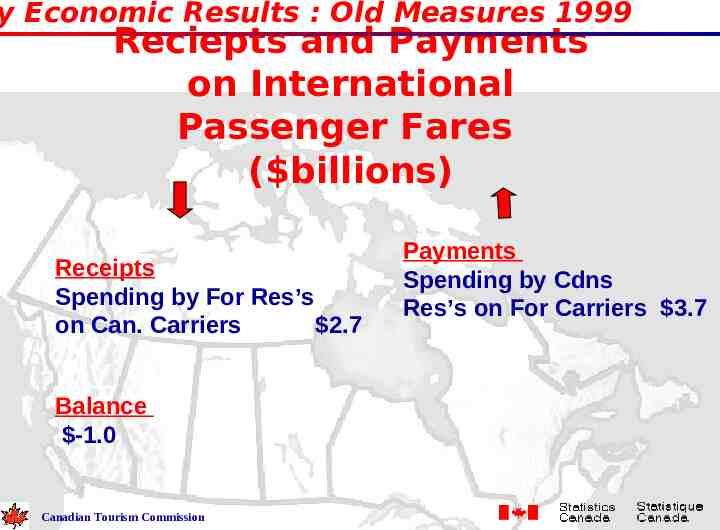
y Economic Results : Old Measures 1999 Reciepts and Payments on International Passenger Fares ( billions) Receipts Spending by For Res’s on Can. Carriers 2.7 Balance -1.0 Canadian Tourism Commission Payments Spending by Cdns Res’s on For Carriers 3.7
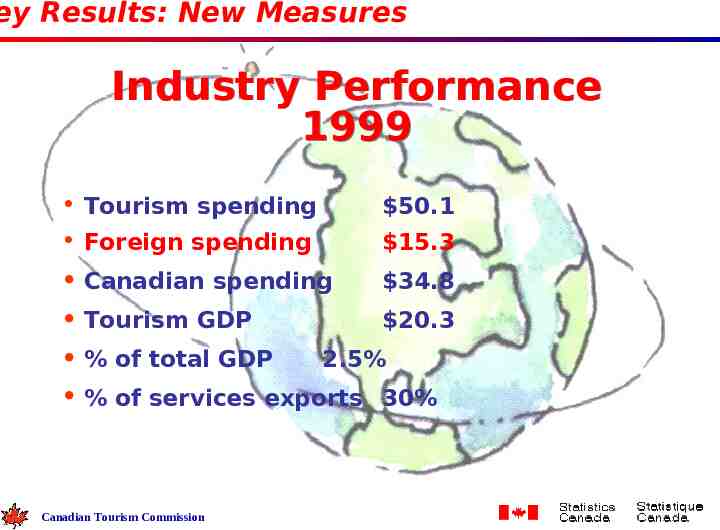
ey Results: New Measures Industry Performance 1999 Tourism spending Foreign spending 50.1 15.3 34.8 Canadian spending 20.3 Tourism GDP 2.5% % of total GDP % of services exports 30% Canadian Tourism Commission
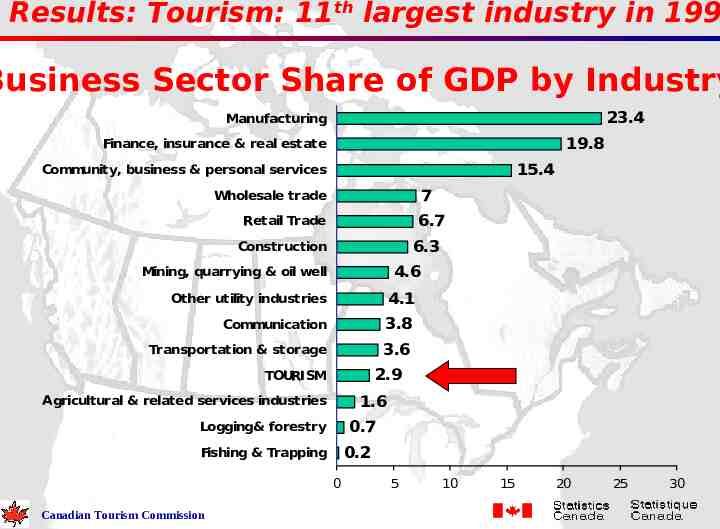
Results: Tourism: 11th largest industry in 199 Business Sector Share of GDP by Industry 23.4 Manufacturing 19.8 Finance, insurance & real estate 15.4 Community, business & personal services 7 Wholesale trade 6.7 Retail Trade 6.3 Construction 4.6 Mining, quarrying & oil well Other utility industries 4.1 Communication 3.8 Transportation & storage 3.6 2.9 TOURISM 1.6 Agricultural & related services industries 0.7 Logging& forestry 0.2 Fishing & Trapping 0 Canadian Tourism Commission 5 10 15 20 25 30
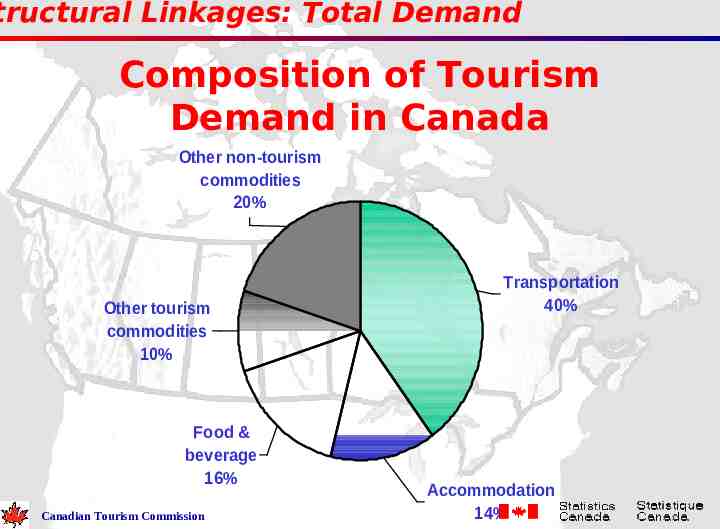
tructural Linkages: Total Demand Composition of Tourism Demand in Canada Other non-tourism commodities 20% Other tourism commodities 10% Food & beverage 16% Canadian Tourism Commission Transportation 40% Accommodation 14%
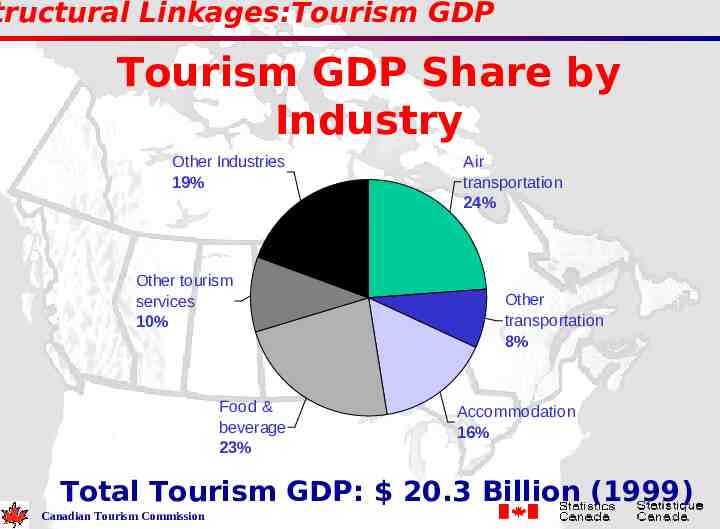
tructural Linkages:Tourism GDP Tourism GDP Share by Industry Other Industries 19% Other tourism services 10% Food & beverage 23% Air transportation 24% Other transportation 8% Accommodation 16% Total Tourism GDP: 20.3 Billion (1999) Canadian Tourism Commission
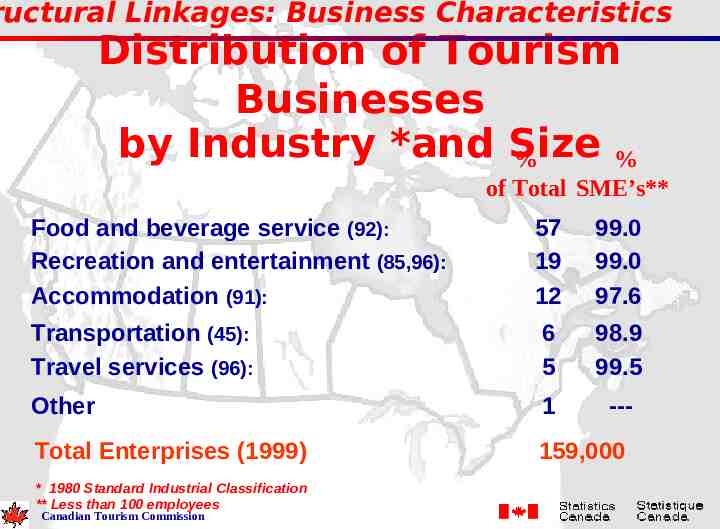
ructural Linkages: Business Characteristics Distribution of Tourism Businesses by Industry *and Size % % of Total SME’s** Food and beverage service (92): Recreation and entertainment (85,96): Accommodation (91): 57 19 12 99.0 99.0 97.6 Transportation (45): Travel services (96): 6 5 98.9 99.5 Other 1 --- Total Enterprises (1999) 159,000 * 1980 Standard Industrial Classification ** Less than 100 employees Canadian Tourism Commission
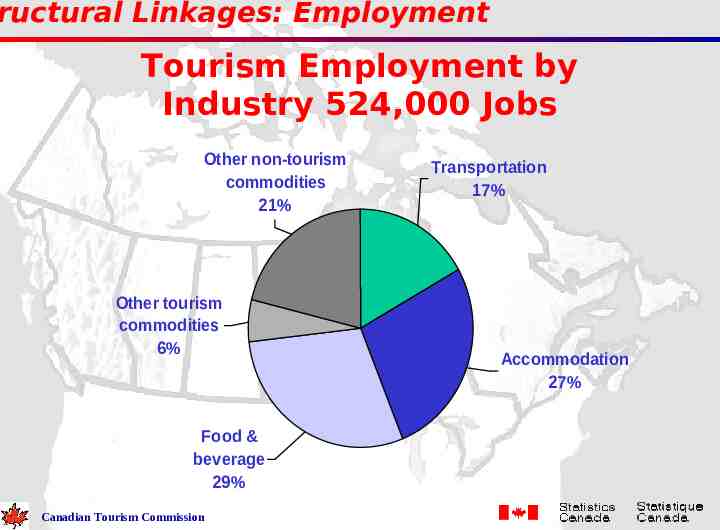
ructural Linkages: Employment Tourism Employment by Industry 524,000 Jobs Other non-tourism commodities 21% Other tourism commodities 6% Food & beverage 29% Canadian Tourism Commission Transportation 17% Accommodation 27%
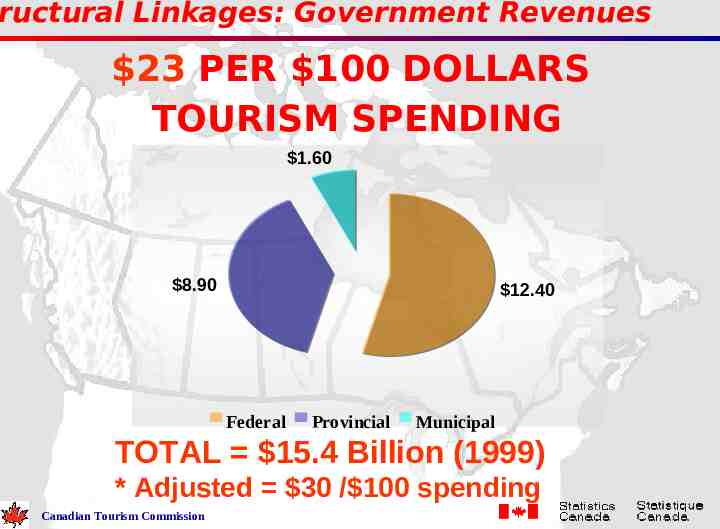
ructural Linkages: Government Revenues 23 PER 100 DOLLARS TOURISM SPENDING 1.60 8.90 12.40 Federal Provincial Municipal TOTAL 15.4 Billion (1999) * Adjusted 30 / 100 spending Canadian Tourism Commission
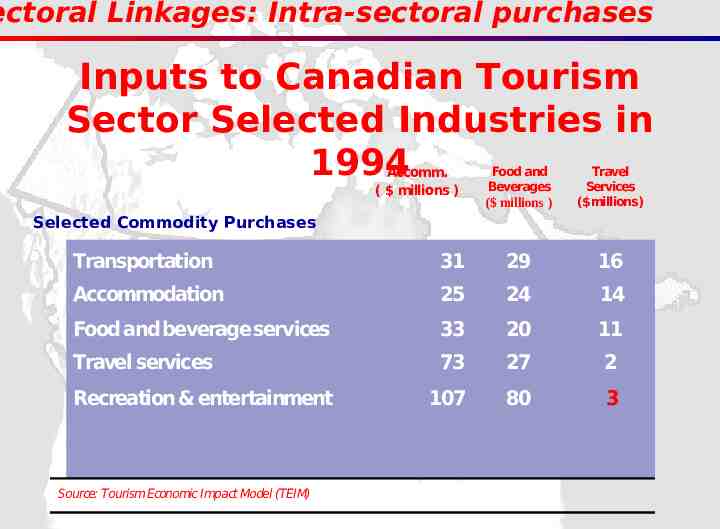
ectoral Linkages: Intra-sectoral purchases Inputs to Canadian Tourism Sector Selected Industries in 1994 Accomm. ( millions ) Food and Beverages ( millions ) Travel Services ( millions) Selected Commodity Purchases Transportation 31 29 16 Accommodation 25 24 14 Food and beverage services 33 20 11 Travel services 73 27 2 107 80 3 Recreation & entertainment Source: Tourism Economic Impact Model (TEIM)
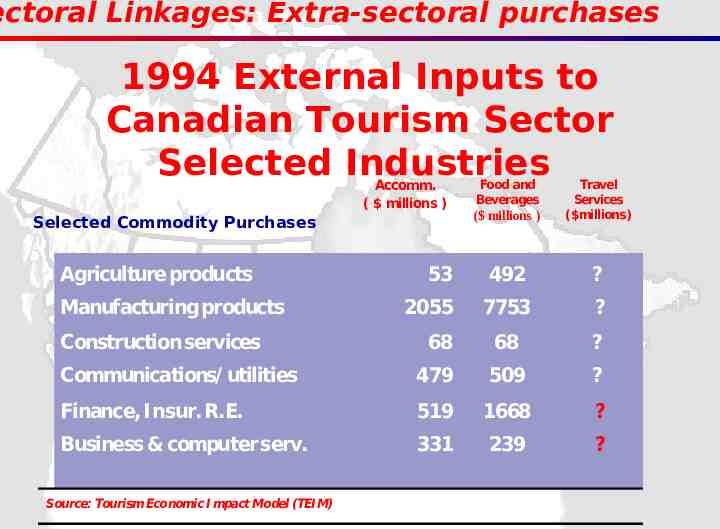
ectoral Linkages: Extra-sectoral purchases 1994 External Inputs to Canadian Tourism Sector Selected Industries Accomm. ( millions ) ( millions ) Travel Services ( millions) 53 492 ? 2055 7753 ? 68 68 ? Communications/ utilities 479 509 ? Finance, Insur. R.E. 519 1668 ? Business & computer serv. 331 239 ? Selected Commodity Purchases Agriculture products Manufacturing products Construction services Source: Tourism Economic I mpact Model (TEIM) Food and Beverages
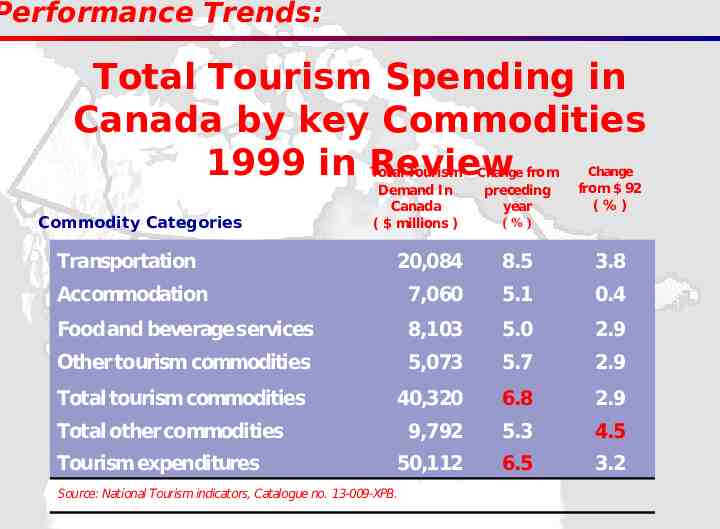
Performance Trends: Total Tourism Spending in Canada by key Commodities 1999 in Review Commodity Categories Total Tourism Demand In Canada ( millions ) Change from Change preceding year (% ) from 92 (%) Transportation 20,084 8.5 3.8 Accommodation 7,060 5.1 0.4 Food and beverage services 8,103 5.0 2.9 Other tourism commodities 5,073 5.7 2.9 Total tourism commodities 40,320 6.8 2.9 9,792 5.3 4.5 50,112 6.5 3.2 Total other commodities Tourism expenditures Source: National Tourism indicators, Catalogue no. 13-009-XPB.
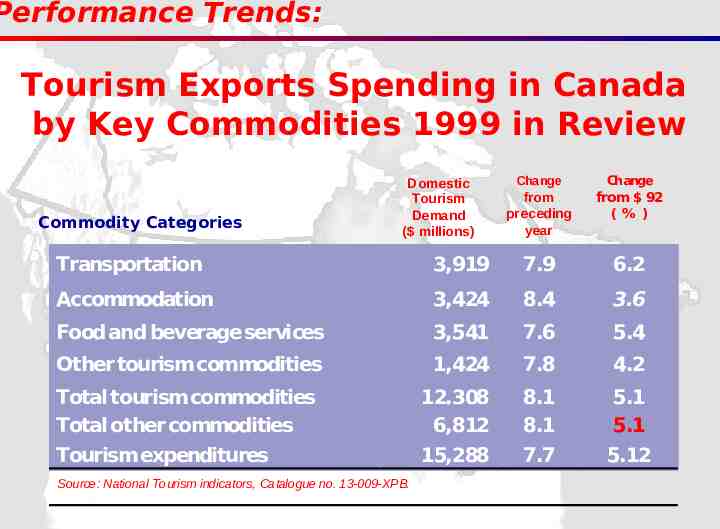
Performance Trends: Tourism Exports Spending in Canada by Key Commodities 1999 in Review Commodity Categories Domestic Tourism Demand ( millions) Change Change from preceding year from 92 (% ) Transportation 3,919 7.9 6.2 Accommodation 3,424 8.4 3.6 Food and beverage services 3,541 7.6 5.4 Other tourism commodities 1,424 7.8 4.2 Total tourism commodities Total other commodities 12,308 6,812 8.1 8.1 5.1 5.1 Tourism expenditures 15,288 7.7 5.12 Source: National Tourism indicators, Catalogue no. 13-009-XPB.
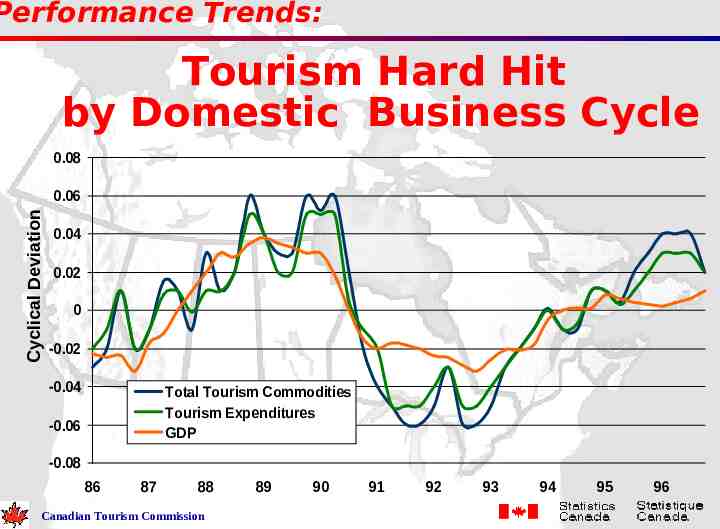
Performance Trends: Tourism Hard Hit by Domestic Business Cycle 0.08 Cyclical Deviation 0.06 0.04 0.02 0 -0.02 -0.04 Total Tourism Commodities Tourism Expenditures GDP -0.06 -0.08 86 87 88 Canadian Tourism Commission 89 90 91 92 93 94 95 96
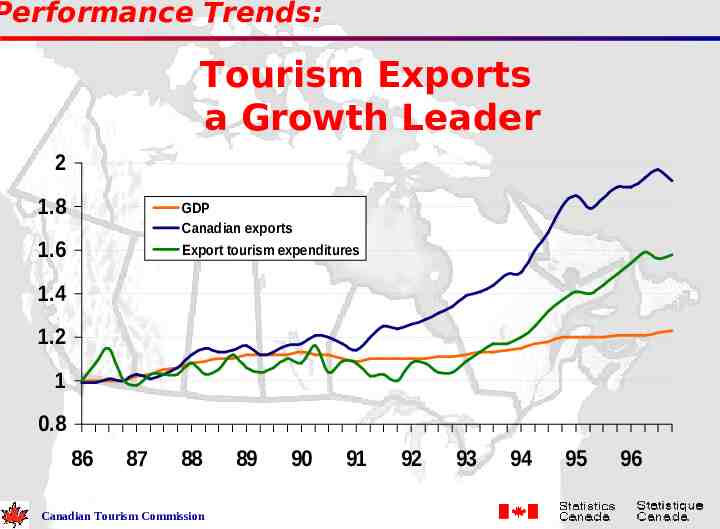
Performance Trends: Tourism Exports a Growth Leader 2 1.8 GDP Canadian exports Export tourism expenditures 1.6 1.4 1.2 1 0.8 86 87 88 Canadian Tourism Commission 89 90 91 92 93 94 95 96
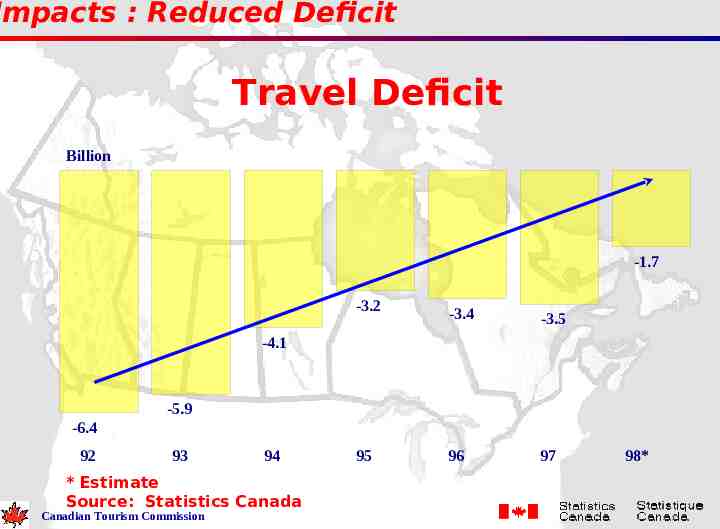
Impacts : Reduced Deficit Travel Deficit Billion -1.7 -3.2 -3.4 -3.5 95 96 97 -4.1 -5.9 -6.4 92 93 94 * Estimate Source: Statistics Canada Canadian Tourism Commission 98*
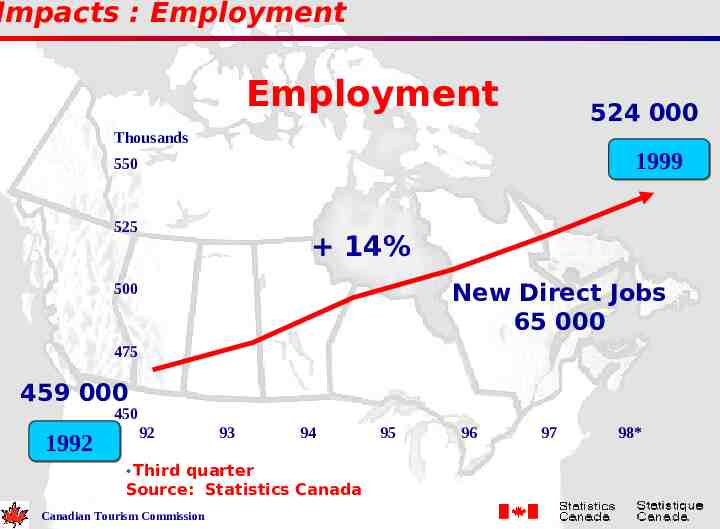
Impacts : Employment Employment 524 000 Thousands 1999 550 525 14% New Direct Jobs 65 000 500 475 459 000 450 1992 92 * Third 93 94 quarter Source: Statistics Canada Canadian Tourism Commission 95 96 97 98*
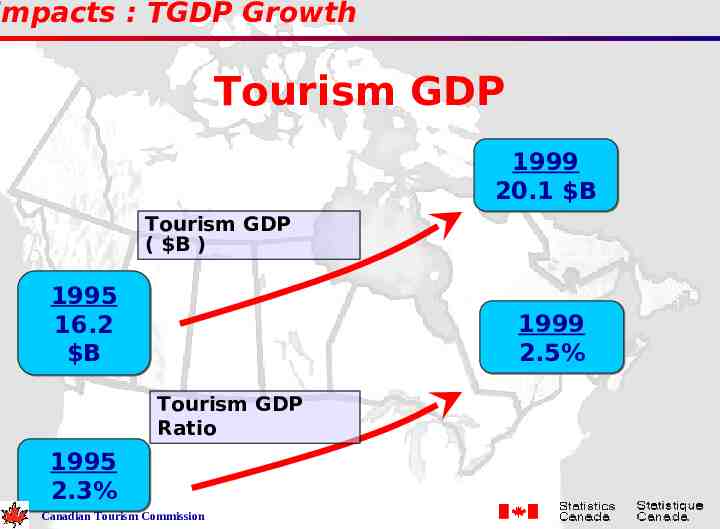
Impacts : TGDP Growth Tourism GDP 1999 20.1 B Tourism GDP ( B ) 1995 16.2 B 1999 2.5% Tourism GDP Ratio 1995 2.3% Canadian Tourism Commission
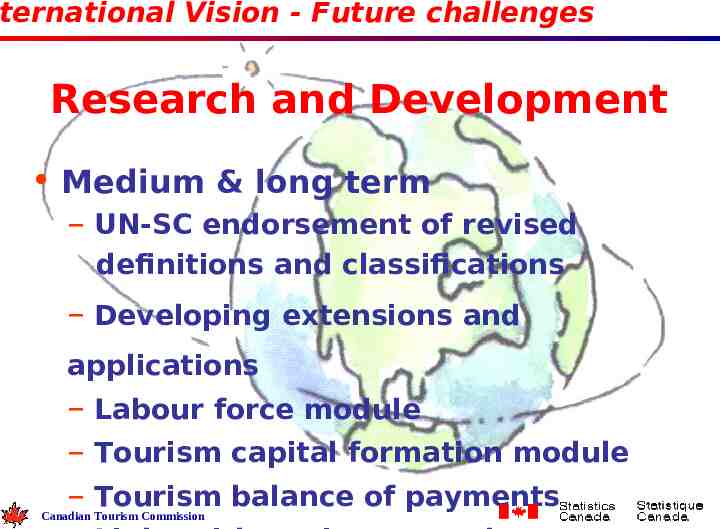
ternational Vision - Future challenges Research and Development Medium & long term – UN-SC endorsement of revised definitions and classifications – Developing extensions and applications – Labour force module – Tourism capital formation module – Tourism balance of payments Canadian Tourism Commission
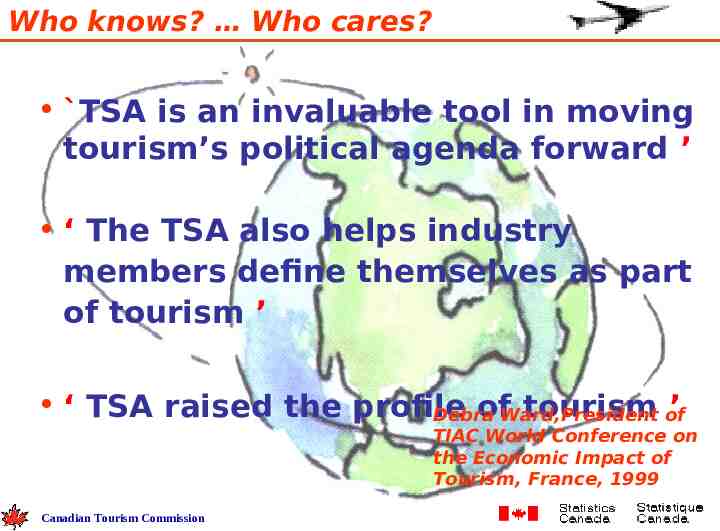
Who knows? Who cares? TSA is an invaluable tool in moving tourism’s political agenda forward ’ ‘ The TSA also helps industry members define themselves as part of tourism ’ ‘ TSA raised the profile ofWard,President tourism of ’ Debra TIAC World Conference on the Economic Impact of Tourism, France, 1999 Canadian Tourism Commission
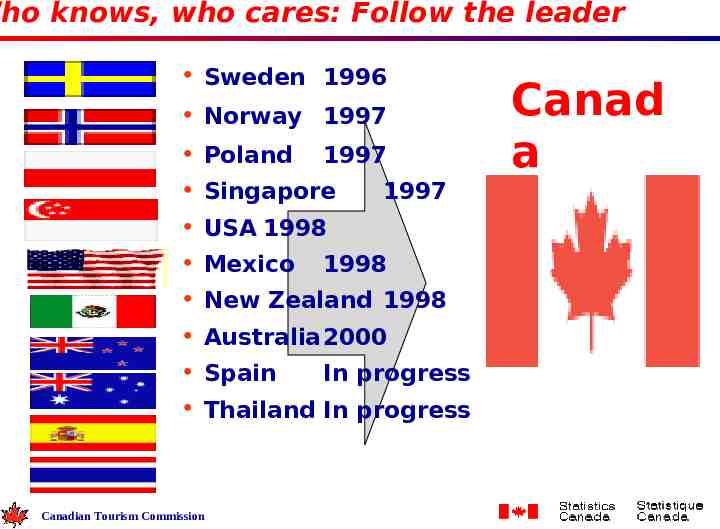
Who knows, who cares: Follow the leader Sweden 1996 Norway 1997 Poland 1997 Singapore 1997 USA 1998 Mexico 1998 New Zealand 1998 Australia2000 Spain In progress Thailand In progress Canadian Tourism Commission Canad a 1994
Conclusions Conclusions Met user requirements Defined tourism products/services Defined tourism industries Credible measures Comparability with total economy Comparability with other industries Potential foundation of trade negotiations Potential tool for monitoing Canadian Tourism Commission
Thank you for your attention WEB: canadatourism.com CTX: http://www.ctc-ctx.com E-Mail: [email protected] Canadian Tourism Commission