performanc e tuning hp-ux Java 어플리케이션의 performance tuning 2003.1.21 강사


45 Slides501.00 KB
performanc e tuning hp-ux Java 어플리케이션의 performance tuning 2003.1.21 강사 : 이욱준 차장 (MCSC) 1
performanc e tuning 목차 Java performance tuning 이 필요한 이유는 ? 방법론 성능 문제의 원인 문제 분석을 위한 tool 결론 참조 2
performanc e tuning Java performance tuning 이 필요한 이유는 ? 어플리케이션 작성의 용의 – multi-thread 어플리케이션 Java Socket API 사용 시 많은 thread 필요 – 네트워크 어플리케이션 – 뚜렷한 메모리 관리가 없음 결과 – 성능 저하 – 자원의 비효율적인 사용 – 공유 자원의 contention 3
performanc e tuning performance tuning 의 규칙 성능은 많은 이슈와 연관이 있다 . – 어느것인지 미리 알기 어렵다 . – 많은 연관 관계로 예측하기 어렵다 . tuning 작업은 trade-off 이다 . – 모든 요구 사항을 이해한다 . 측정은 시스템 상태를 변화 시킬 수 있다 . – Tool 이 어플리케이션에서 사용하는 리소스를 차지함 측정을 위해서는 많은 tool 이 필요 – 데이터를 상호 검증할 수 있다 . – tool 마다 장점이 있다 . 더 많은 정보 4
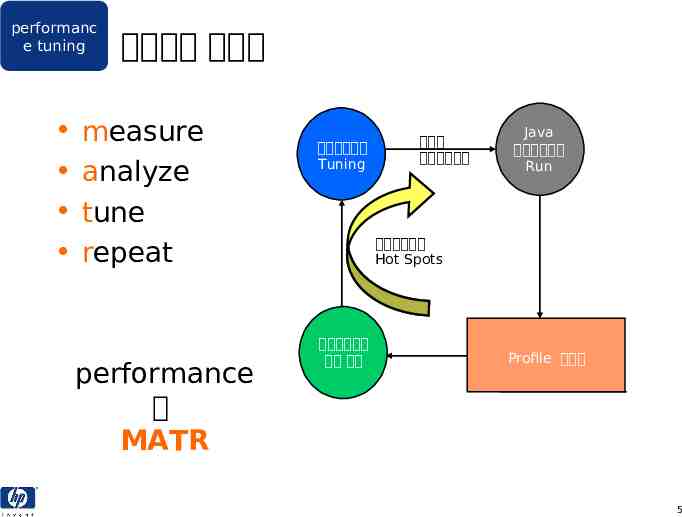
performanc e tuning 프로세스 방법론 measure analyze tune repeat performance 는 MATR 어플리케이션 Tuning 수정된 어플리케이션 Java 어플리케이션 Run 어플리케이션 Hot Spots 어플리케이션 성능 분석 Profile 데이터 5
performanc e tuning 시스템 구성 커널 파라메타 최신 JVM 버젼 OS 패치 빈번한 garbage collection 성능 문제의 원인 리소스 contention JVM 옵션 micro-benchmark 와 HotSpot runtime compiler expensive method 의 과도한 사용 short-lived 오브젝트의 과도한 사용 thread 의 과도한 사용 memory leak 어플리케이션 관련 이슈 6
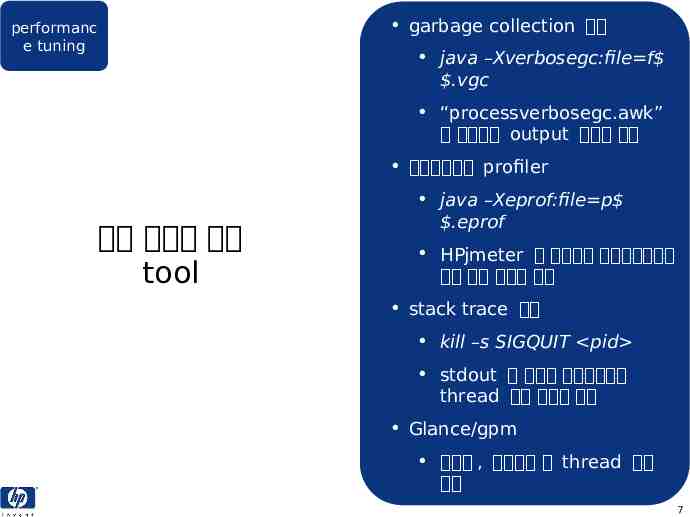
garbage collection 분석 performanc e tuning java –Xverbosegc:file f .vgc “processverbosegc.awk” 를 사용하여 output 데이터 확인 어플리케이션 profiler 문제 발견을 위한 tool java –Xeprof:file p .eprof HPjmeter 를 사용하여 어플리케이션의 내부 동작 현황을 분석 stack trace 분석 kill –s SIGQUIT pid stdout 에 나오는 어플리케이션 thread 상태 정보를 점검 Glance/gpm 시스템 , 프로세스 및 thread 상태 점검 7
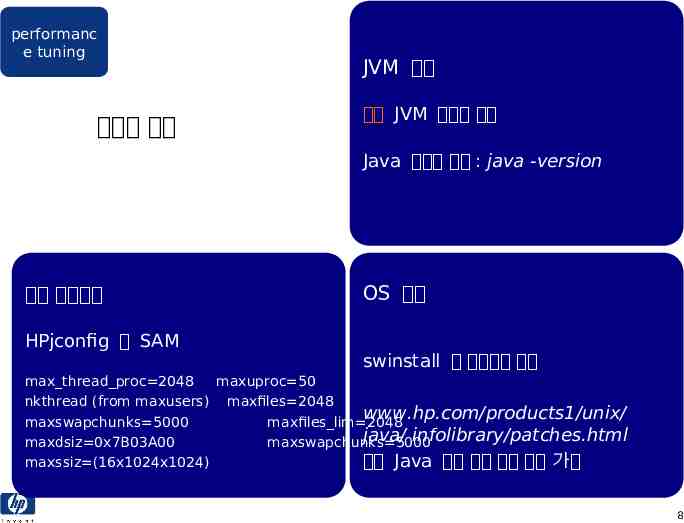
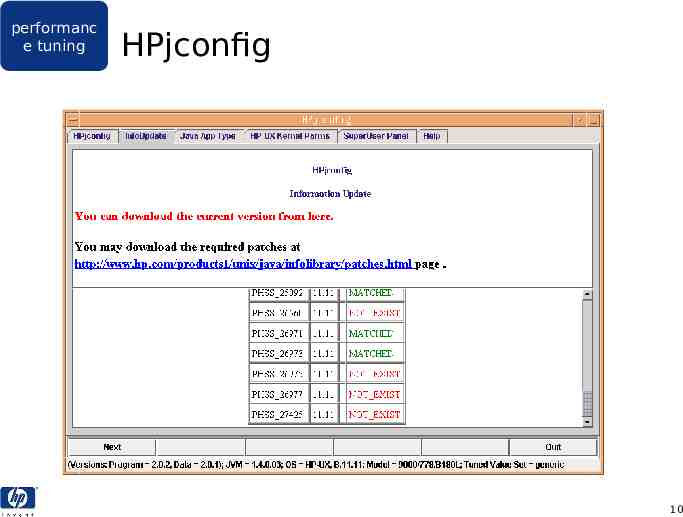
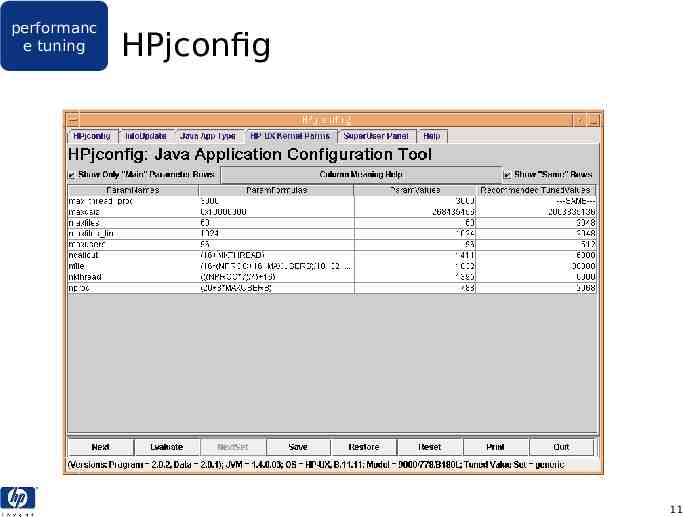
performanc e tuning 시스템 구성 JVM 버젼 최신 JVM 버젼의 사용 Java 코맨드 옵션 : java -version 커널 파라메타 HPjconfig 및 SAM OS 패치 swinstall 을 사용하여 설치 max thread proc 2048 maxuproc 50 nkthread (from maxusers) maxfiles 2048 www.hp.com/products1/unix/ maxswapchunks 5000 maxfiles lim 2048 java/ infolibrary/patches.html maxdsiz 0x7B03A00 maxswapchunks 5000 maxssiz (16x1024x1024) 에서 Java 관련 최신 패치 목록 가능 8
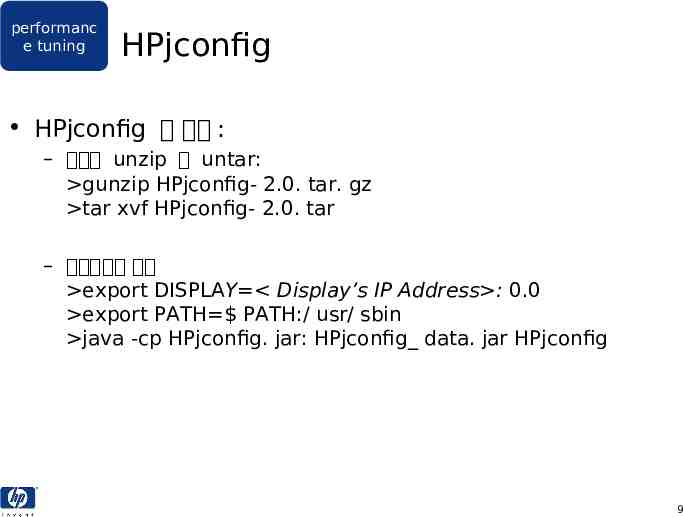
performanc e tuning HPjconfig HPjconfig 의 기동 : – 파일의 unzip 및 untar: gunzip HPjconfig- 2.0. tar. gz tar xvf HPjconfig- 2.0. tar – 프로그램의 기동 export DISPLAY Display’s IP Address : 0.0 export PATH PATH:/ usr/ sbin java -cp HPjconfig. jar: HPjconfig data. jar HPjconfig 9
performanc e tuning HPjconfig 10
performanc e tuning HPjconfig 11
performanc e tuning 현상 : – 어플리케이션의 실행중 pause 발생 ( 다음 그림 참조 ) tool: 빈번한 garbage collection – System.gc() 함수를 호출하지 않는 다. – java -verbosegc 또는 – Xverbosegc – heap memory 의 arena 분석 및 어떻게 사용되는지 분석 – 가능하면 full GC 를 하지 않도록 한 다. 변경 : – JVM 옵션을 사용한 heap 크기 조정 : java -Xms -Xmx –Xmn – heap 크기를 증가시키면 collection 빈도가 줄어들 수도 있다 . – heap 크기를 두배로 하면 collection 시간도 두배로 증가할 수 있다 . 12
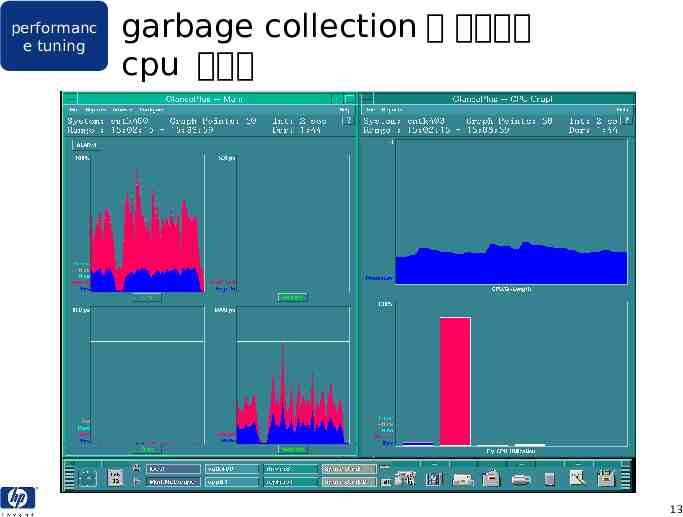
performanc e tuning garbage collection 에 사용되는 cpu 사용량 13
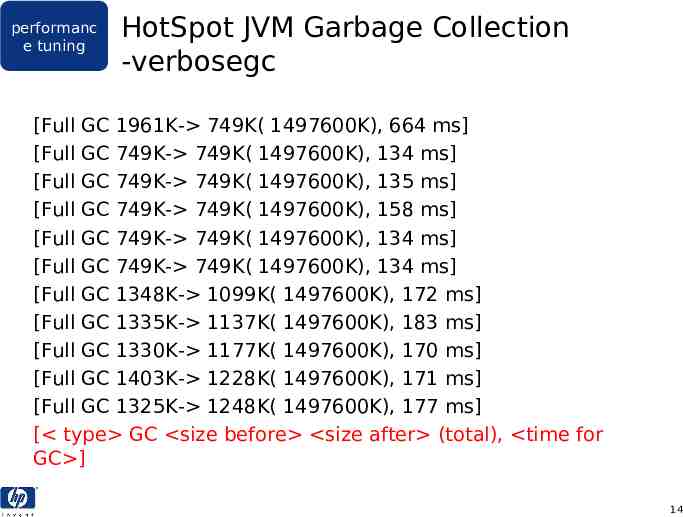
performanc e tuning HotSpot JVM Garbage Collection -verbosegc [Full GC 1961K- 749K( 1497600K), 664 ms] [Full GC 749K- 749K( 1497600K), 134 ms] [Full GC 749K- 749K( 1497600K), 135 ms] [Full GC 749K- 749K( 1497600K), 158 ms] [Full GC 749K- 749K( 1497600K), 134 ms] [Full GC 749K- 749K( 1497600K), 134 ms] [Full GC 1348K- 1099K( 1497600K), 172 ms] [Full GC 1335K- 1137K( 1497600K), 183 ms] [Full GC 1330K- 1177K( 1497600K), 170 ms] [Full GC 1403K- 1228K( 1497600K), 171 ms] [Full GC 1325K- 1248K( 1497600K), 177 ms] [ type GC size before size after (total), time for GC ] 14
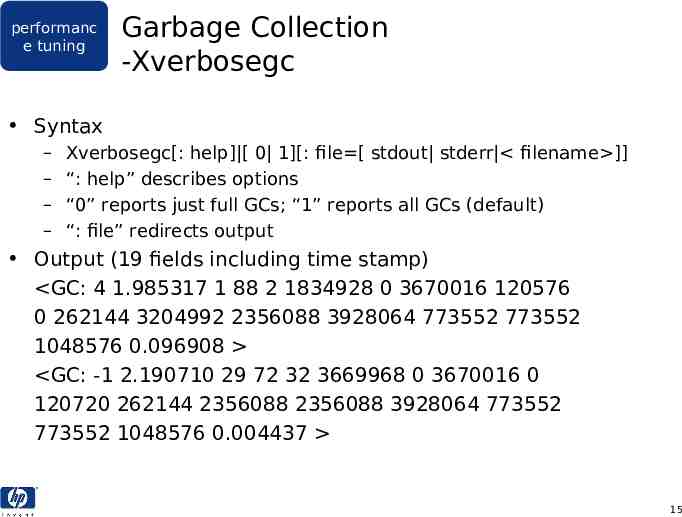
performanc e tuning Garbage Collection -Xverbosegc Syntax – – – – Xverbosegc[: help] [ 0 1][: file [ stdout stderr filename ]] “: help” describes options “0” reports just full GCs; “1” reports all GCs (default) “: file” redirects output Output (19 fields including time stamp) GC: 4 1.985317 1 88 2 1834928 0 3670016 120576 0 262144 3204992 2356088 3928064 773552 773552 1048576 0.096908 GC: -1 2.190710 29 72 32 3669968 0 3670016 0 120720 262144 2356088 2356088 3928064 773552 773552 1048576 0.004437 15
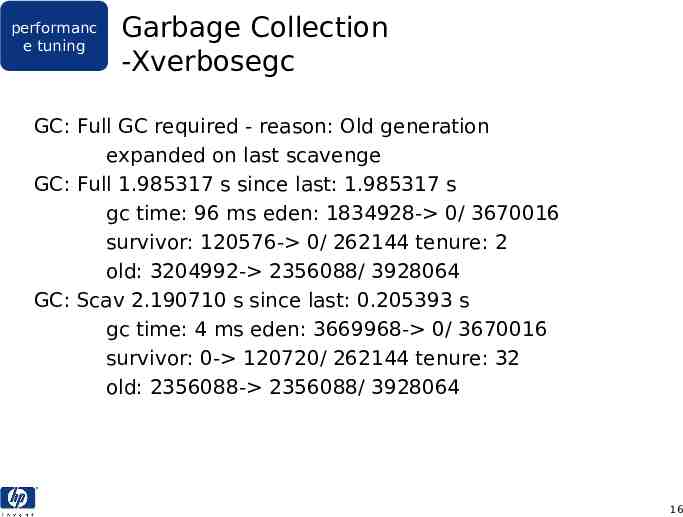
performanc e tuning Garbage Collection -Xverbosegc GC: Full GC required - reason: Old generation expanded on last scavenge GC: Full 1.985317 s since last: 1.985317 s gc time: 96 ms eden: 1834928- 0/ 3670016 survivor: 120576- 0/ 262144 tenure: 2 old: 3204992- 2356088/ 3928064 GC: Scav 2.190710 s since last: 0.205393 s gc time: 4 ms eden: 3669968- 0/ 3670016 survivor: 0- 120720/ 262144 tenure: 32 old: 2356088- 2356088/ 3928064 16
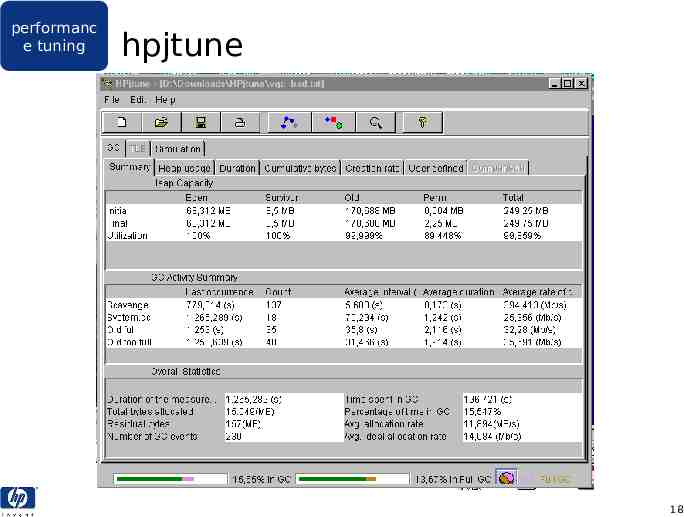
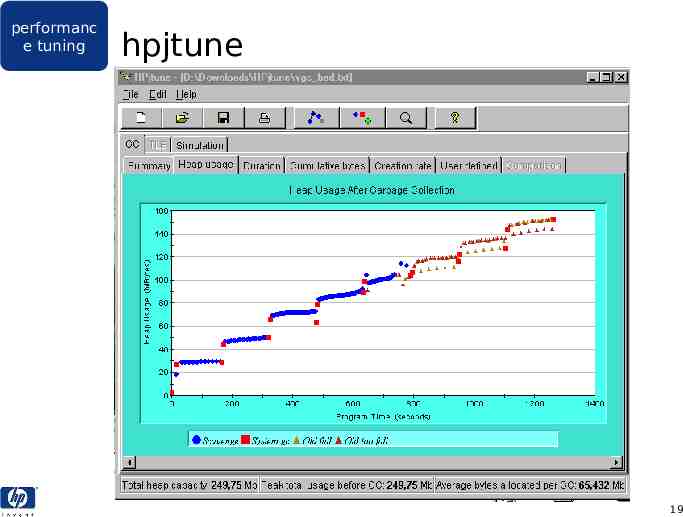
performanc e tuning hpjtune 기능 – 결과 값 및 그래픽 화면을 통해 heap 및 garbage collection 상태을 분석하고 최적화 한다 . – thread 의 메모리 할당 패턴을 보여준다 . 이점 – 가장 일반적인 java 어플리케이션 성능 문제의 진단 및 해결의 단순화 17
performanc e tuning hpjtune 18
performanc e tuning hpjtune 19
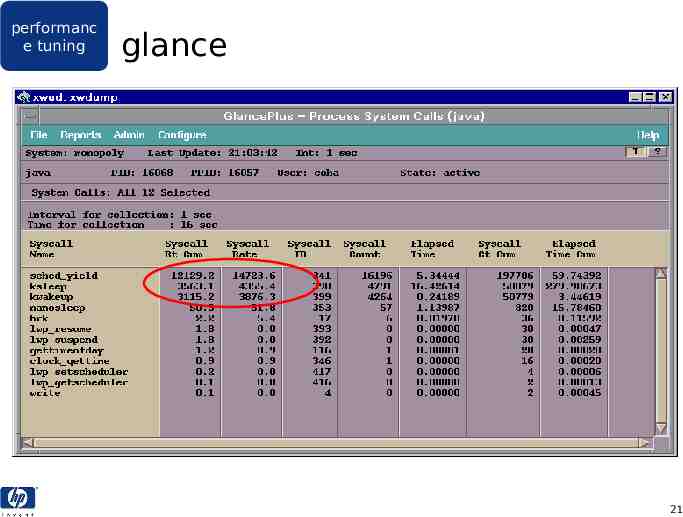
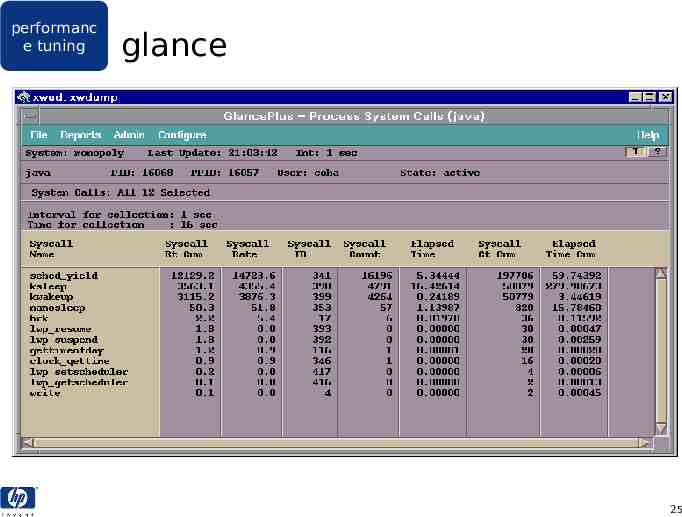
performanc e tuning 현상 : – 어플리케이션 hang – performance 가 매우 느림 tool: – Glance/gpm 의 thread 화면 및 system calls, ksleep(), sched yield(), kwakeup() – HPjmeter – kill -s SIQUIT pid 을 사용하여 모든 thread 상태를 stdout 으로 덤프 리소스 contention 변경 : – 어플리케이션에서 contention 이 발생하는 리소스를 thread-local 로 한다 . – 어플리케이션에서 critical 부분의 감소 (e.g. 동기화 블럭 안에서의 I/O 제거 ) – renice –20 pid 도 도움이 될 수 있다 . 20
performanc e tuning glance 21
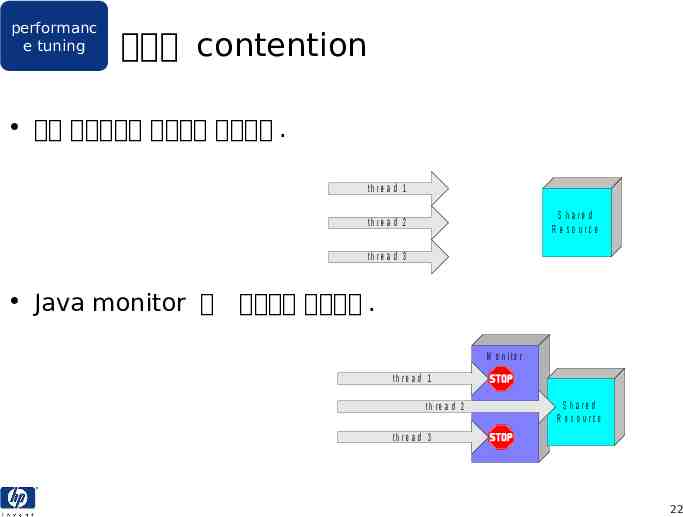
performanc e tuning 리소스 contention 공유 자원으로의 억세스를 제어한다 . th re a d 1 S h a re d R e s o u rc e th re a d 2 th re a d 3 Java monitor 가 억세스를 제어한다 . M o n ito r th re a d 1 th re a d 2 S h a re d R e s o u rc e th re a d 3 22
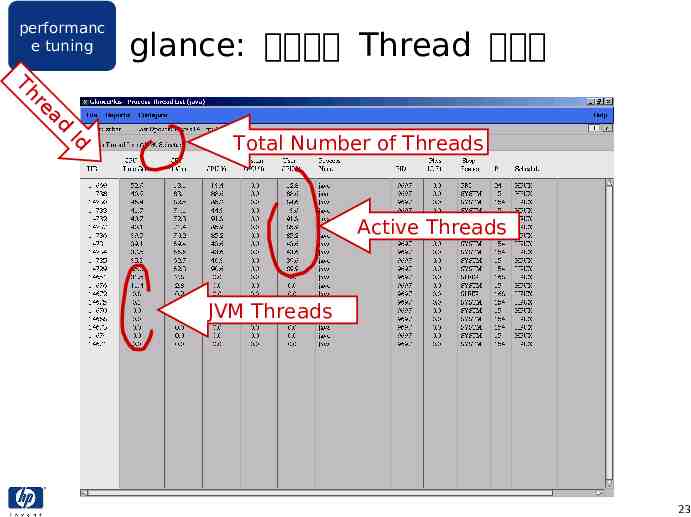
performanc e tuning Th r ea d Id glance: 프로세스 Thread 리스트 Total Number of Threads Active Threads JVM Threads 23
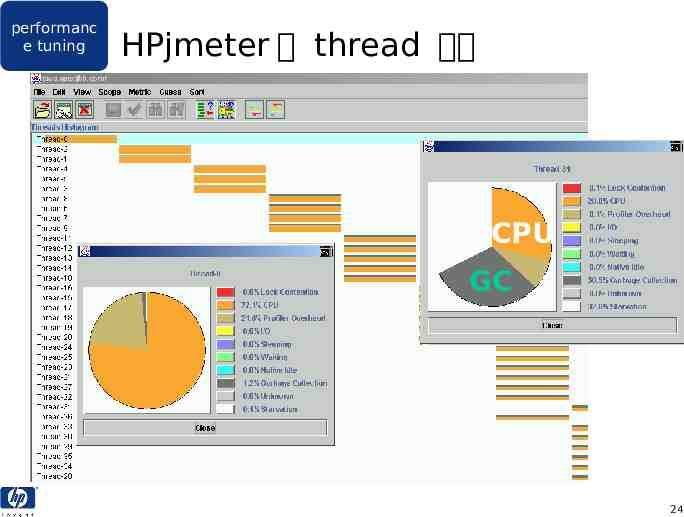
performanc e tuning HPjmeter 의 thread 분석 CPU GC 24
performanc e tuning glance 25
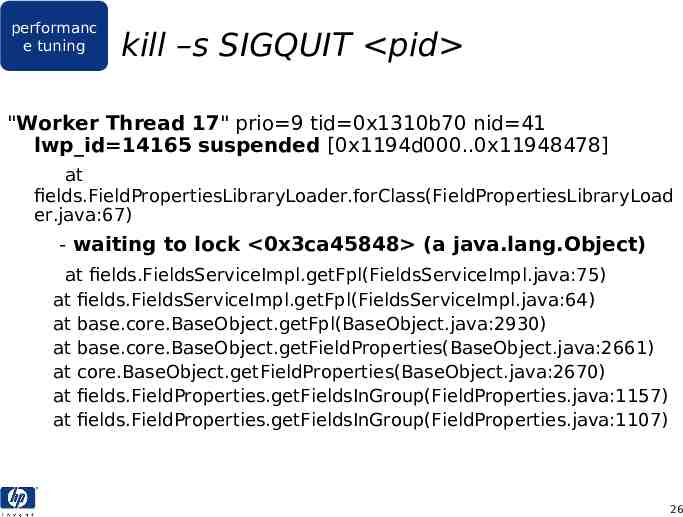
performanc e tuning kill –s SIGQUIT pid "Worker Thread 17" prio 9 tid 0x1310b70 nid 41 lwp id 14165 suspended [0x1194d000.0x11948478] at fields.FieldPropertiesLibraryLoader.forClass(FieldPropertiesLibraryLoad er.java:67) - waiting to lock 0x3ca45848 (a java.lang.Object) at fields.FieldsServiceImpl.getFpl(FieldsServiceImpl.java:75) at fields.FieldsServiceImpl.getFpl(FieldsServiceImpl.java:64) at base.core.BaseObject.getFpl(BaseObject.java:2930) at base.core.BaseObject.getFieldProperties(BaseObject.java:2661) at core.BaseObject.getFieldProperties(BaseObject.java:2670) at fields.FieldProperties.getFieldsInGroup(FieldProperties.java:1157) at fields.FieldProperties.getFieldsInGroup(FieldProperties.java:1107) 26
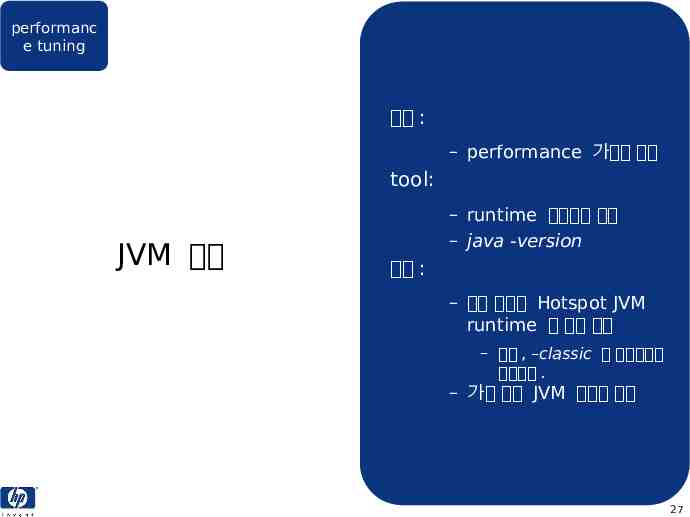
performanc e tuning 현상 : – performance 가매우 느림 tool: JVM 옵션 – runtime 스크립트 점검 – java -version 변경 : – 항시 디폴트 Hotspot JVM runtime 의 사용 권고 – 만약 , –classic 을 사용하다면 제거한다 . – 가장 최신 JVM 버젼의 사욯 27
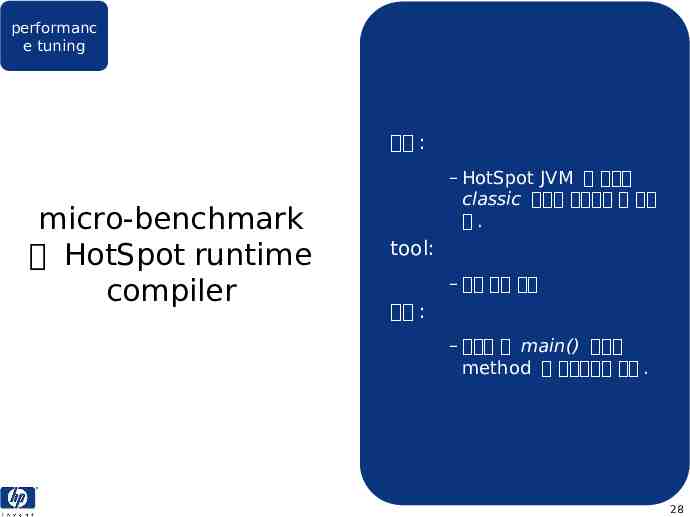
performanc e tuning 현상 : micro-benchmark 와 HotSpot runtime compiler – HotSpot JVM 을 사용시 classic 모드일 경우보다 더 느리 다. tool: – 소스 코드 점검 변경 : – 하나로 된 main() 블럭을 method 를 호출하도록 한다 . 28
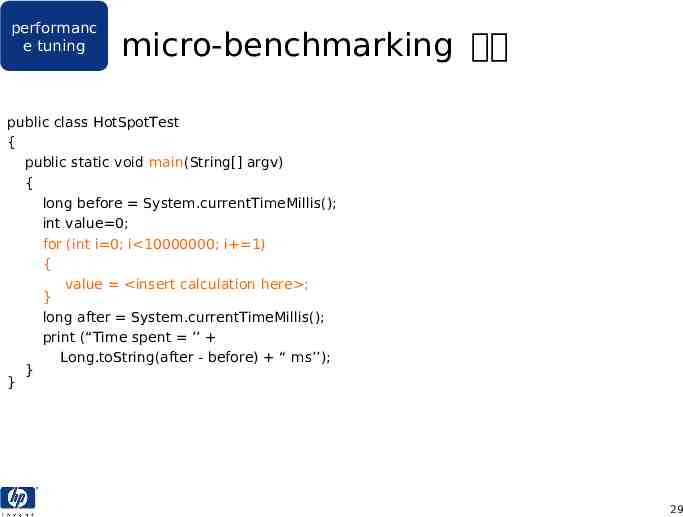
performanc e tuning micro-benchmarking 예제 public class HotSpotTest { public static void main(String[] argv) { long before System.currentTimeMillis(); int value 0; for (int i 0; i 10000000; i 1) { value insert calculation here ; } long after System.currentTimeMillis(); print (“Time spent ’’ Long.toString(after - before) “ ms’’); } } 29
performanc e tuning 현상 : – HPjmeter 에서 method call count metric 의 맨위에 기대치 않게 나타나는 method tool: expensive method 의 과도한 사용 – HPjmeter – Sitraka JProbe – Glance/gpm 을 사용하여 사용중인 시스템 콜 확인 변경 : – 어플리케이션에서 해당 method 를 덜 사용하도록 한다 . – 다른 라이브러리로 해당 method 를 stub 시킨다 . – 알려진 문제 : – 시스템 콜 : getTimeOfDay() 는 시스템 자원을 많이 사용 – date 포매팅 30
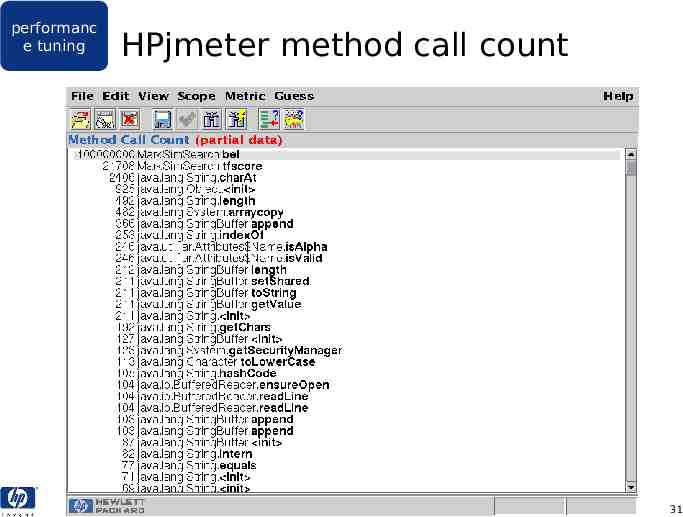
performanc e tuning HPjmeter method call count 31
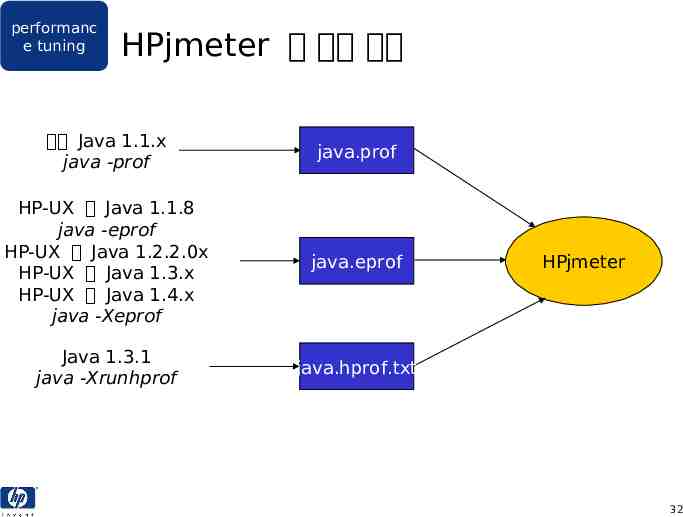
performanc e tuning HPjmeter 의 입력 파일 모든 Java 1.1.x java -prof java.prof HP-UX 용 Java 1.1.8 java -eprof HP-UX 용 Java 1.2.2.0x HP-UX 용 Java 1.3.x HP-UX 용 Java 1.4.x java -Xeprof java.eprof Java 1.3.1 java -Xrunhprof java.hprof.txt HPjmeter 32
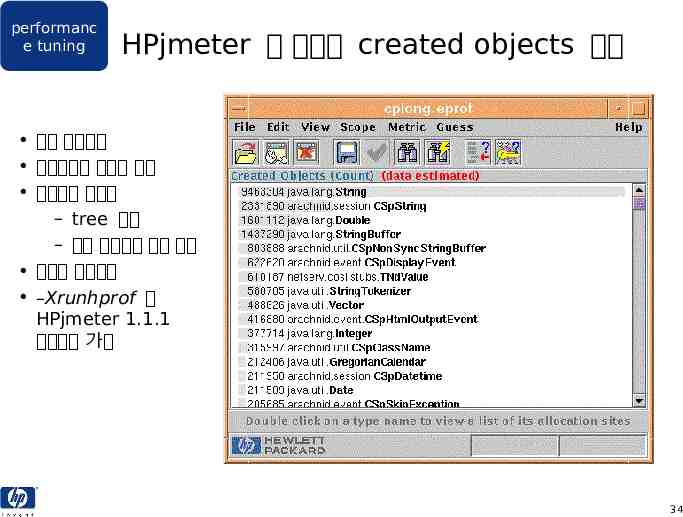
performanc e tuning 현상 : – performance 가매우 느림 tool: short-lived 오브젝트의 과도한 사용 – HPjmeter 를 사용하여 오브젝트의 생성 및 종료와 관련된 항목을 분석한다 . 변경 : – 어플리케이션 소스에서 shortlived 오브젝트를 많이 생성하지 않도록 조정 33
performanc e tuning HPjmeter 를 사용한 created objects 분석 잔여 오브젝트 코드상에서 생성된 위치 레퍼런스 그래프 – tree 형태 – 참조 오브젝트 검색 기능 할당된 오브젝트 –Xrunhprof 및 HPjmeter 1.1.1 사용하면 가능 34
performanc e tuning 현상 : – 메모리가 적거나 없어서 발생하는 segmentation violation – performance 가매우 느림 tool: Thread 의 과도한 사용 – Glance/gpm thread 화면 변경 : – 어플리케이션에서 com.hp.io.Poll API 를 사용하도록 한다 . (HP 에서 개발하여 SDK 1.4 에서는 표준이 됨 ) – 어플리케이션에서 thread pool 의 사용 35
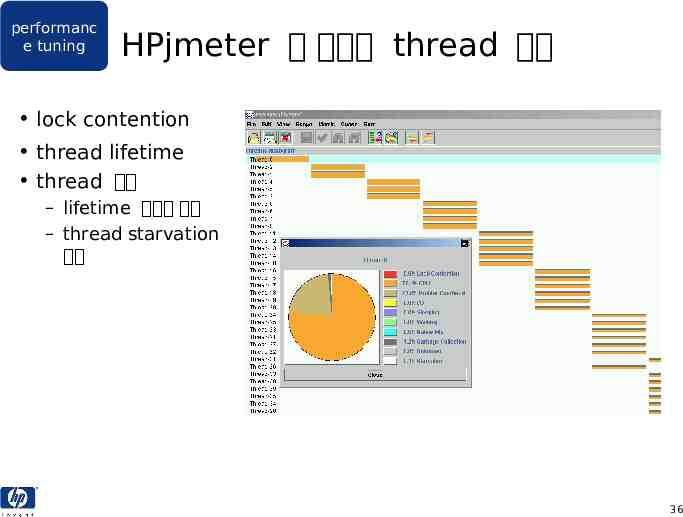
performanc e tuning HPjmeter 를 사용한 thread 분석 lock contention thread lifetime thread 상태 – lifetime 동안의 분포 – thread starvation 확인 36
performanc e tuning 현상 : – JVM 의 메모리 소모가 증가하여 Out of memory 상황이 발생한다 . Memory leak tool: – Glance/gpm 을 사용하여 메모리 및 프로세스 RSS 크기가 지속적으로 증가하는지 분석 변경 : – 어플리케이션 소스에서 불필요한 오브젝트를 가지고 있지 않도록 조정 37
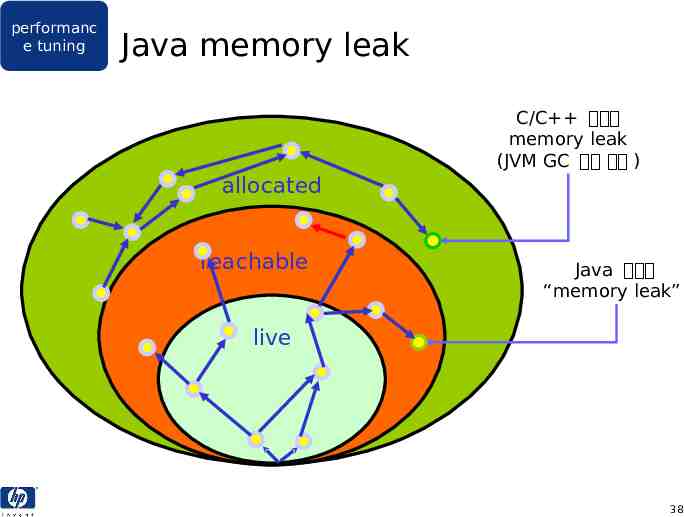
performanc e tuning Java memory leak C/C 에서의 memory leak (JVM GC 에서 제어 ) allocated reachable Java 에서의 “memory leak” live 38
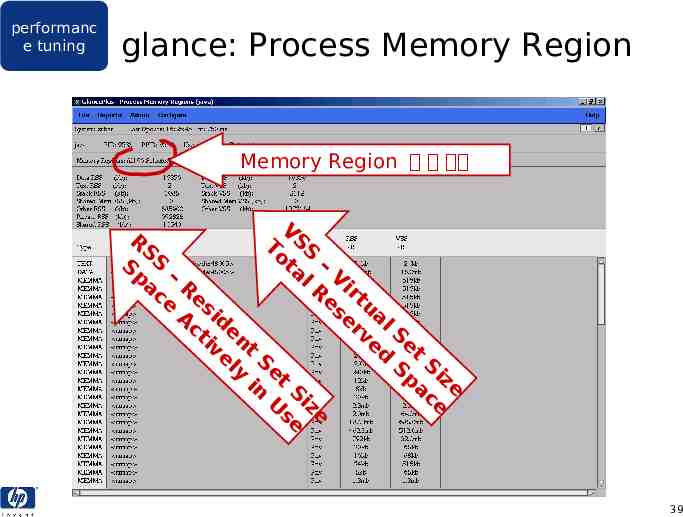
performanc e tuning glance: Process Memory Region Memory Region 의 총 개수 V R To SS SS ta – Sp – l R Vi ac R es rtu e es A id er al ct e ve Se iv n t d t el S Sp Si y et in S ac ze U iz e se e 39
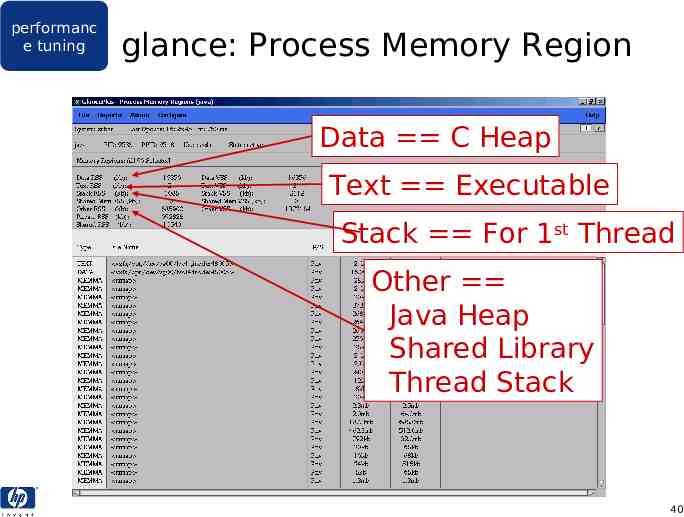
performanc e tuning glance: Process Memory Region Data C Heap Text Executable Stack For 1st Thread Other Java Heap Shared Library Thread Stack 40
performanc e tuning glance: 메모리 증가 해당 프로세스의 Memory Region 화면 확인 Data RSS (resident set size) 는 C heap (malloc) 을 표시한다 . Text RSS 는 binary code 를 위해 사용되는 메모리이다 . Other RSS 는 shared 라이브러리 및 Java heap 을 위해 사용되는 메모리이다 . 이 region 중에 눈에 띄게 증가하는 것이 있는지 살펴 본다 . glance advisor 모드 : – glance -adviser only -syntax adviser rss.syntax -j 5 glance rss.out – 매 5 초마다 데이터 수집 – 특히 , RSS size 를 주의 깊게 확인한다 . 41
performanc e tuning JavaServer Pages (JSPs): –short-lived 오브젝트 생성의 최소화 –StringBuffer.append() 어플리케이션 관련 이슈 initialize lazily –Exception 을 파라메타로 전달한 다. –date 오브젝트를 데잍베이스로 전달한다 . 42
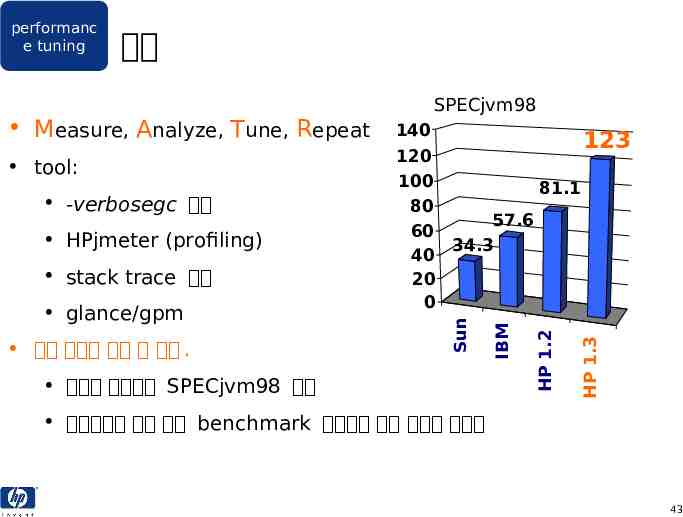
performanc e tuning 결론 SPECjvm98 HPjmeter (profiling) stack trace 분석 glance/gpm 성능 향상을 이룰 수 있다 . 업계를 선도하는 SPECjvm98 수치 123 HP 1.3 -verbosegc 분석 HP 1.2 tool: 120 100 81.1 80 57.6 60 34.3 40 20 0 IBM 140 Sun Measure, Analyze, Tune, Repeat 지속적으로 모든 주요 benchmark 결과에서 좋은 결과를 보여줌 43
performanc e tuning 참조 Java Performance Tuning 웹 사이트 http://www.hp.com/dspp 에 가서 “ Performance Tuning Java” 검색 Java 관련 hp 제품 http://www.hp.com/go/java 44
performanc e tuning 45