A Progress Report on Combining MODIS and CALIPSO Aerosol Data

29 Slides5.78 MB
A Progress Report on Combining MODIS and CALIPSO Aerosol Data for Direct Radiative Effect Studies Jens Redemann, Qin Zhang, Philip Russell, John Livingston, Mark Vaughan BAERI –NASA Ames – SRI – SSAI http://geo.arc.nasa.gov/AATS-website/ email: [email protected]
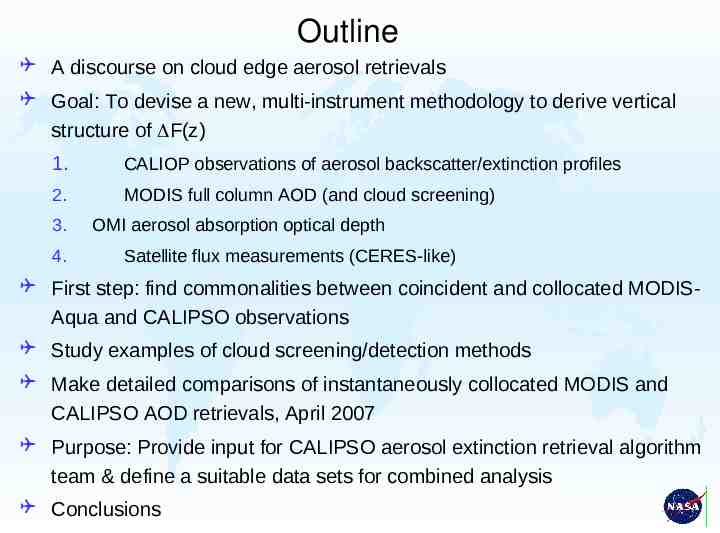
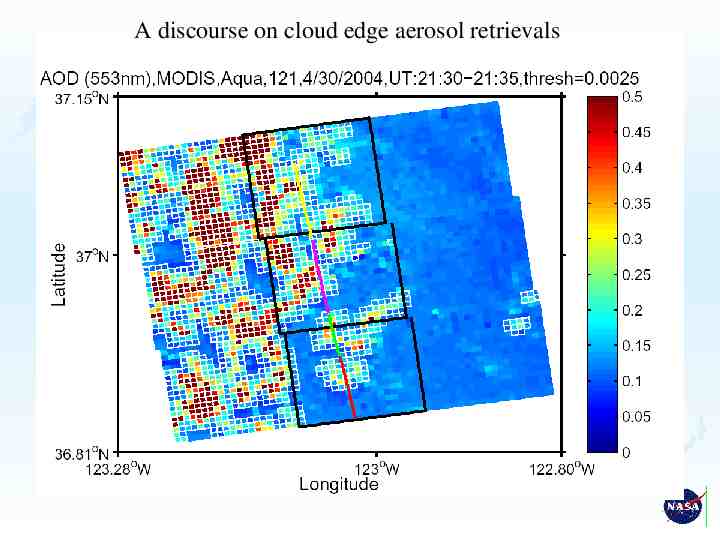
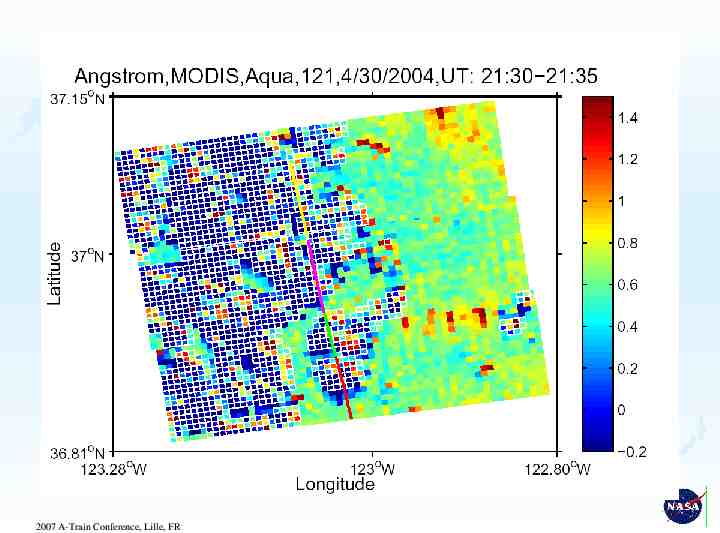
Outline A discourse on cloud edge aerosol retrievals Goal: To devise a new, multi-instrument methodology to derive vertical structure of F(z) 1. CALIOP observations of aerosol backscatter/extinction profiles 2. MODIS full column AOD (and cloud screening) 3. 4. OMI aerosol absorption optical depth Satellite flux measurements (CERES-like) First step: find commonalities between coincident and collocated MODISAqua and CALIPSO observations Study examples of cloud screening/detection methods Make detailed comparisons of instantaneously collocated MODIS and CALIPSO AOD retrievals, April 2007 Purpose: Provide input for CALIPSO aerosol extinction retrieval algorithm team & define a suitable data sets for combined analysis Conclusions
A discourse on cloud edge aerosol retrievals
2007 A-Train Conference, Lille, FR
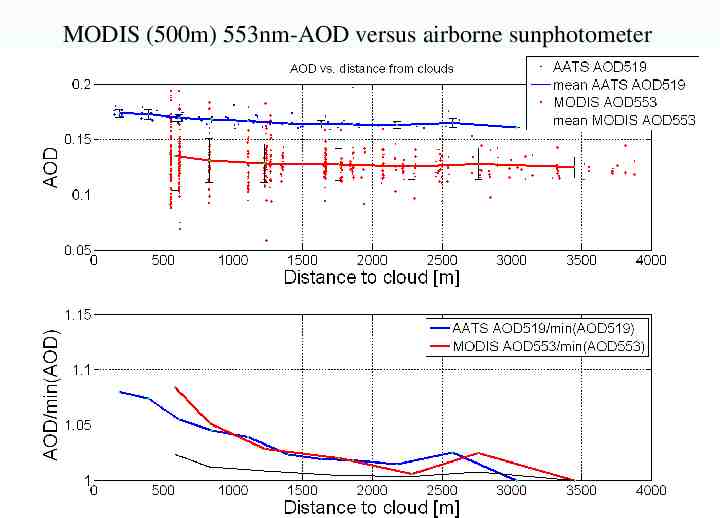
MODIS (500m) 553nm-AOD versus airborne sunphotometer
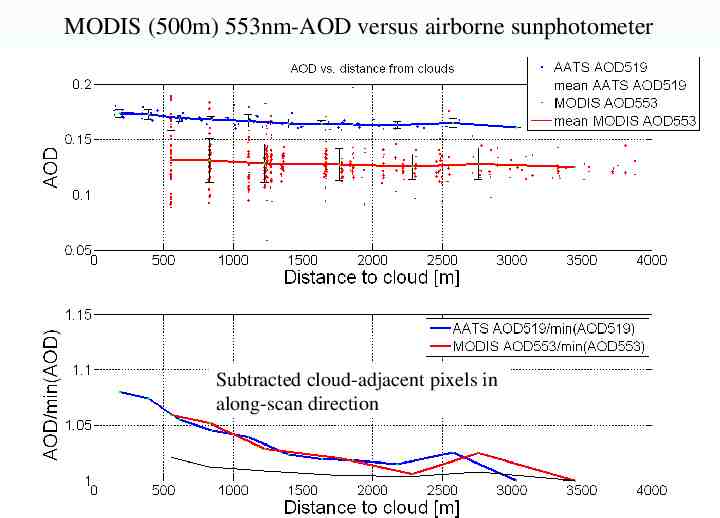
MODIS (500m) 553nm-AOD versus airborne sunphotometer Subtracted cloud-adjacent pixels in along-scan direction
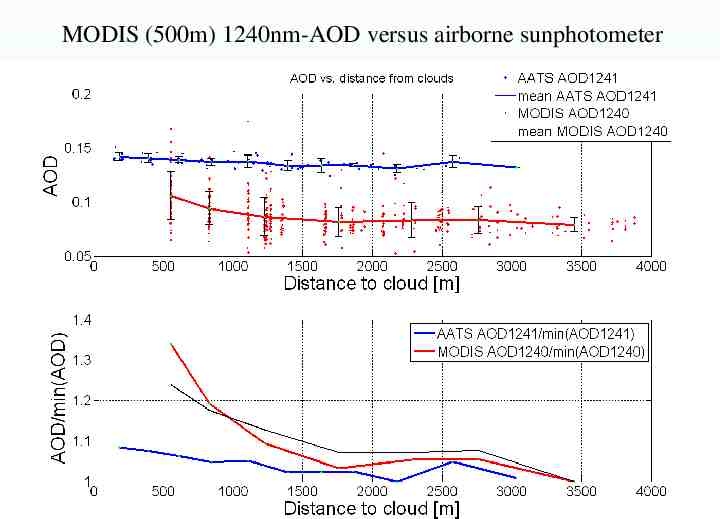
MODIS (500m) 1240nm-AOD versus airborne sunphotometer
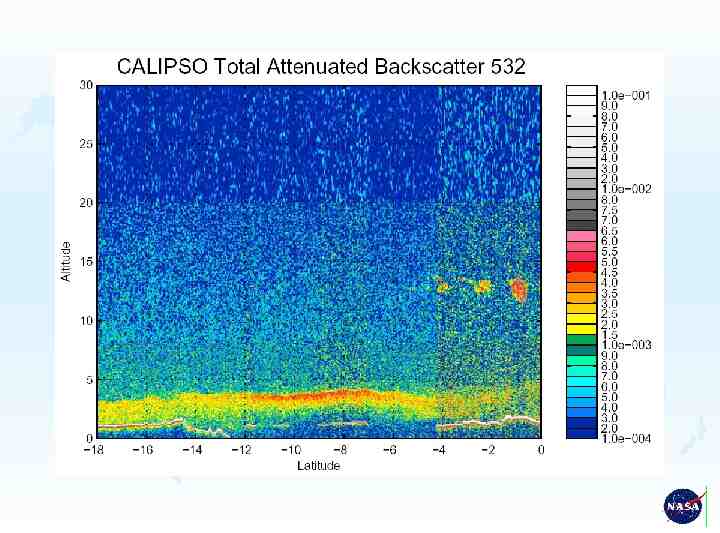
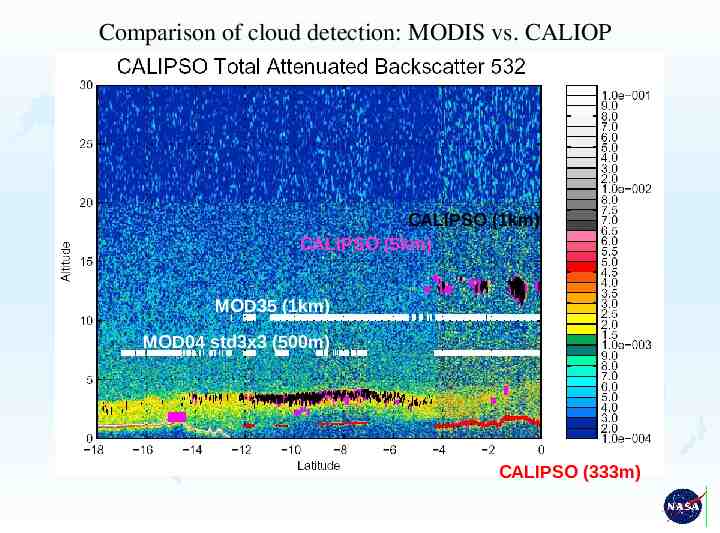
Comparison of cloud detection: MODIS vs. CALIOP CALIPSO (1km) CALIPSO (5km) MOD35 (1km) MOD04 std3x3 (500m) CALIPSO (333m)
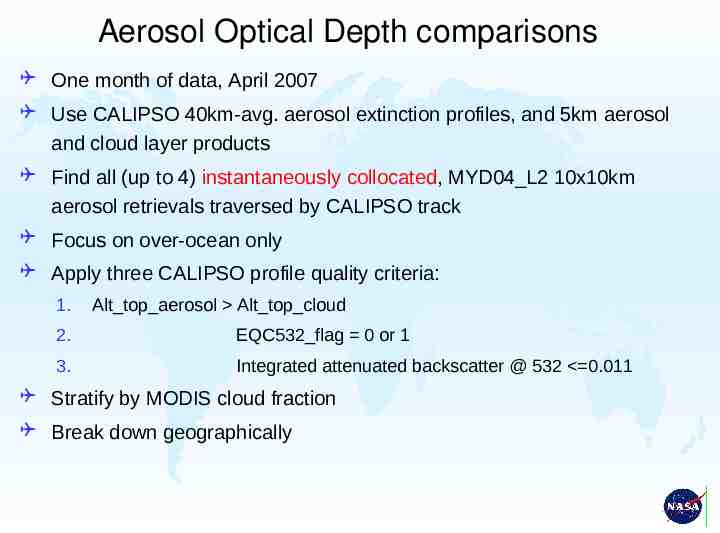
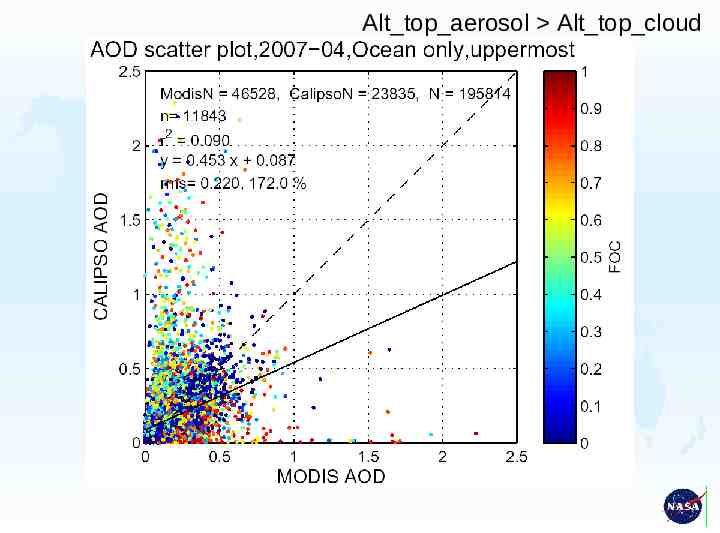
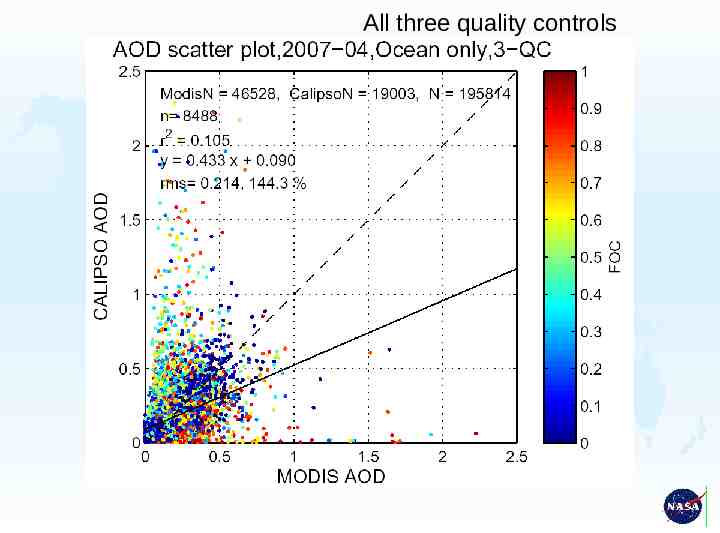
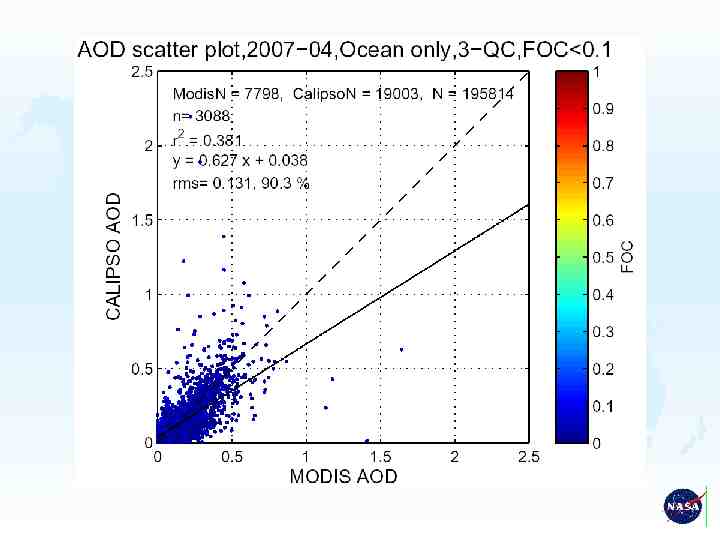
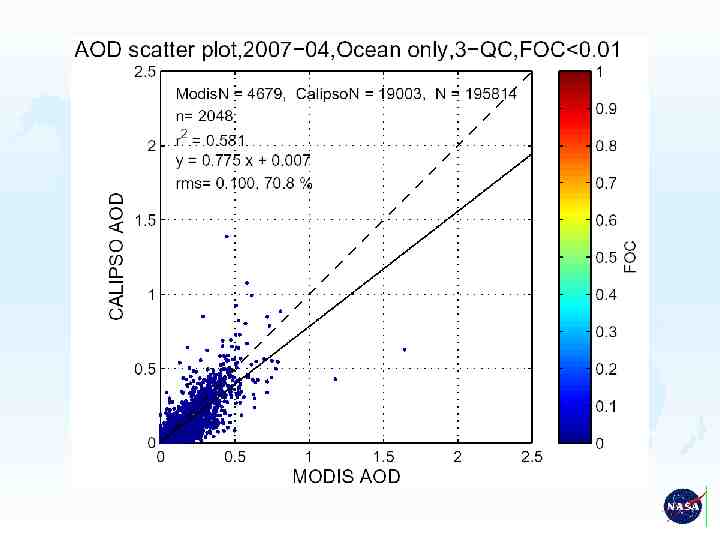
Aerosol Optical Depth comparisons One month of data, April 2007 Use CALIPSO 40km-avg. aerosol extinction profiles, and 5km aerosol and cloud layer products Find all (up to 4) instantaneously collocated, MYD04 L2 10x10km aerosol retrievals traversed by CALIPSO track Focus on over-ocean only Apply three CALIPSO profile quality criteria: 1. Alt top aerosol Alt top cloud 2. EQC532 flag 0 or 1 3. Integrated attenuated backscatter @ 532 0.011 Stratify by MODIS cloud fraction Break down geographically
Alt top aerosol Alt top cloud
All three quality controls
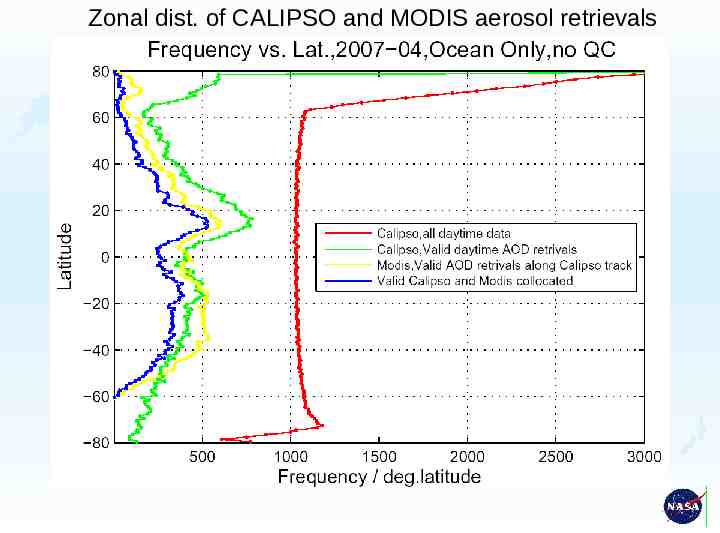
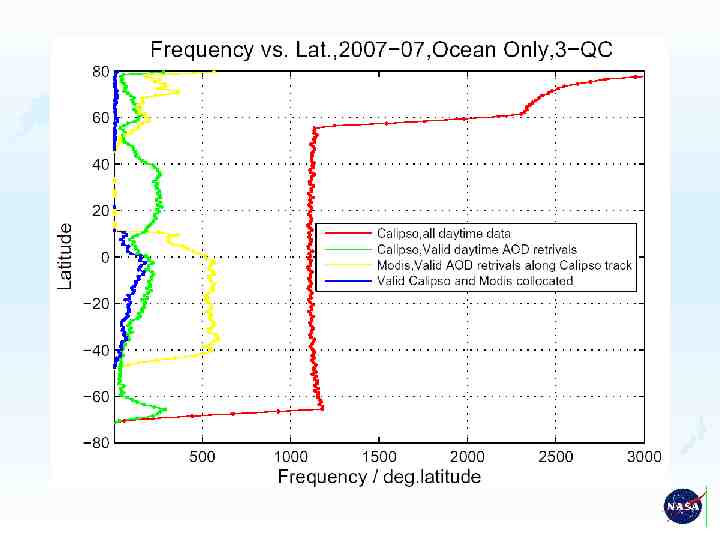
Zonal dist. of CALIPSO and MODIS aerosol retrievals
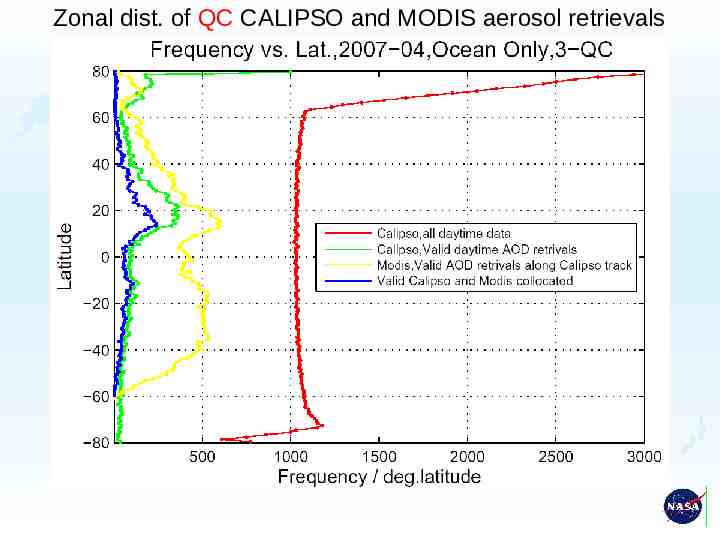
Zonal dist. of QC CALIPSO and MODIS aerosol retrievals
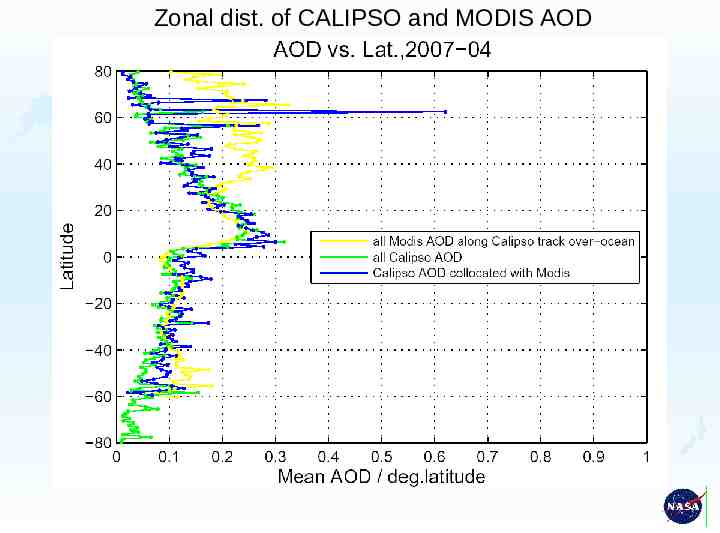
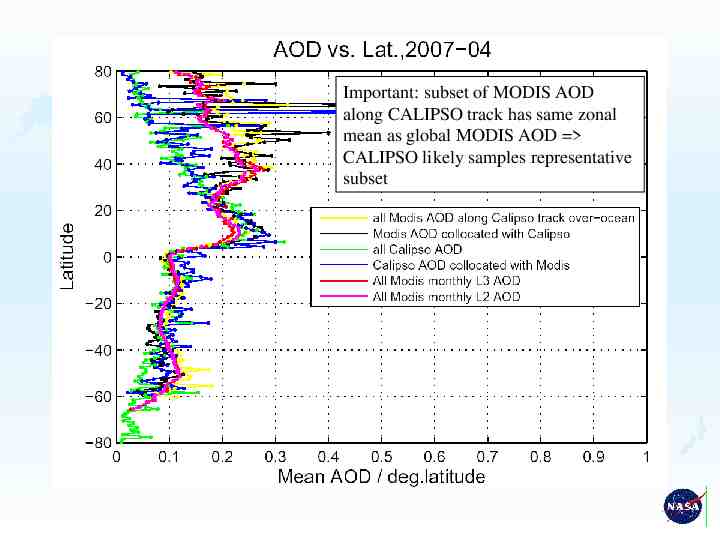
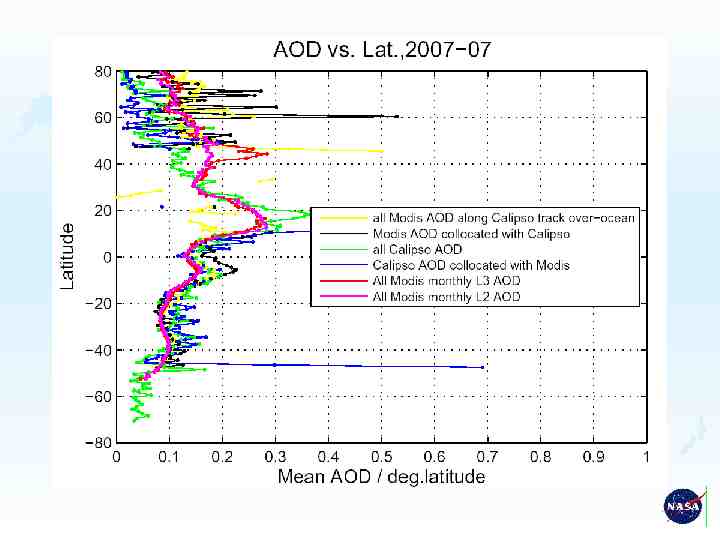
Zonal dist. of CALIPSO and MODIS AOD
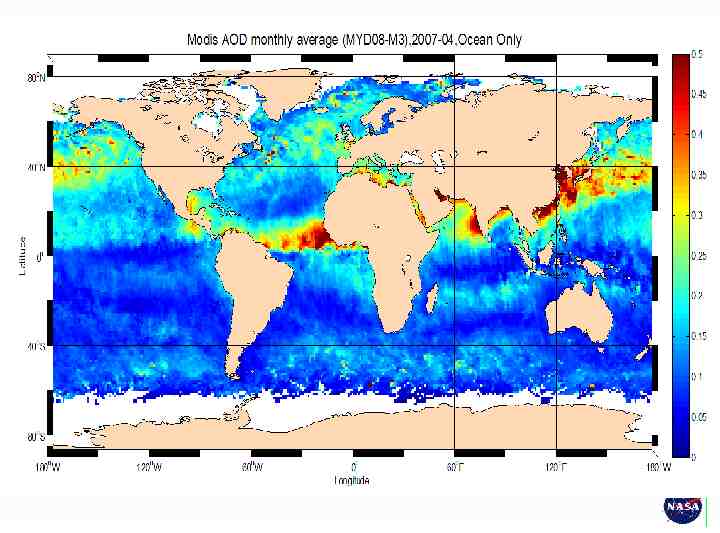
Important: subset of MODIS AOD along CALIPSO track has same zonal mean as global MODIS AOD CALIPSO likely samples representative subset
2007 LMU, Redemann
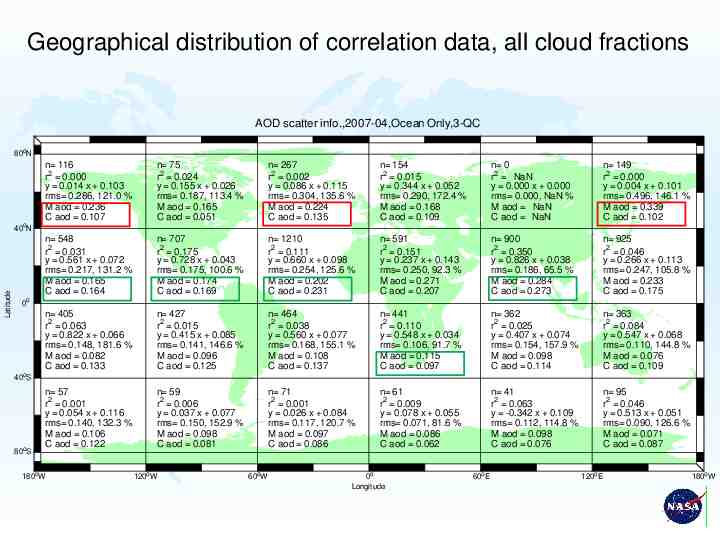
Geographical distribution of correlation data, all cloud fractions AOD scatter info.,2007-04,Ocean Only,3-QC 80oN Latitude 40oN n 116 r2 0.000 y 0.014 x 0.103 rms 0.286, 121.0 % M aod 0.236 C aod 0.107 n 75 r2 0.024 y 0.155 x 0.026 rms 0.187, 113.4 % M aod 0.165 C aod 0.051 n 267 r2 0.002 y 0.086 x 0.115 rms 0.304, 135.6 % M aod 0.224 C aod 0.135 n 154 r2 0.015 y 0.344 x 0.052 rms 0.290, 172.4 % M aod 0.168 C aod 0.109 n 0 r2 NaN y 0.000 x 0.000 rms 0.000, NaN % M aod NaN C aod NaN n 149 r2 0.000 y 0.004 x 0.101 rms 0.496, 146.1 % M aod 0.339 C aod 0.102 n 548 r2 0.031 y 0.561 x 0.072 rms 0.217, 131.2 % M aod 0.165 C aod 0.164 n 707 r2 0.175 y 0.728 x 0.043 rms 0.175, 100.6 % M aod 0.174 C aod 0.169 n 1210 r2 0.111 y 0.660 x 0.098 rms 0.254, 125.6 % M aod 0.202 C aod 0.231 n 591 r2 0.151 y 0.237 x 0.143 rms 0.250, 92.3 % M aod 0.271 C aod 0.207 n 900 r2 0.350 y 0.826 x 0.038 rms 0.186, 65.5 % M aod 0.284 C aod 0.273 n 925 r2 0.046 y 0.266 x 0.113 rms 0.247, 105.8 % M aod 0.233 C aod 0.175 n 405 r2 0.063 y 0.822 x 0.066 rms 0.148, 181.6 % M aod 0.082 C aod 0.133 n 427 r2 0.015 y 0.415 x 0.085 rms 0.141, 146.6 % M aod 0.096 C aod 0.125 n 464 r2 0.038 y 0.560 x 0.077 rms 0.168, 155.1 % M aod 0.108 C aod 0.137 n 441 r2 0.110 y 0.548 x 0.034 rms 0.106, 91.7 % M aod 0.115 C aod 0.097 n 362 r2 0.025 y 0.407 x 0.074 rms 0.154, 157.9 % M aod 0.098 C aod 0.114 n 363 r2 0.084 y 0.547 x 0.068 rms 0.110, 144.8 % M aod 0.076 C aod 0.109 n 57 2 r 0.001 y 0.054 x 0.116 rms 0.140, 132.3 % M aod 0.106 C aod 0.122 n 59 2 r 0.006 y 0.037 x 0.077 rms 0.150, 152.9 % M aod 0.098 C aod 0.081 n 71 2 r 0.001 y 0.026 x 0.084 rms 0.117, 120.7 % M aod 0.097 C aod 0.086 n 61 2 r 0.009 y 0.078 x 0.055 rms 0.071, 81.6 % M aod 0.086 C aod 0.062 n 41 2 r 0.063 y -0.342 x 0.109 rms 0.112, 114.8 % M aod 0.098 C aod 0.076 n 95 2 r 0.046 y 0.513 x 0.051 rms 0.090, 126.6 % M aod 0.071 C aod 0.087 0o 40oS 80oS 180oW 120oW 60oW 0o Longitude 60oE 120oE 180oW
Geographical distribution of correlation data, cloud fractions 1% AOD scatter info.,2007-04,Ocean Only,3-QC,FOC 0.01 80oN Latitude 40oN n 14 r2 0.165 y 0.274 x 0.001 rms 0.126, 82.8 % M aod 0.152 C aod 0.042 n 10 r2 0.005 y 0.016 x 0.014 rms 0.107, 101.5 % M aod 0.105 C aod 0.016 n 88 r2 0.418 y 0.433 x 0.005 rms 0.154, 67.8 % M aod 0.227 C aod 0.104 n 89 r2 0.334 y 0.342 x 0.001 rms 0.118, 77.2 % M aod 0.153 C aod 0.053 n 0 r2 NaN y 0.000 x 0.000 rms 0.000, NaN % M aod NaN C aod NaN n 45 r2 0.522 y 0.430 x -0.003 rms 0.148, 72.1 % M aod 0.205 C aod 0.085 n 54 r2 0.283 y 0.780 x 0.001 rms 0.078, 67.0 % M aod 0.117 C aod 0.092 n 234 r2 0.629 y 0.985 x -0.020 rms 0.088, 53.7 % M aod 0.164 C aod 0.142 n 212 r2 0.610 y 0.847 x -0.004 rms 0.083, 52.1 % M aod 0.159 C aod 0.131 n 264 r2 0.553 y 0.638 x 0.026 rms 0.130, 52.0 % M aod 0.250 C aod 0.186 n 293 r2 0.633 y 1.053 x -0.023 rms 0.114, 38.9 % M aod 0.292 C aod 0.285 n 185 r2 0.415 y 0.583 x 0.035 rms 0.116, 55.5 % M aod 0.210 C aod 0.157 n 42 r2 0.199 y 0.829 x 0.023 rms 0.050, 82.0 % M aod 0.061 C aod 0.074 n 75 r2 0.169 y 0.507 x 0.036 rms 0.050, 64.7 % M aod 0.078 C aod 0.075 n 64 r2 0.011 y 0.141 x 0.068 rms 0.066, 92.5 % M aod 0.071 C aod 0.078 n 85 r2 0.305 y 0.559 x 0.022 rms 0.050, 64.3 % M aod 0.078 C aod 0.066 n 67 r2 0.250 y 0.944 x 0.020 rms 0.066, 92.0 % M aod 0.072 C aod 0.088 n 93 r2 0.455 y 0.858 x 0.022 rms 0.042, 87.3 % M aod 0.048 C aod 0.063 n 16 2 r 0.530 y 1.278 x 0.015 rms 0.052, 71.5 % M aod 0.073 C aod 0.109 n 25 2 r 0.667 y 1.167 x 0.006 rms 0.041, 69.6 % M aod 0.058 C aod 0.074 n 27 2 r 0.304 y 1.437 x 0.000 rms 0.097, 128.3 % M aod 0.076 C aod 0.109 n 20 2 r 0.232 y 0.800 x 0.022 rms 0.030, 52.5 % M aod 0.057 C aod 0.067 n 11 2 r 0.461 y 0.560 x 0.027 rms 0.032, 43.2 % M aod 0.075 C aod 0.069 n 35 2 r 0.175 y 0.694 x 0.028 rms 0.049, 81.8 % M aod 0.061 C aod 0.070 0o 40oS 80oS 180oW 120oW 60oW 0o Longitude 60oE 120oE 180oW
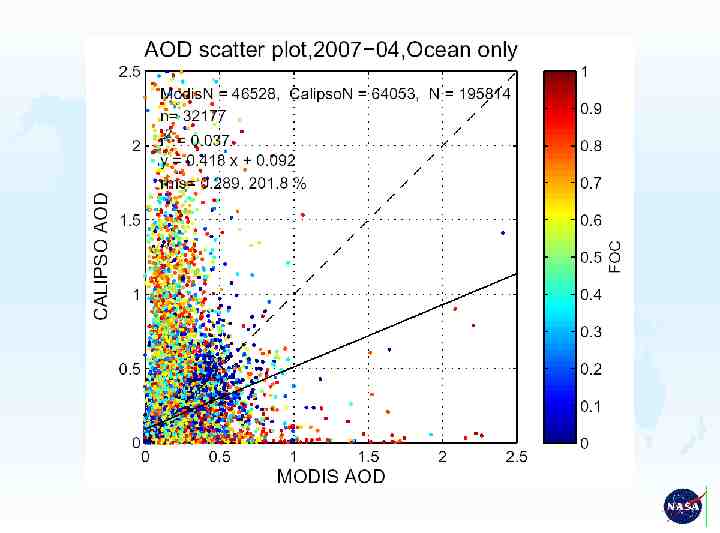
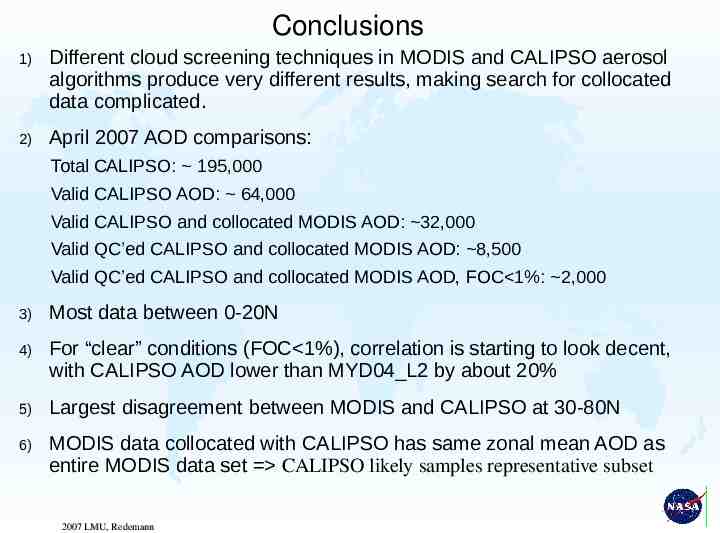
Conclusions 1) Different cloud screening techniques in MODIS and CALIPSO aerosol algorithms produce very different results, making search for collocated data complicated. 2) April 2007 AOD comparisons: Total CALIPSO: 195,000 Valid CALIPSO AOD: 64,000 Valid CALIPSO and collocated MODIS AOD: 32,000 Valid QC’ed CALIPSO and collocated MODIS AOD: 8,500 Valid QC’ed CALIPSO and collocated MODIS AOD, FOC 1%: 2,000 3) Most data between 0-20N 4) For “clear” conditions (FOC 1%), correlation is starting to look decent, with CALIPSO AOD lower than MYD04 L2 by about 20% 5) Largest disagreement between MODIS and CALIPSO at 30-80N 6) MODIS data collocated with CALIPSO has same zonal mean AOD as entire MODIS data set CALIPSO likely samples representative subset 2007 LMU, Redemann