Reliability Block Diagram Modeling – A Comparison of Three Software

19 Slides623.00 KB
Reliability Block Diagram Modeling – A Comparison of Three Software Packages Aron Brall, SRS Technologies, Mission Support Division William Hagen, Ford Motor Company, Powertrain Manufacturing Engineering Hung Tran, SRS Technologies, Mission Support Division 1
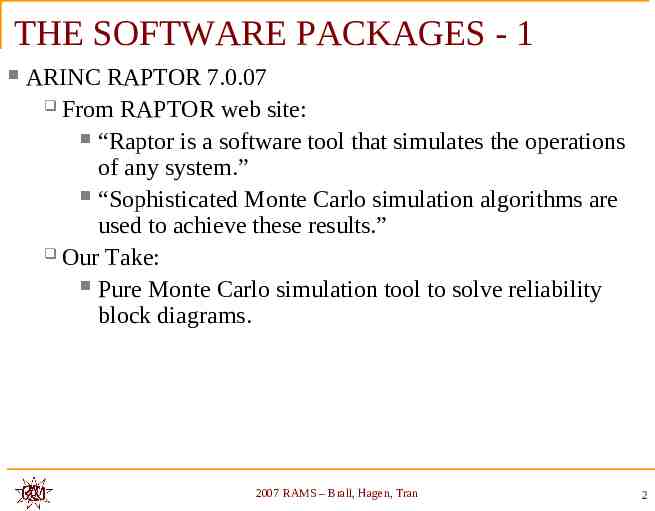
THE SOFTWARE PACKAGES - 1 ARINC RAPTOR 7.0.07 From RAPTOR web site: “Raptor is a software tool that simulates the operations of any system.” “Sophisticated Monte Carlo simulation algorithms are used to achieve these results.” Our Take: Pure Monte Carlo simulation tool to solve reliability block diagrams. 2007 RAMS – Brall, Hagen, Tran 2
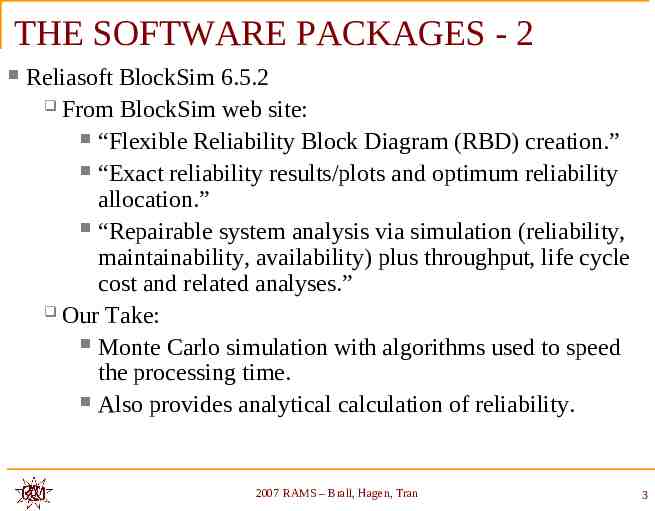
THE SOFTWARE PACKAGES - 2 Reliasoft BlockSim 6.5.2 From BlockSim web site: “Flexible Reliability Block Diagram (RBD) creation.” “Exact reliability results/plots and optimum reliability allocation.” “Repairable system analysis via simulation (reliability, maintainability, availability) plus throughput, life cycle cost and related analyses.” Our Take: Monte Carlo simulation with algorithms used to speed the processing time. Also provides analytical calculation of reliability. 2007 RAMS – Brall, Hagen, Tran 3
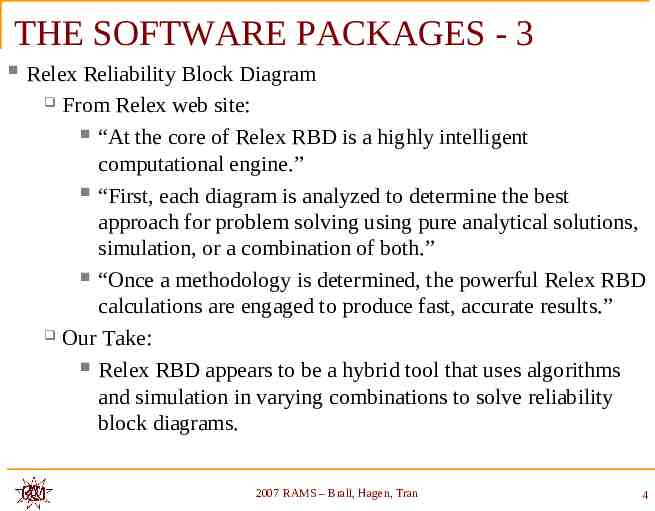
THE SOFTWARE PACKAGES - 3 Relex Reliability Block Diagram From Relex web site: “At the core of Relex RBD is a highly intelligent computational engine.” “First, each diagram is analyzed to determine the best approach for problem solving using pure analytical solutions, simulation, or a combination of both.” “Once a methodology is determined, the powerful Relex RBD calculations are engaged to produce fast, accurate results.” Our Take: Relex RBD appears to be a hybrid tool that uses algorithms and simulation in varying combinations to solve reliability block diagrams. 2007 RAMS – Brall, Hagen, Tran 4
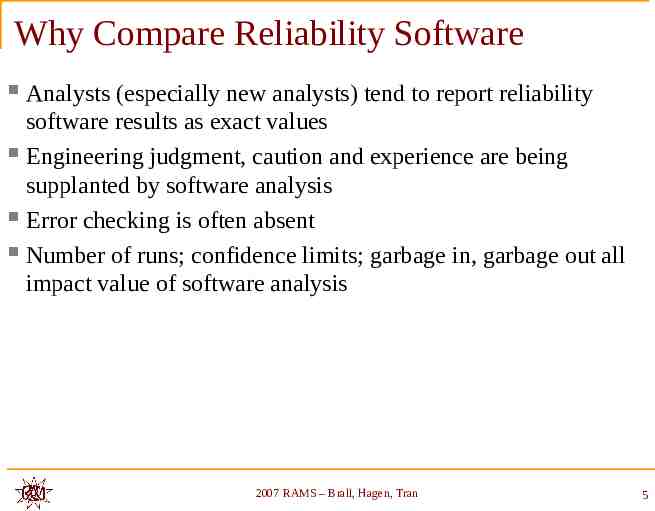
Why Compare Reliability Software Analysts (especially new analysts) tend to report reliability software results as exact values Engineering judgment, caution and experience are being supplanted by software analysis Error checking is often absent Number of runs; confidence limits; garbage in, garbage out all impact value of software analysis 2007 RAMS – Brall, Hagen, Tran 5
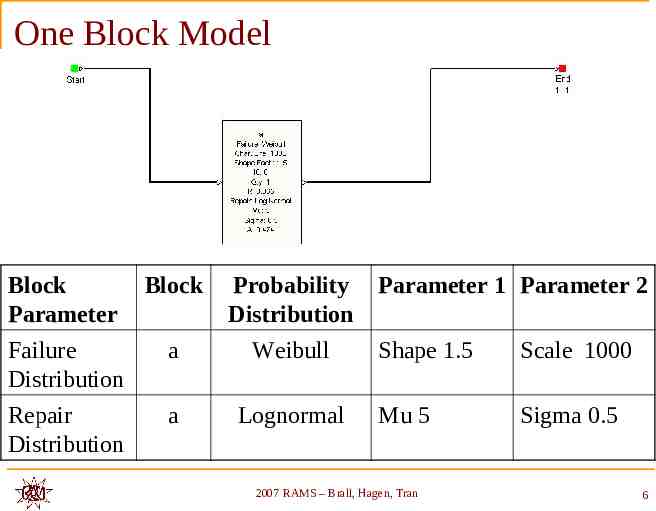
One Block Model Block Parameter Block Probability Distribution Failure Distribution a Weibull Repair Distribution a Lognormal Parameter 1 Parameter 2 Shape 1.5 Scale 1000 Mu 5 Sigma 0.5 2007 RAMS – Brall, Hagen, Tran 6
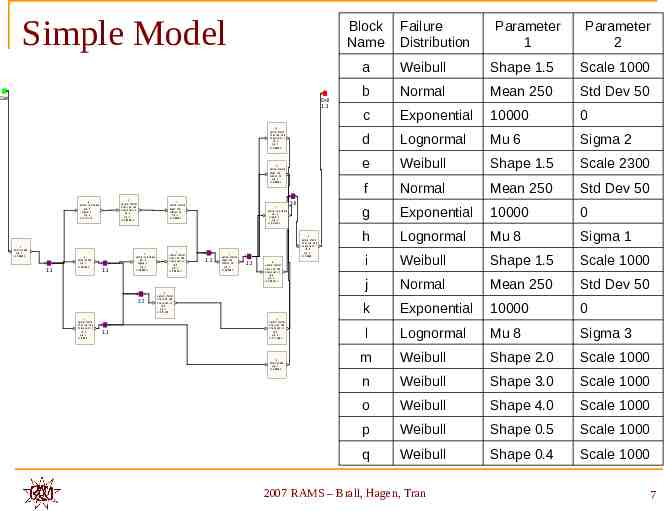
Simple Model Block Name Start End 1::1 m Failure: Weibull Char. Life: 1000 Shape Fact.: 2 t0: 0 Qty: 1 R: 0.99005 b Failure: Normal Mean: 250 StdDev : 50 Qty: 1 R: 0.99865 e Failure: Weibull Char. Life: 2300 Shape Fact.: 1.5 t0: 0 Qty : 1 R: 0.990975 d Failure: Log Normal Mu: 6 Sigma: 2 Qty: 1 R: 0.757228 c MTBF: 10000 Qty : 1 R: 0.99005 1::1 g MTBF: 10000 Qty: 1 R: 0.99005 1::1 h Failure: Log Norm al Mu: 8 Sigma: 1 Qty : 1 R: 0.999657 1::2 n Failure: Weibull Char. Life: 1000 S hape Fac t.: 3 t0: 0 Qty: 1 R: 0.999 1::1 f Failure: Normal Mean: 250 StdDev : 50 Qty: 1 R: 0.99865 i Failure: Weibull Char. Life: 1000 Shape Fact.: 1.5 t0: 0 Qty: 1 R: 0.968872 l Failure: Log Normal M u: 8 Sigma: 3 Qty: 1 R: 0.871101 1::2 j Failure: Normal M ean: 250 S tdDev: 50 Qty : 1 R: 0.99865 3::6 o Failure: Weibull Char. Life: 1000 Shape Fact.: 4 t0: 0 Qty : 1 R: 0.9999 1::1 a Failure: Weibull Char. Life: 1000 Shape Fac t.: 1.5 t0: 0 Qty: 1 R: 0.968872 q Failure: Weibull Char. Life: 1000 S hape Fac t.: 0.4 t0: 0 Qty: 1 R: 0.67159 p Failure: Weibull Char. Life: 1000 S hape Fac t.: 0.5 t0: 0 Qty: 1 R: 0.728893 k MTB F: 10000 Qty: 1 R: 0.99005 Failure Distribution Parameter 1 Parameter 2 a Weibull Shape 1.5 Scale 1000 b Normal Mean 250 Std Dev 50 c Exponential 10000 0 d Lognormal Mu 6 Sigma 2 e Weibull Shape 1.5 Scale 2300 f Normal Mean 250 Std Dev 50 g Exponential 10000 0 h Lognormal Mu 8 Sigma 1 i Weibull Shape 1.5 Scale 1000 j Normal Mean 250 Std Dev 50 k Exponential 10000 0 l Lognormal Mu 8 Sigma 3 m Weibull Shape 2.0 Scale 1000 n Weibull Shape 3.0 Scale 1000 o Weibull Shape 4.0 Scale 1000 p Weibull Shape 0.5 Scale 1000 q Weibull Shape 0.4 Scale 1000 2007 RAMS – Brall, Hagen, Tran 7
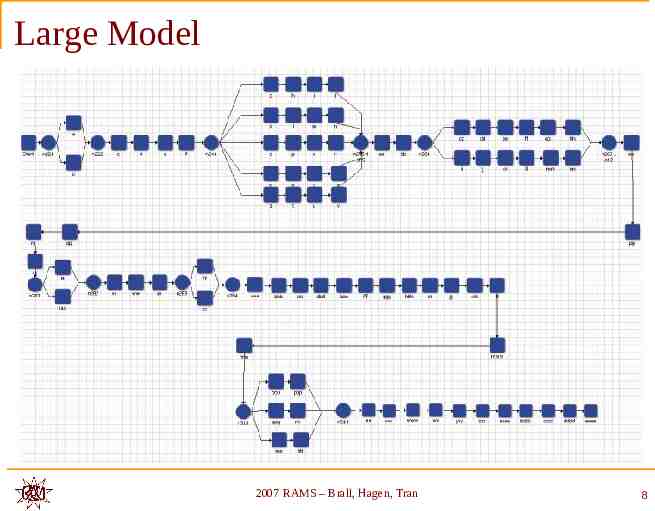
Large Model 2007 RAMS – Brall, Hagen, Tran 8
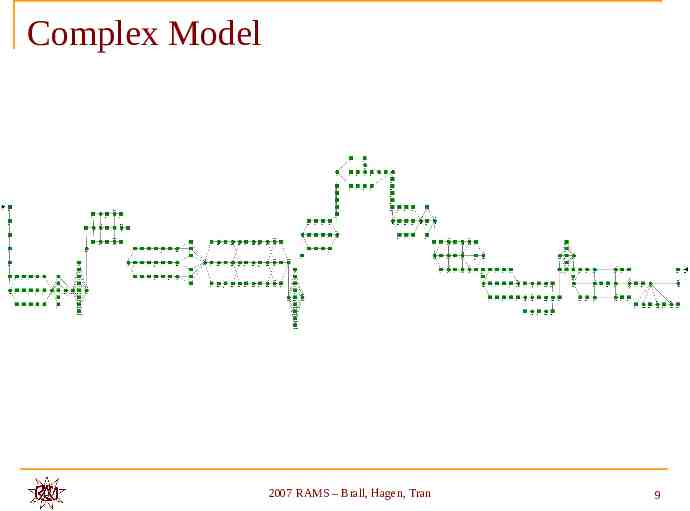
Complex Model 2007 RAMS – Brall, Hagen, Tran 9
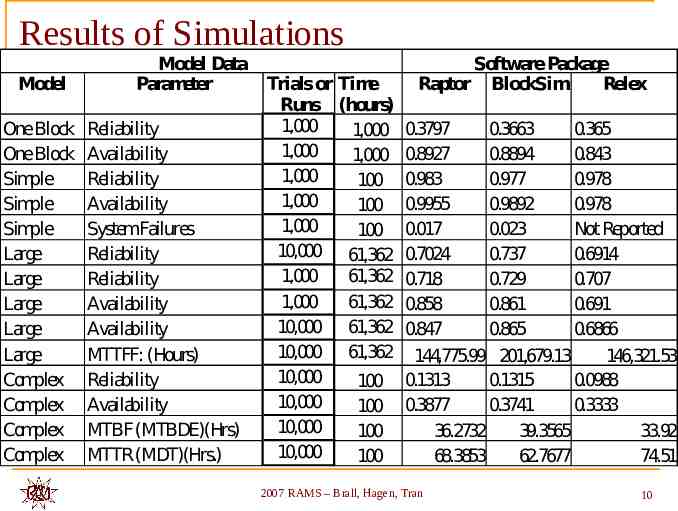
Results of Simulations Model Data Model Parameter Trials or Time Runs (hours) 1,000 OneBlock Reliability 1,000 1,000 OneBlock Availability 1,000 1,000 Simple Reliability 100 1,000 Simple Availability 100 1,000 Simple SystemFailures 100 10,000 61,362 Large Reliability 1,000 61,362 Large Reliability 1,000 61,362 Large Availability 10,000 61,362 Large Availability 10,000 61,362 Large MTTFF: (Hours) 10,000 Complex Reliability 100 10,000 Complex Availability 100 10,000 Complex MTBF (MTBDE)(Hrs) 100 10,000 Complex MTTR (MDT)(Hrs.) 100 SoftwarePackage Raptor BlockSim Relex 0.3797 0.3663 0.365 0.8927 0.8894 0.843 0.983 0.977 0.978 0.9955 0.9892 0.978 0.017 0.023 Not Reported 0.7024 0.737 0.6914 0.718 0.729 0.707 0.858 0.861 0.691 0.847 0.865 0.6866 144,775.99 201,679.13 146,321.53 0.1313 0.1315 0.0988 0.3877 0.3741 0.3333 36.2732 39.3565 33.92 68.3853 62.7677 74.51 2007 RAMS – Brall, Hagen, Tran 10
What Do the Results Tell Us If precision is required, it isn’t there One to two significant figure agreement at best between packages Confidence limits are necessary for data Some parameters are either defined differently, or calculated using such diverse algorithms or methodologies that they aren’t comparable Errors in modeling or application of the software can go undiscovered when only one software package and one analyst are used The complexity of large models and different issues with each software interface opens up many opportunities for human failure Checking a model for errors can be more time intensive than creating the original model 2007 RAMS – Brall, Hagen, Tran 11
Cautions - 1 Use of a single model, especially a highly complex model, to demonstrate compliance with a requirement is error prone and risky Many times the results of these simulations are used to demonstrate compliance with a specified reliability or availability requirement. A result that would show a Reliability of 0.85 when the requirement was 0.90 might cause redesign, request for waiver, or other action to address the shortfall. The shortfall may be due to the parameters used for the simulation, the algorithms used by the software, a lack of understanding of how long to simulate, how many independent random number streams to use, and/or how many runs to use. Analytical solutions for highly complex models are based on approximations. 2007 RAMS – Brall, Hagen, Tran 12
Cautions - 2 The programs do not necessarily describe variables in the same manner. i.e.When using the Lognormal distribution, there was a difference in terminology between Raptor and BlockSim. Raptor allows the Lognormal to be entered as Mean and Std Dev. or Mu and Sigma. BlockSim only uses Mean and Std. Dev., but this is the same as Raptor’s Mu and Sigma. A novice could waste a great deal of time clarifying what needs to be entered as data. 2007 RAMS – Brall, Hagen, Tran 13
Cautions - 3 Modeling special cases can be difficult because of the way the programs handle standby (which was in our models) and phasing (which was not in our models). Output parameters were not consistently labeled. The user should understand the difference between MTTF, MTTFF, MTBDE, and MTBF for reliability and MDT and MTTR for maintainability. 2007 RAMS – Brall, Hagen, Tran 14
Cautions - 4 The products provide reliability and availability results with various adjectives such as “mean”, “point”, “conditional”, etc. A review of the literature provided with the packages is necessary to understand these terms and relate them to those found in specifications, handbooks, references, and texts. It is a serious issue that there doesn’t appear to be standard and/or consistent terminology and notation from one program to another as well as to standard literature in the field. 2007 RAMS – Brall, Hagen, Tran 15
Cautions - 5 Flexibility Each package has tabs, checkboxes, preferences, defaults, multiple random number streams, selectable seeds for random numbers, etc to facilitate the modeling, analysis, and simulation process. Flexibility can provide huge pitfalls to the analyst. Care in modeling, and use of support services provided by the software supplier is a good practice. Numerous runs and reruns may be necessary due to idiosyncrasies of the software, Beware of errors in modeling, confusion of parameter definition, etc. Problems compound as a variety of failure distributions are intermixed with a similar grouping of repair distributions. As a model becomes more complex, simulation becomes mandatory 2007 RAMS – Brall, Hagen, Tran 16
Observations - 1 The models can run quickly even on old Pentium II PCs, or they can take hours to run. Length of simulation time, number of runs, and failure rate of the system can all contribute to lengthening of simulation time. One of the models took in excess of 1 hour on a 3 GHz Pentium IV. Convergence of the results is heavily dependent on how consistent the block failure rates are. For example, one block with an MTBF of 1000 hours, can double or triple simulation time. The display during simulation on some of the packages shows the general trend, but there can be a lot of outliers. One model failed to converge on one of the packages – again this may have been due to a subtle preference selection (or nonselection). 2007 RAMS – Brall, Hagen, Tran 17
Observations - 2 The display of Availability and or Reliability during simulation can be useful for seeing how the simulation is behaving. For most models, this rapidly stabilizes to the first decimal place, then the second decimal place tends to bounce around. Usually you get the first 2 significant figures in a hundred runs. We have the impression that most of the user interfaces were designed by software designers, working with R&M engineers. The problem is that we seem to have gotten what an R&M engineer would tell someone never having used the product. For example, it’s really annoying that you have to double click and work through tabs to put data into blocks in the block diagrams; the alternative is to use the Item Properties Table, which doesn't let you create blocks and in some cases change probability distributions. 2007 RAMS – Brall, Hagen, Tran 18
Recommendations When demonstrating compliance to a requirement is required Model system using one of the following approaches to reduce human error Have one analyst model in two different software packages Software methodologies are sufficiently different to avoid repeating errors Have second analyst perform detailed audit of model and data entry Have two analysts independently model and enter data Compare results Results should agree within /- 3 Standard Errors of the Mean Make detailed notes of assumptions, methods, simulation values, etc. to provide an audit trail 2007 RAMS – Brall, Hagen, Tran 19