Radio Remote Sensing of the Corona and the Solar Wind Steven R.

23 Slides1.33 MB
Radio Remote Sensing of the Corona and the Solar Wind Steven R. Spangler University of Iowa
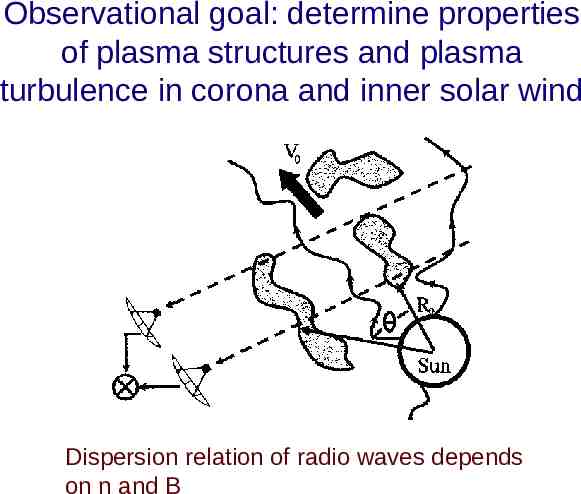
Observational goal: determine properties of plasma structures and plasma turbulence in corona and inner solar wind Dispersion relation of radio waves depends on n and B
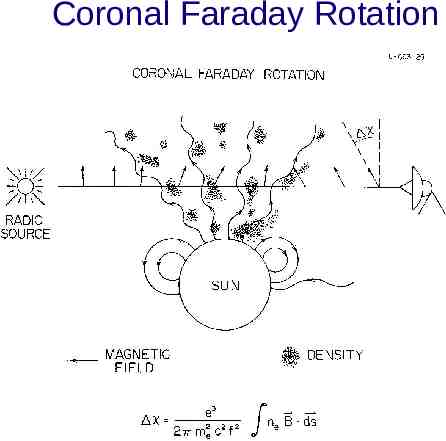
Coronal Faraday Rotation
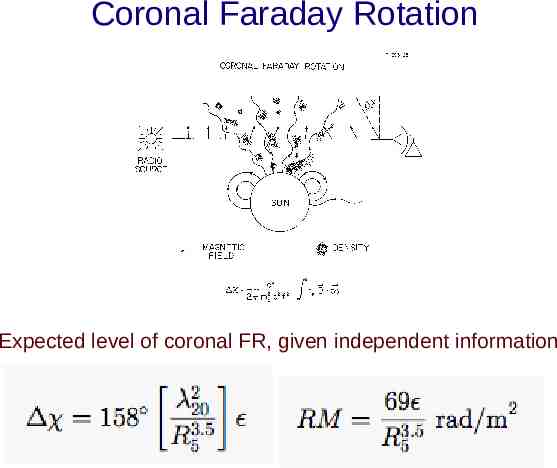
Coronal Faraday Rotation Expected level of coronal FR, given independent information
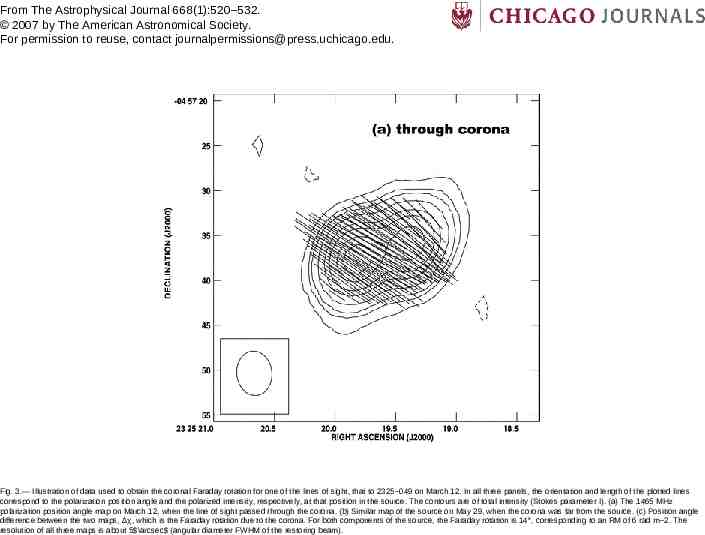
From The Astrophysical Journal 668(1):520–532. 2007 by The American Astronomical Society. For permission to reuse, contact [email protected]. Fig. 3.— Illustration of data used to obtain the coronal Faraday rotation for one of the lines of sight, that to 2325 049 on March 12. In all three panels, the orientation and length of the plotted lines correspond to the polarization position angle and the polarized intensity, respectively, at that position in the source. The contours are of total intensity (Stokes parameter I). (a) The 1465 MHz polarization position angle map on March 12, when the line of sight passed through the corona. (b) Similar map of the source on May 29, when the corona was far from the source. (c) Position angle difference between the two maps, Δχ, which is the Faraday rotation due to the corona. For both components of the source, the Faraday rotation is 14 , corresponding to an RM of 6 rad m 2. The resolution of all three maps is about 5 \arcsec (angular diameter FWHM of the restoring beam).
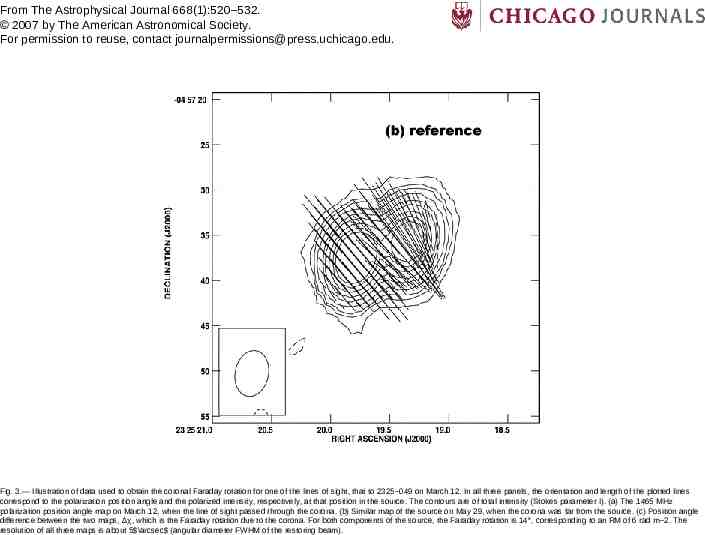
From The Astrophysical Journal 668(1):520–532. 2007 by The American Astronomical Society. For permission to reuse, contact [email protected]. Fig. 3.— Illustration of data used to obtain the coronal Faraday rotation for one of the lines of sight, that to 2325 049 on March 12. In all three panels, the orientation and length of the plotted lines correspond to the polarization position angle and the polarized intensity, respectively, at that position in the source. The contours are of total intensity (Stokes parameter I). (a) The 1465 MHz polarization position angle map on March 12, when the line of sight passed through the corona. (b) Similar map of the source on May 29, when the corona was far from the source. (c) Position angle difference between the two maps, Δχ, which is the Faraday rotation due to the corona. For both components of the source, the Faraday rotation is 14 , corresponding to an RM of 6 rad m 2. The resolution of all three maps is about 5 \arcsec (angular diameter FWHM of the restoring beam).
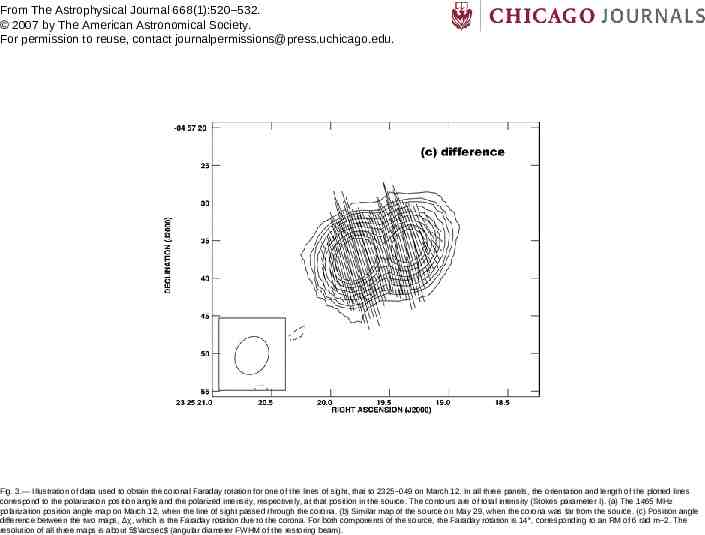
From The Astrophysical Journal 668(1):520–532. 2007 by The American Astronomical Society. For permission to reuse, contact [email protected]. Fig. 3.— Illustration of data used to obtain the coronal Faraday rotation for one of the lines of sight, that to 2325 049 on March 12. In all three panels, the orientation and length of the plotted lines correspond to the polarization position angle and the polarized intensity, respectively, at that position in the source. The contours are of total intensity (Stokes parameter I). (a) The 1465 MHz polarization position angle map on March 12, when the line of sight passed through the corona. (b) Similar map of the source on May 29, when the corona was far from the source. (c) Position angle difference between the two maps, Δχ, which is the Faraday rotation due to the corona. For both components of the source, the Faraday rotation is 14 , corresponding to an RM of 6 rad m 2. The resolution of all three maps is about 5 \arcsec (angular diameter FWHM of the restoring beam).
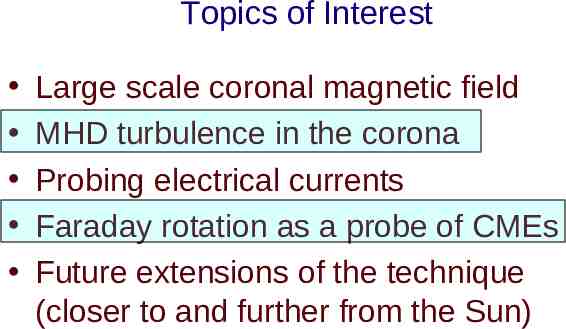
Topics of Interest Large scale coronal magnetic field MHD turbulence in the corona Probing electrical currents Faraday rotation as a probe of CMEs Future extensions of the technique (closer to and further from the Sun)
Topics of Interest Large scale coronal magnetic field MHD turbulence in the corona Probing electrical currents Faraday rotation as a probe of CMEs Future extensions of the technique (closer to and further from the Sun)
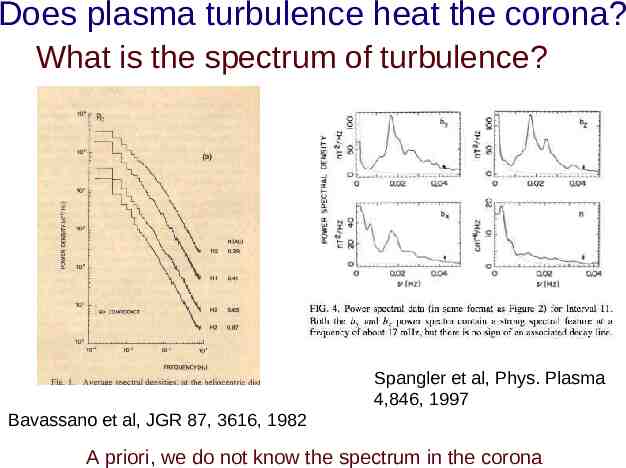
Does plasma turbulence heat the corona? What is the spectrum of turbulence? Spangler et al, Phys. Plasma 4,846, 1997 Bavassano et al, JGR 87, 3616, 1982 A priori, we do not know the spectrum in the corona
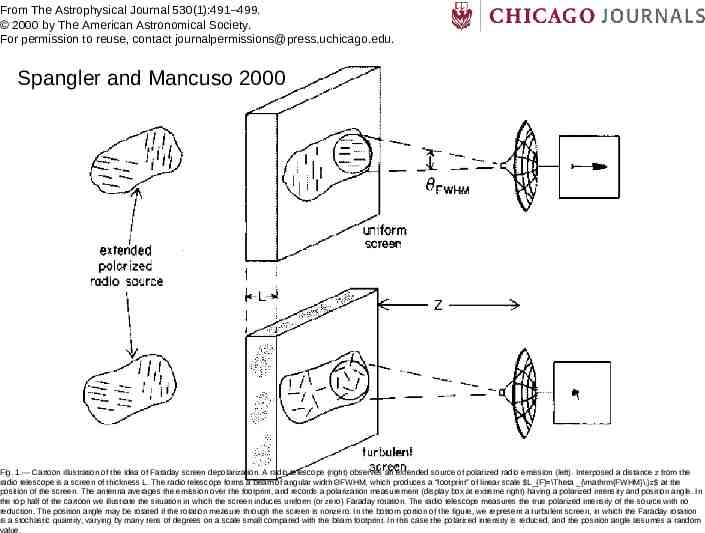
From The Astrophysical Journal 530(1):491–499. 2000 by The American Astronomical Society. For permission to reuse, contact [email protected]. Spangler and Mancuso 2000 Fig. 1.— Cartoon illustration of the idea of Faraday screen depolarization. A radio telescope (right) observes an extended source of polarized radio emission (left). Interposed a distance z from the radio telescope is a screen of thickness L. The radio telescope forms a beam of angular width ΘFWHM, which produces a “footprint” of linear scale L {F} \Theta {\mathrm{FWHM}\,}z at the position of the screen. The antenna averages the emission over the footprint, and records a polarization measurement (display box at extreme right) having a polarized intensity and position angle. In the top half of the cartoon we illustrate the situation in which the screen induces uniform (or zero) Faraday rotation. The radio telescope measures the true polarized intensity of the source with no reduction. The position angle may be rotated if the rotation measure through the screen is nonzero. In the bottom portion of the figure, we represent a turbulent screen, in which the Faraday rotation is a stochastic quantity, varying by many tens of degrees on a scale small compared with the beam footprint. In this case the polarized intensity is reduced, and the position angle assumes a random value.
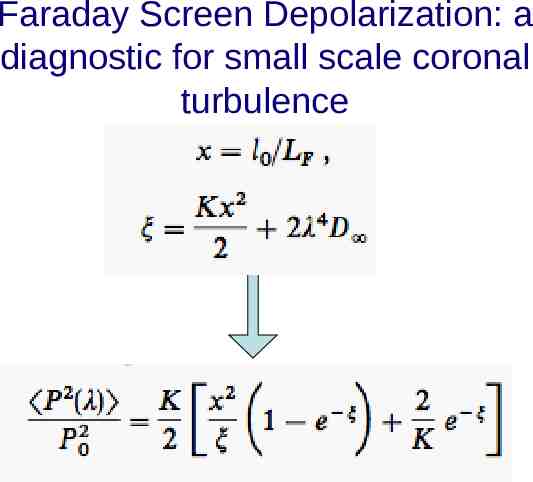
Faraday Screen Depolarization: a diagnostic for small scale coronal turbulence
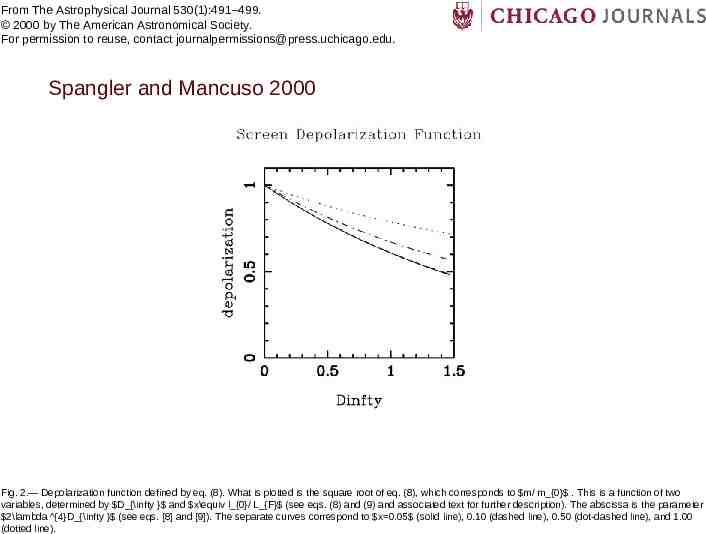
From The Astrophysical Journal 530(1):491–499. 2000 by The American Astronomical Society. For permission to reuse, contact [email protected]. Spangler and Mancuso 2000 Fig. 2.— Depolarization function defined by eq. (8). What is plotted is the square root of eq. (8), which corresponds to m/ m {0} . This is a function of two variables, determined by D {\infty } and x\equiv l {0}/ L {F} (see eqs. (8) and (9) and associated text for further description). The abscissa is the parameter 2\lambda {4}D {\infty } (see eqs. [8] and [9]). The separate curves correspond to x 0.05 (solid line), 0.10 (dashed line), 0.50 (dot-dashed line), and 1.00 (dotted line).
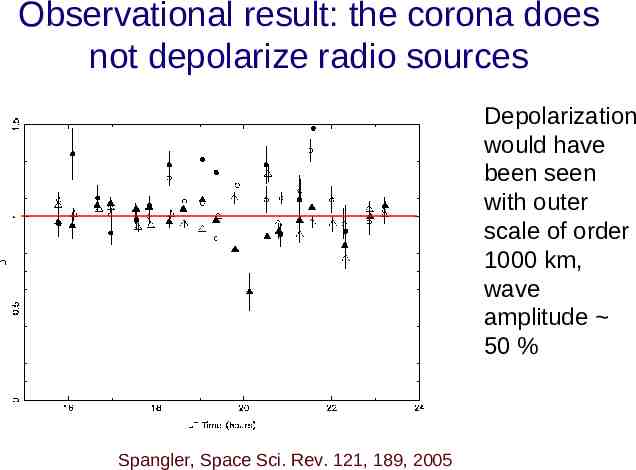
Observational result: the corona does not depolarize radio sources Depolarization would have been seen with outer scale of order 1000 km, wave amplitude 50 % Spangler, Space Sci. Rev. 121, 189, 2005
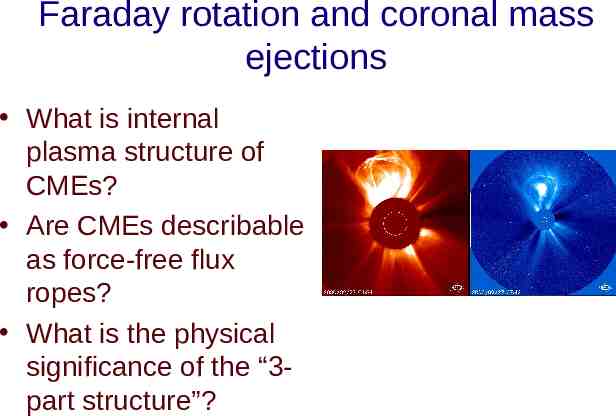
Faraday rotation and coronal mass ejections What is internal plasma structure of CMEs? Are CMEs describable as force-free flux ropes? What is the physical significance of the “3part structure”?
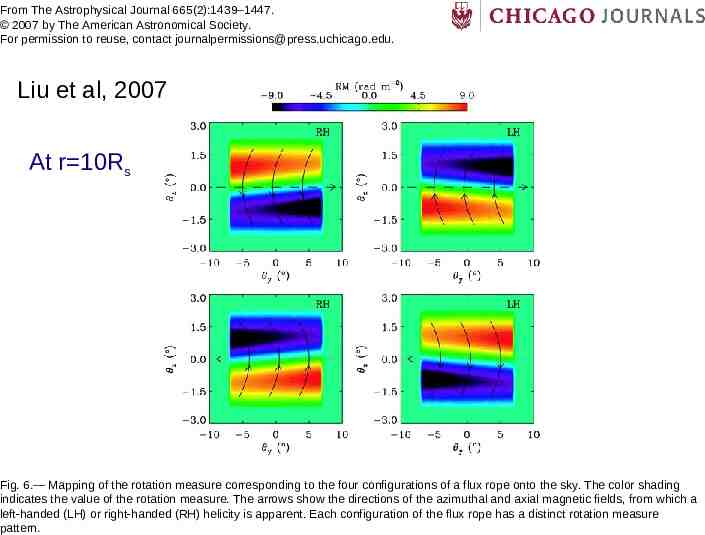
From The Astrophysical Journal 665(2):1439–1447. 2007 by The American Astronomical Society. For permission to reuse, contact [email protected]. Liu et al, 2007 At r 10Rs Fig. 6.— Mapping of the rotation measure corresponding to the four configurations of a flux rope onto the sky. The color shading indicates the value of the rotation measure. The arrows show the directions of the azimuthal and axial magnetic fields, from which a left-handed (LH) or right-handed (RH) helicity is apparent. Each configuration of the flux rope has a distinct rotation measure pattern.
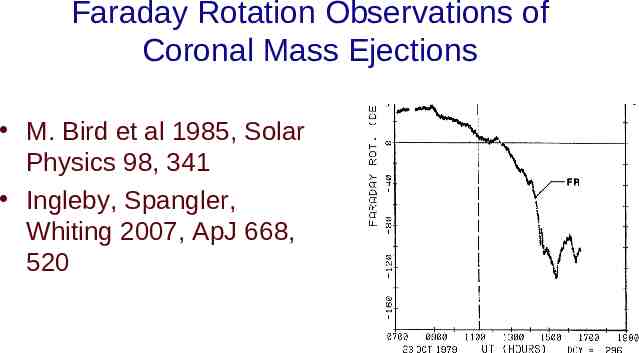
Faraday Rotation Observations of Coronal Mass Ejections M. Bird et al 1985, Solar Physics 98, 341 Ingleby, Spangler, Whiting 2007, ApJ 668, 520
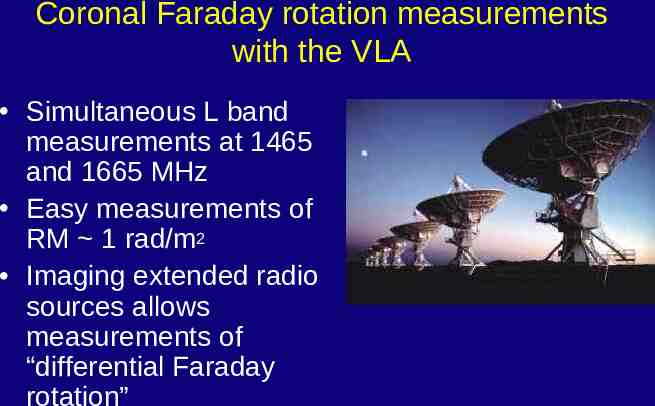
Coronal Faraday rotation measurements with the VLA Simultaneous L band measurements at 1465 and 1665 MHz Easy measurements of RM 1 rad/m2 Imaging extended radio sources allows measurements of “differential Faraday rotation”
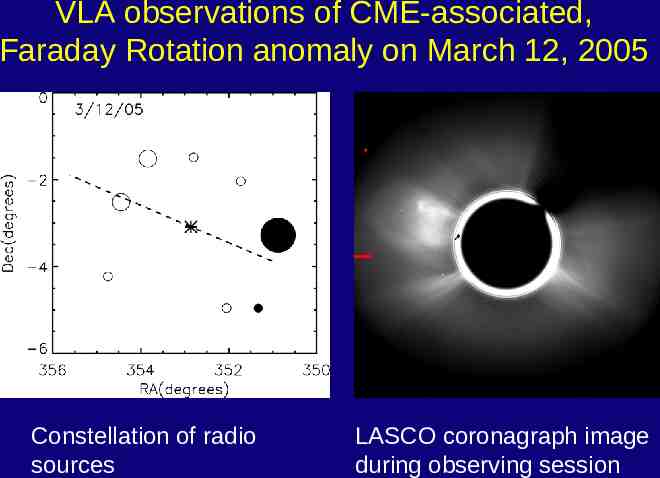
VLA observations of CME-associated, Faraday Rotation anomaly on March 12, 2005 Constellation of radio sources LASCO coronagraph image during observing session
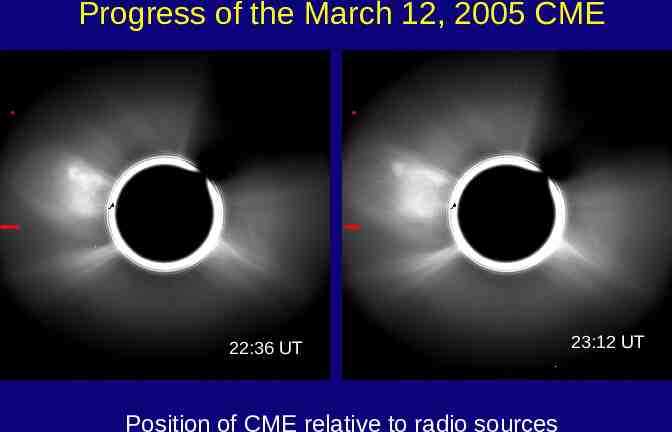
Progress of the March 12, 2005 CME 22:36 UT Position of CME relative to radio sources 23:12 UT
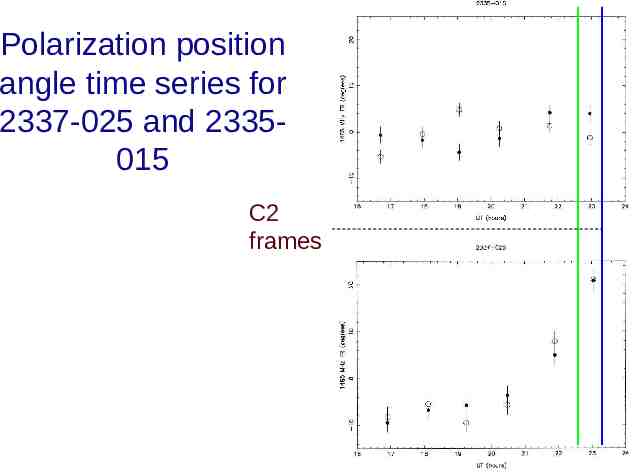
Polarization position angle time series for 2337-025 and 2335015 C2 frames
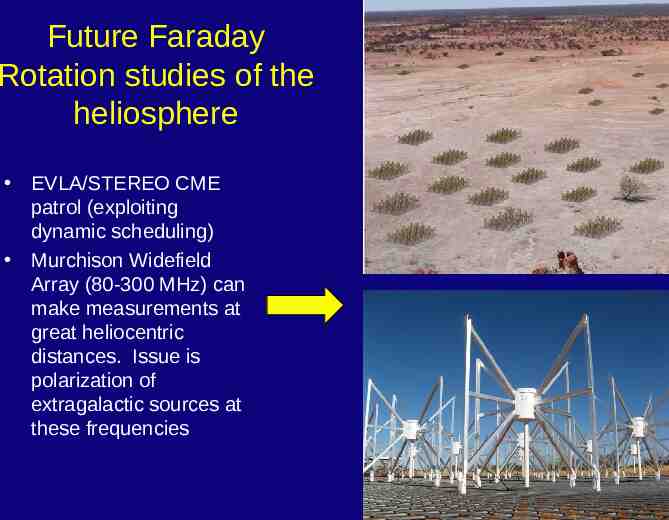
Future Faraday Rotation studies of the heliosphere EVLA/STEREO CME patrol (exploiting dynamic scheduling) Murchison Widefield Array (80-300 MHz) can make measurements at great heliocentric distances. Issue is polarization of extragalactic sources at these frequencies
Thanks for support Grant ATM03-54782