Presentation to Select Committee on Trade and International

75 Slides4.99 MB
Presentation to Select Committee on Trade and International Relations SA Tourism Final 5 Year Strategic Plan & Annual Performance Plan 2017 – 2021 28 June 2017
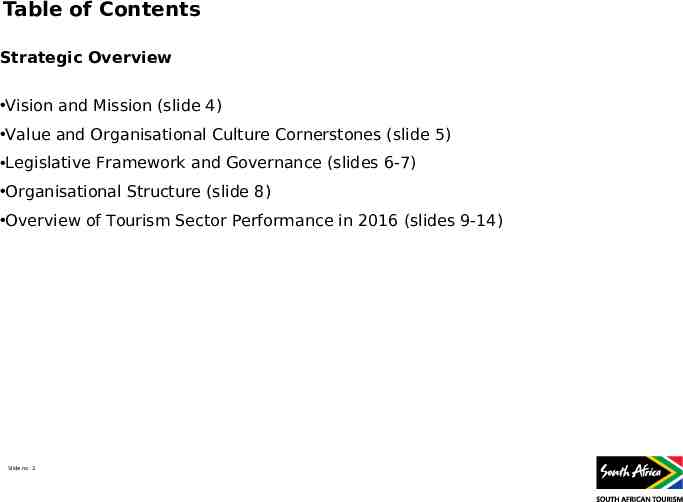
Table of Contents Strategic Overview Vision and Mission (slide 4) Value and Organisational Culture Cornerstones (slide 5) Legislative Framework and Governance (slides 6-7) Organisational Structure (slide 8) Overview of Tourism Sector Performance in 2016 (slides 9-14) Slide no. 2
Table of Contents SA Tourism Strategic Objectives Organisational Environment (slide 16) Funding (slide 17) Organisational Efficiency and Governance (slide 18) Strategic Planning Process (slides 19 – 20) Enhanced Strategy for Growth (slides 22 – 30) Strategic Goals and Objectives (slides 32 – 33) SA Tourism Programmes (slides 35 – 46) Annual Performance Targets (slides 47 – 53) Quarterly Performance Targets (slides 55 – 61) Revenue, Expenditure Estimates and Budgets (slides 63 – 67) Risk Management (slides 69 – 71) Abbreviations and acronyms (slides 72 – 73) Slide no. 3
Strategic Overview Slide no. 4
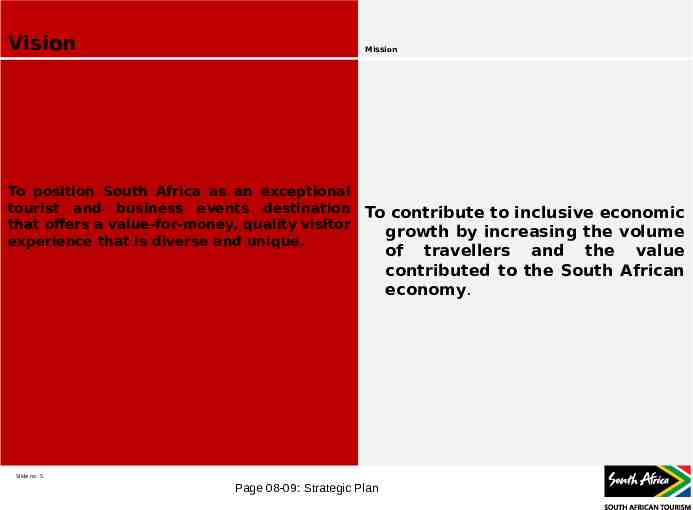
Vision Mission To position South Africa as an exceptional tourist and business events destination that offers a value-for-money, quality visitor experience that is diverse and unique. To contribute to inclusive economic growth by increasing the volume of travellers and the value contributed to the South African economy. Slide no. 5 Page 08-09: Strategic Plan
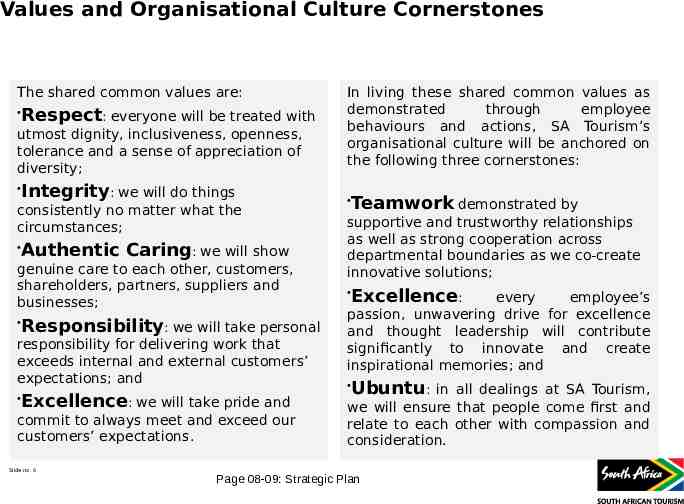
Values and Organisational Culture Cornerstones The shared common values are: Respect: everyone will be treated with utmost dignity, inclusiveness, openness, tolerance and a sense of appreciation of diversity; Integrity: we will do things consistently no matter what the circumstances; Authentic Caring: we will show genuine care to each other, customers, shareholders, partners, suppliers and businesses; Responsibility: we will take personal responsibility for delivering work that exceeds internal and external customers’ expectations; and Excellence: we will take pride and commit to always meet and exceed our customers’ expectations. Slide no. 6 In living these shared common values as demonstrated through employee behaviours and actions, SA Tourism’s organisational culture will be anchored on the following three cornerstones: Teamwork demonstrated by supportive and trustworthy relationships as well as strong cooperation across departmental boundaries as we co-create innovative solutions; Excellence: every employee’s passion, unwavering drive for excellence and thought leadership will contribute significantly to innovate and create inspirational memories; and Ubuntu: in all dealings at SA Tourism, we will ensure that people come first and relate to each other with compassion and consideration. Page 08-09: Strategic Plan
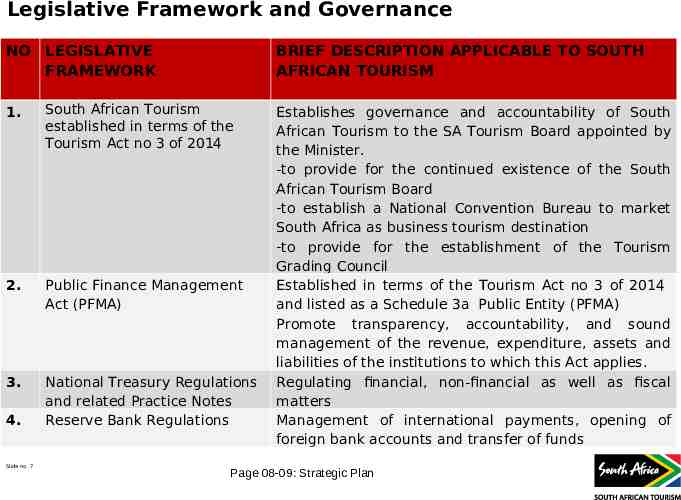
Legislative Framework and Governance NO LEGISLATIVE FRAMEWORK BRIEF DESCRIPTION APPLICABLE TO SOUTH AFRICAN TOURISM 1. South African Tourism established in terms of the Tourism Act no 3 of 2014 2. Public Finance Management Act (PFMA) 3. National Treasury Regulations and related Practice Notes Reserve Bank Regulations 4. Slide no. 7 Establishes governance and accountability of South African Tourism to the SA Tourism Board appointed by the Minister. -to provide for the continued existence of the South African Tourism Board -to establish a National Convention Bureau to market South Africa as business tourism destination -to provide for the establishment of the Tourism Grading Council Established in terms of the Tourism Act no 3 of 2014 and listed as a Schedule 3a Public Entity (PFMA) Promote transparency, accountability, and sound management of the revenue, expenditure, assets and liabilities of the institutions to which this Act applies. Regulating financial, non-financial as well as fiscal matters Management of international payments, opening of foreign bank accounts and transfer of funds Page 08-09: Strategic Plan
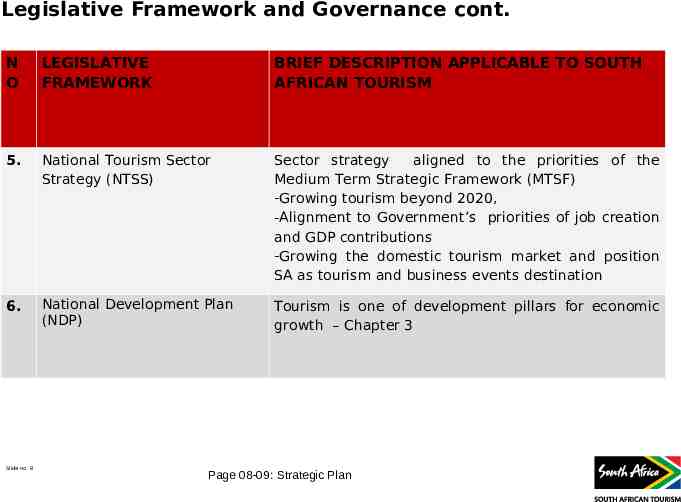
Legislative Framework and Governance cont. N O LEGISLATIVE FRAMEWORK BRIEF DESCRIPTION APPLICABLE TO SOUTH AFRICAN TOURISM 5. National Tourism Sector Strategy (NTSS) Sector strategy aligned to the priorities of the Medium Term Strategic Framework (MTSF) -Growing tourism beyond 2020, -Alignment to Government’s priorities of job creation and GDP contributions -Growing the domestic tourism market and position SA as tourism and business events destination 6. National Development Plan (NDP) Tourism is one of development pillars for economic growth – Chapter 3 Slide no. 8 Page 08-09: Strategic Plan
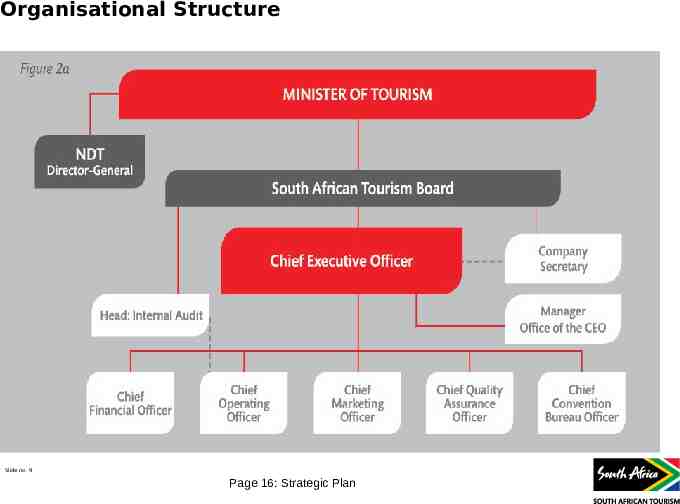
Organisational Structure Slide no. 9 Page 16: Strategic Plan
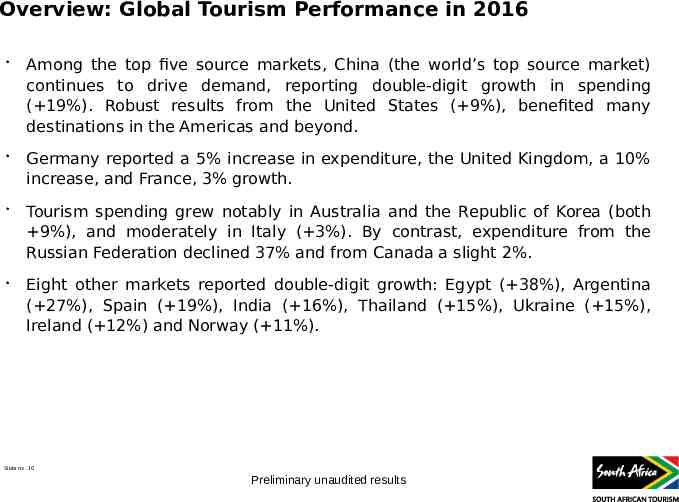
Overview: Global Tourism Performance in 2016 Among the top five source markets, China (the world’s top source market) continues to drive demand, reporting double-digit growth in spending ( 19%). Robust results from the United States ( 9%), benefited many destinations in the Americas and beyond. Germany reported a 5% increase in expenditure, the United Kingdom, a 10% increase, and France, 3% growth. Tourism spending grew notably in Australia and the Republic of Korea (both 9%), and moderately in Italy ( 3%). By contrast, expenditure from the Russian Federation declined 37% and from Canada a slight 2%. Eight other markets reported double-digit growth: Egypt ( 38%), Argentina ( 27%), Spain ( 19%), India ( 16%), Thailand ( 15%), Ukraine ( 15%), Ireland ( 12%) and Norway ( 11%). Slide no. 10 Preliminary unaudited results
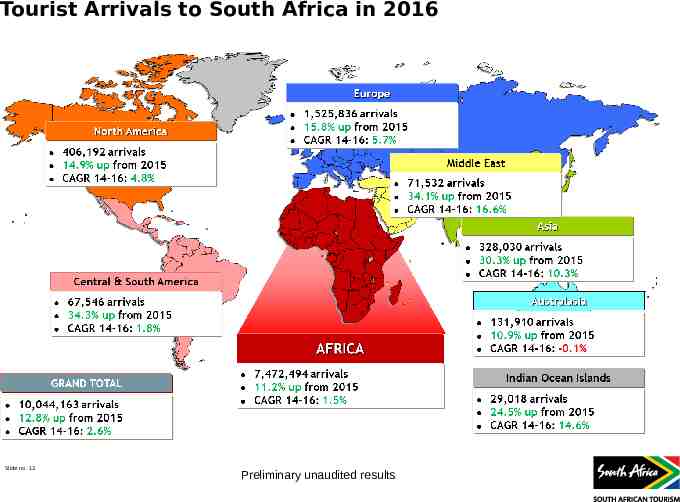
Overview: South African Tourism Performance in 2016 Foreign arrivals accounted for 10 million of total tourism trips and increased by 12.8% compared to 2015. Africa is our biggest source region followed by Europe and North America. The fastest growing regions were Central & South America (34.3%), Middle East (34.1%) and Asia (30.3%). All the regions have grown to new record highs, the only exception being Australasia which is slightly behind 2014. The main driver of the double digit increase in foreign trips was tourists visiting for leisure. MICE tourists remained relatively stable while business shopping saw a decline (-10.6%) and business travellers (corporate travel) saw 63.2% growth (small base) Slide no. 11 Preliminary unaudited results
Tourist Arrivals to South Africa in 2016 Slide no. 12 Preliminary unaudited results
Overview: Domestic Tourism Domestic tourism accounted for 24.3 million of the tourism trips, a decrease of -0.7% compared to the 24.5 million trips taken in 2015. The decrease in total trips was largely driven by a decrease in trips taken for the purpose of visiting friends and relatives and for holiday while business grew by 22%. The increase in average length of stay to 4.3 nights led to the domestic bednights growing despite the fewer tourist trips in this year. As in previous years, affordability remained the main deterrent to taking a trip. Domestic tourist’s revenue increased by 12% to record R26.5 billion in 2016 compared to R23.6 billion in 2015. The domestic tourist who took a trip in this period spent more per trip and per day than last year, growth of 13% and 11% respectively. Slide no. 13 Preliminary unaudited results
Overview: Business Events The South African business events industry has been growing steadily over the last 10 years, contributing towards the country’s tourist arrivals. This growth comes from industrial sectors where South Africa is a thought leader and/or shows potential for growth. South Africa was ranked 38th globally in 2015 and was listed in the top 15 long-haul business events destinations, cementing the country’s status as the number one ranked business events destination in Africa and the Middle East. Networking opportunities afford local delegates with new business and research collaborations, which can generate innovation, ideas and research agendas for many years to come. Globally, safety remains an important consideration, and economic and political instability is also a key concern. For incentive travel millennials and younger employees often seek exotic and cultural adventures. They are also motivated by doing good. Slide no. 14 Page 14-15: Strategic Plan
Overview: Tourism Grading Despite the growing trends such as Airbnb and Uber as well as the influence of online platforms such as TripAdvisor, quality assurance remains important to determine the standard of service level, certainty and reliability. Recent market insights and trends show an increase in online usergenerated consumer reviews. These put pressure on product owners to ensure service excellence and high-quality tourism offerings. A number of surveys show that graded establishments experience improved perceptions of value from customers, based on their participation in grading systems. The number of graded accommodation and rooms in South Africa is just over 5 000 and 114 000 respectively, 85% being non-hotel establishments and 15% being large hotel chains and facilities for meetings, exhibitions and special events. The large hotel groups and conference facilities account for 50% and the remainder by SMMEs. Slide no. 15 Page 15-16: Strategic Plan
SA Tourism Strategic Objectives Slide no. 16
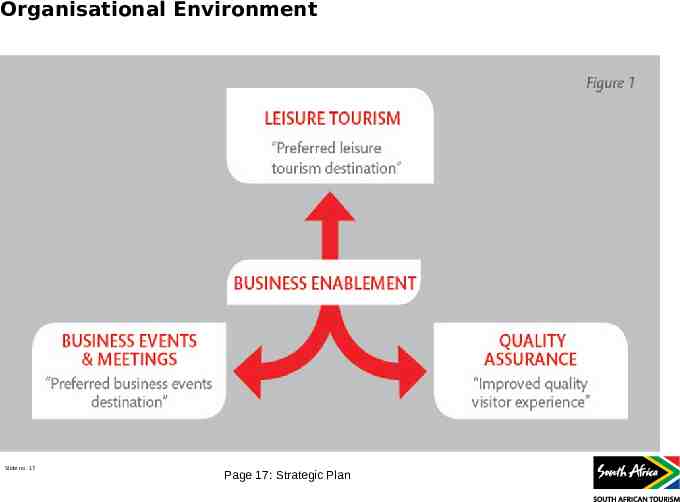
Organisational Environment Slide no. 17 Page 17: Strategic Plan
Funding South African Tourism receives approximately 90% of its annual budget from government grants and subsidies, and 10% from the private sector – via the TOMSA levy allocated through the Tourism Business Council of South Africa (TBCSA). South African Tourism delivers its mandate through collaborative funding and joint marketing investment, harnessed from private and public sector partners. Slide no. 18 Page 17: Strategic Plan
Organisational Efficiency and Governance South African Tourism recently embarked on a review of its performance and the prevailing operating environment, in a bid to enhance its growth strategy. The review included interviews with key stakeholders from government and the tourism industry. The extensive canvassing process resulted in a number of principles being identified for South African Tourism to implement internally to enable the organisation to improve its efficiencies and have an optimal impact on the industry: Mapping and streamlining business processes and systems to improve operational efficiency; - Reviewing policies to improve agility and operational efficiency; and Reviewing and designing an organisational structure to support South African Tourism’s new five-year strategy. Slide no. 19 Page 17-18: Strategic Plan
Strategic Planning Process South African Tourism revised its Tourism Growth Strategy (2002) in order to achieve five million additional tourists in five years (4 million international tourist arrivals and 1 million domestic holiday trips). The enhanced strategy for growth is an update to the 2002 Tourism Growth Strategy (TGS), which mapped out source markets that will deliver international tourist arrivals and domestic tourist as well as the strategy to achieve the set goals. The Marketing Investment Framework (MIF) has been concluded in consultation with the stakeholders and will guide where South African Tourism should invest its marketing budget for optimal return on investment (in terms of tourist numbers and tourist spend) for the next five years. Slide no. 20 Page 18-19: Strategic Plan
Strategic Planning Process SA Tourism drafted its Strategic Plan and Annual Performance Plan (APP) in line with the National Treasury’s framework. In the drafting of the Strategic Plan and APP inputs were considered from: - SA Tourism Wider Management; - SA Tourism Board; - NDT and the Minister of Tourism; Africa; Tourism Industry through the Tourism Business Council of South Insights from the Enhanced Strategy for Growth and Marketing Investment Framework; set Slide no. 21 Final allocation letter and budget allocation, which has been used to targets.
Enhanced Strategy for Growth “5-in-5” Slide no. 22
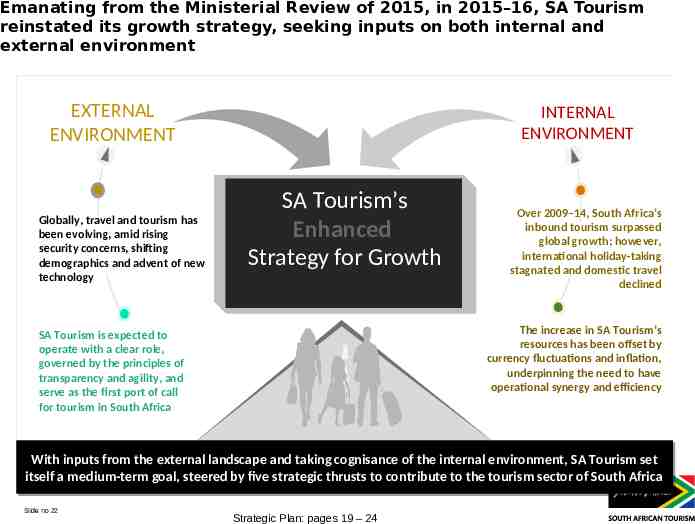
Emanating from the Ministerial Review of 2015, in 2015–16, SA Tourism reinstated its growth strategy, seeking inputs on both internal and external environment EXTERNAL ENVIRONMENT Globally, travel and tourism has been evolving, amid rising security concerns, shifting demographics and advent of new technology INTERNAL ENVIRONMENT SA Tourism’s Enhanced Strategy for Growth Over 2009–14, South Africa’s inbound tourism surpassed global growth; however, international holiday-taking stagnated and domestic travel declined The increase in SA Tourism’s resources has been offset by currency fluctuations and inflation, underpinning the need to have operational synergy and efficiency SA Tourism is expected to operate with a clear role, governed by the principles of transparency and agility, and serve as the first port of call for tourism in South Africa With With inputs inputs from from the the external external landscape landscape and and taking taking cognisance cognisance of of the the internal internal environment, environment, SA SA Tourism Tourism set set itself itself aa medium-term medium-term goal, goal, steered steered by by five five strategic strategic thrusts thrusts to to contribute contribute to to the the tourism tourism sector sector of of South South Africa Africa Slide no. 23 Slide no 22 Strategic Plan: pages 19 – 24
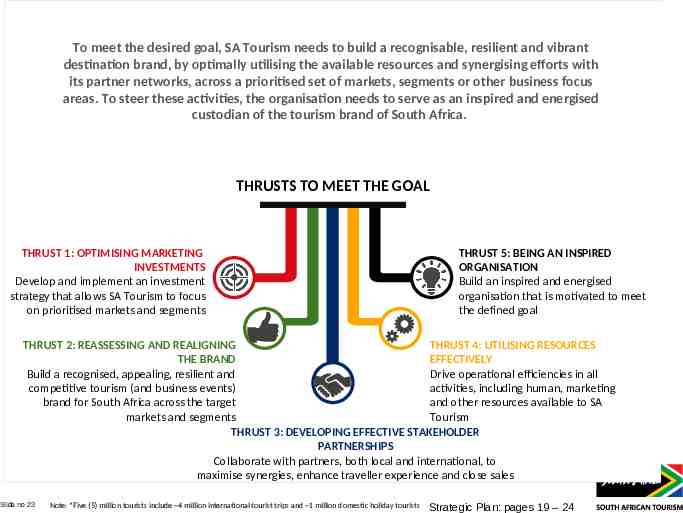
To meet the desired goal, SA Tourism needs to build a recognisable, resilient and vibrant destination brand, by optimally utilising the available resources and synergising efforts with its partner networks, across a prioritised set of markets, segments or other business focus areas. To steer these activities, the organisation needs to serve as an inspired and energised custodian of the tourism brand of South Africa. THRUSTS TO MEET THE GOAL THRUST 1: OPTIMISING MARKETING INVESTMENTS Develop and implement an investment strategy that allows SA Tourism to focus on prioritised markets and segments THRUST 5: BEING AN INSPIRED ORGANISATION Build an inspired and energised organisation that is motivated to meet the defined goal THRUST 2: REASSESSING AND REALIGNING THRUST 4: UTILISING RESOURCES THE BRAND EFFECTIVELY Build a recognised, appealing, resilient and Drive operational efficiencies in all competitive tourism (and business events) activities, including human, marketing brand for South Africa across the target and other resources available to SA markets and segments Tourism THRUST 3: DEVELOPING EFFECTIVE STAKEHOLDER PARTNERSHIPS Collaborate with partners, both local and international, to Slide no. 24 maximise synergies, enhance traveller experience and close sales Slide no 23 Note: *Five (5) million tourists include 4 million international tourist trips and 1 million domestic holiday tourists Strategic Plan: pages 19 – 24
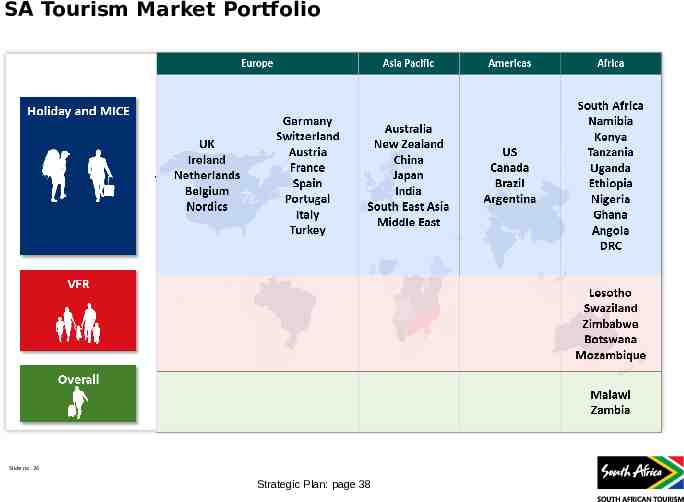
Thrust 1: Optimising Marketing Investments SA Tourism has developed a Marketing Investment Framework (MIF) to inform its investment choices for the next five years. The framework took into account the macroeconomic situation in South Africa, the depreciating rand and the fact that SA Tourism marketing spend in overseas markets is in foreign currency. A number of markets have been identified to deliver optimal return on investment. This list of markets has been prioritised based on the attractiveness of each market and South Africa’s “ability to win” in each market. As SA Tourism has limited resources, it has prioritised its markets using a tiered approach: the SA Tier one: core markets; Tier two: strategic markets; and Tier three: the rest of the world (services through partnership with Missions) Slide no. 25 Strategic Plan: pages 21-22
SA Tourism Market Portfolio Slide no. 26 Strategic Plan: page 38
Thrust 2: Reassessing And Realigning The Brand Increased brand awareness and improved positivity improves travellers intention to visit South Africa and closure ratios. The key focus areas of this thrust is to: Review brand performance to develop a detailed understanding of South Africa’s brand journey and identify the levers that can be pulled to grow the brand; within Build knowledge and understanding of SA Tourism’s Brand Key – both the organisation and across the external network; Build a global communication plan for the South Africa’s brand that is to be implemented by all stakeholders to improve consistency and impact of our brand message. SA Tourism will also focus on supporting Brand SA’s reputation management strategy. Slide no. 27 Strategic Plan: page 23
Thrust 3: Developing Effective Stakeholder Partnerships SA Tourism does not own the entire value chain in the marketing, promotion and selling of South Africa as a tourist destination. In the next five years, South African Tourism will, in collaboration with partners, embark on the following: Trade mapping: Complete a detailed review of the travel trade landscape; - Partner engagement matrix: Create a trade engagement framework that will set out an all-encompassing approach for partnerships; Partner engagement: Proactively engage with international and domestic trade, media, influencers and related partners to improve conversion and address seasonality and geographic spread. to the Enhanced brand knowledge and familiarity: Expose targeted partners South Africa brand to enable them to inspire tourists and close deals; Slide no. 28 Strategic Plan: pages 23
Thrust 3: Developing Effective Stakeholder Partnerships Provide access to stakeholders, (both internal and external) to all appropriate marketing collateral, images and market insights in an easy, open source manner; - and African Work together with key partners such as provincial tourism authorities cities, Brand South Africa, Proudly South Africa and Department of International Relations and Cooperation (DIRCO), to build the South brand in a cohesive, consistent manner; and Monitor partnership successes: Evaluate the effectiveness of trade partnerships to determine return on investment. Slide no. 29 Strategic Plan: pages 23
Thrust 4: Utilising Resources Effectively SA Tourism is working towards optimising the utilisation of the existing resources and streamlining its underlying processes. This thrust will allow South African Tourism to bring in operational efficiency through all processes of the organisation. The key areas of this thrust is to: Review policies, map and streamline business processes and relevant systems to improve agility and operational efficiency. Review and design organisational structure through Project Ignite to ensure achievement of the 5-in-5 goal. The emphasis of the project was to remove silo operations and to drive a performance-based culture. Slide no. 30 Strategic Plan: page 24
Thrust 5: Being An Inspired Organisation In order for the organisation to meet its 5-in-5 targets is important that all actions of SA Tourism and its employees are aimed towards meeting the defined goal. All parts – from business units to individuals – of the organisation need to clearly know their role in meeting the defined goal. The key areas of this thrust is to: capital Implement the Human Capital Strategy that will ensure human competitiveness. Develop strong, inspiring and effective leaders with the vision and energy to deliver on the SA Tourism objectives. ensure Improve organisational development and business effectiveness to delivery of our business objectives. Build and nurture talent within the organisation to achieve the organisation’s goal. to Slide no. 31 Reignite passion among all employees by changing the culture within contribute to achieving the goal. Strategic Plan: page 24
Strategic - Oriented Goals Slide no 31
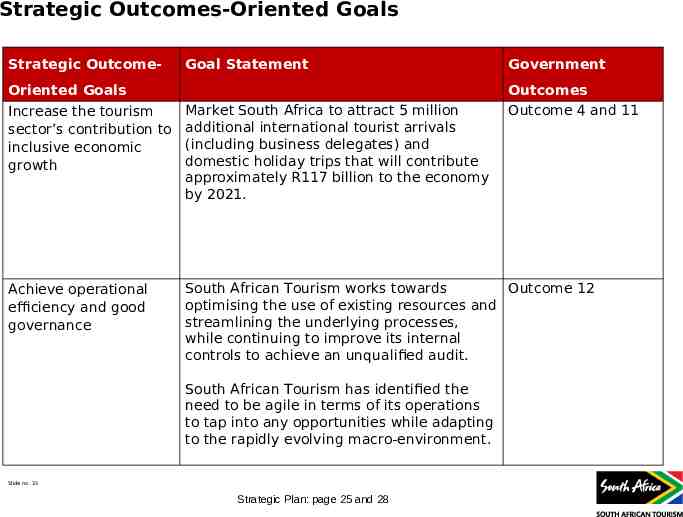
Strategic Outcomes-Oriented Goals Strategic Outcome- Goal Statement Oriented Goals Government Outcomes Outcome 4 and 11 Increase the tourism sector’s contribution to inclusive economic growth Market South Africa to attract 5 million additional international tourist arrivals (including business delegates) and domestic holiday trips that will contribute approximately R117 billion to the economy by 2021. Achieve operational efficiency and good governance South African Tourism works towards Outcome 12 optimising the use of existing resources and streamlining the underlying processes, while continuing to improve its internal controls to achieve an unqualified audit. South African Tourism has identified the need to be agile in terms of its operations to tap into any opportunities while adapting to the rapidly evolving macro-environment. Slide no. 33 Strategic Plan: page 25 and 28
Organisational Strategic Objectives Strategic Strategic Objectives Programmes SO1: To contribute to inclusive economic growth by increasing the number of international and domestic tourists SO2: To contribute to an enhanced, recognised, appealing, resilient and competitive tourism and business events brand for South Africa across the target markets and segments Programme 3 & 4 OutcomeOriented Goals Increase the tourism sector’s contribution to inclusive economic growth SO3: To enhance stakeholder and partnership collaboration, both local and international, to better deliver on SA Tourism’s mandate SO4: To contribute to an improved tourist experience in line with the brand promise Achieve operational efficiency and good governance Slide no. 34 SO5: To position SA Tourism’s corporate brand to be recognised as a tourism and business events industry leader in market intelligence, insights and analytics SO6: To achieve operational efficiencies in all activities, including human, marketing and other resources available to SA Tourism Strategic Plan: pages 25-28 Programme 3 & 4 Programme 2 Programme 5 Programme 2 Programme 1
SA Tourism Programmes Slide no 34
SA Tourism Programmes Programme 1 - Corporate Support Programme 2 - Business Enablement Programme 3 - Leisure Tourism Marketing Programme 4 - Business Events Programme 5 - Visitor Experience Slide no. 36
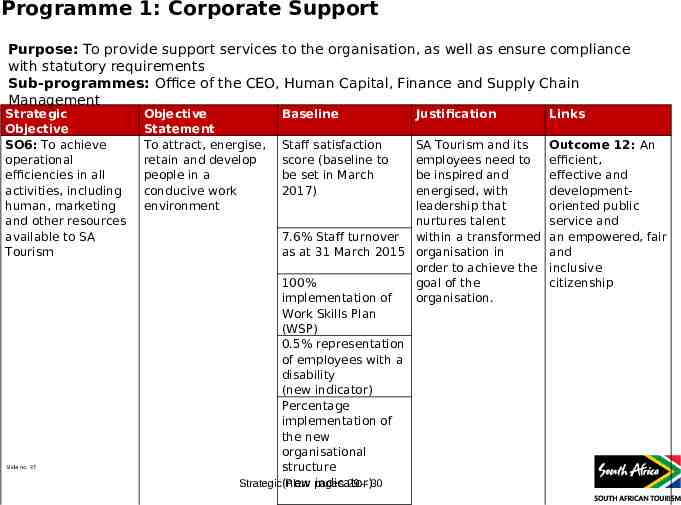
Programme 1: Corporate Support Purpose: To provide support services to the organisation, as well as ensure compliance with statutory requirements Sub-programmes: Office of the CEO, Human Capital, Finance and Supply Chain Management Strategic Objective SO6: To achieve operational efficiencies in all activities, including human, marketing and other resources available to SA Tourism Slide no. 37 Objective Statement To attract, energise, retain and develop people in a conducive work environment Baseline Staff satisfaction score (baseline to be set in March 2017) Justification SA Tourism and its employees need to be inspired and energised, with leadership that nurtures talent 7.6% Staff turnover within a transformed as at 31 March 2015 organisation in order to achieve the 100% goal of the implementation of organisation. Work Skills Plan (WSP) 0.5% representation of employees with a disability (new indicator) Percentage implementation of the new organisational structure indicator) Strategic(new Plan: pages 29 – 30 Links Outcome 12: An efficient, effective and developmentoriented public service and an empowered, fair and inclusive citizenship
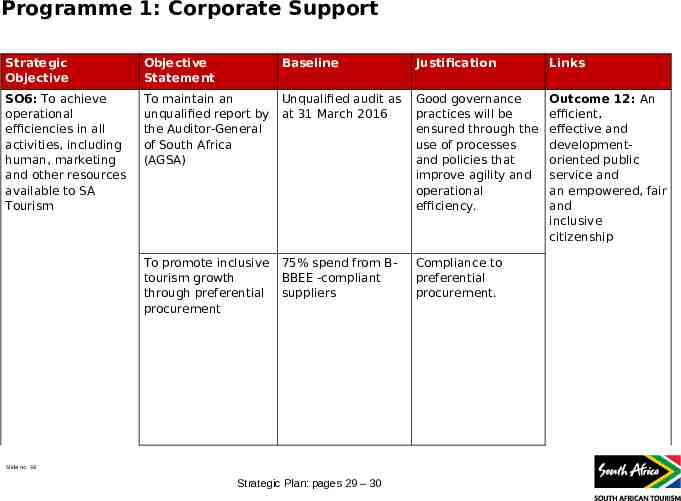
Programme 1: Corporate Support Strategic Objective Objective Statement Baseline Justification Links SO6: To achieve operational efficiencies in all activities, including human, marketing and other resources available to SA Tourism To maintain an unqualified report by the Auditor-General of South Africa (AGSA) Unqualified audit as at 31 March 2016 Good governance practices will be ensured through the use of processes and policies that improve agility and operational efficiency. Outcome 12: An efficient, effective and developmentoriented public service and an empowered, fair and inclusive citizenship To promote inclusive tourism growth through preferential procurement 75% spend from BBBEE -compliant suppliers Compliance to preferential procurement. Slide no. 38 Strategic Plan: pages 29 – 30
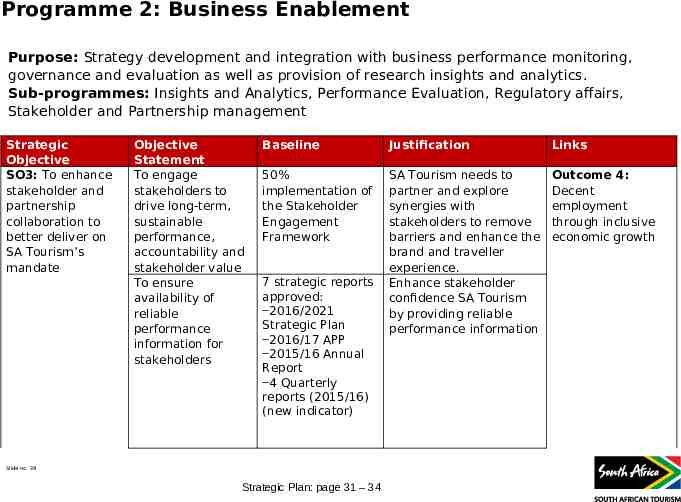
Programme 2: Business Enablement Purpose: Strategy development and integration with business performance monitoring, governance and evaluation as well as provision of research insights and analytics. Sub-programmes: Insights and Analytics, Performance Evaluation, Regulatory affairs, Stakeholder and Partnership management Strategic Objective SO3: To enhance stakeholder and partnership collaboration to better deliver on SA Tourism’s mandate Objective Statement To engage stakeholders to drive long-term, sustainable performance, accountability and stakeholder value To ensure availability of reliable performance information for stakeholders Baseline Justification Links 50% implementation of the Stakeholder Engagement Framework SA Tourism needs to partner and explore synergies with stakeholders to remove barriers and enhance the brand and traveller experience. Enhance stakeholder confidence SA Tourism by providing reliable performance information Outcome 4: Decent employment through inclusive economic growth 7 strategic reports approved: ‒2016/2021 Strategic Plan ‒2016/17 APP ‒2015/16 Annual Report ‒4 Quarterly reports (2015/16) (new indicator) Slide no. 39 Strategic Plan: page 31 – 34
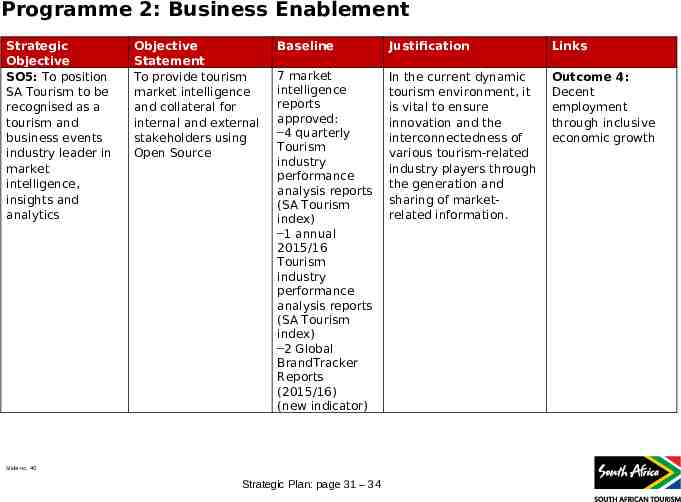
Programme 2: Business Enablement Strategic Objective SO5: To position SA Tourism to be recognised as a tourism and business events industry leader in market intelligence, insights and analytics Objective Statement To provide tourism market intelligence and collateral for internal and external stakeholders using Open Source Baseline Justification Links 7 market intelligence reports approved: ‒4 quarterly Tourism industry performance analysis reports (SA Tourism index) ‒1 annual 2015/16 Tourism industry performance analysis reports (SA Tourism index) ‒2 Global BrandTracker Reports (2015/16) (new indicator) In the current dynamic tourism environment, it is vital to ensure innovation and the interconnectedness of various tourism-related industry players through the generation and sharing of marketrelated information. Outcome 4: Decent employment through inclusive economic growth Slide no. 40 Strategic Plan: page 31 – 34
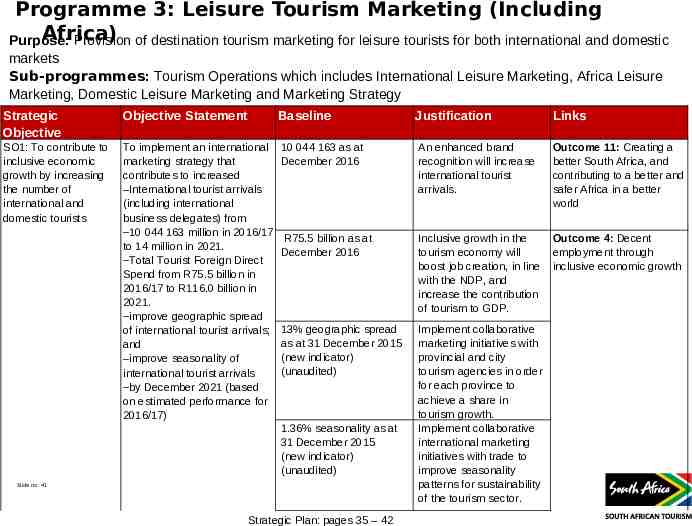
Programme 3: Leisure Tourism Marketing (Including Africa) Purpose: Provision of destination tourism marketing for leisure tourists for both international and domestic markets Sub-programmes: Tourism Operations which includes International Leisure Marketing, Africa Leisure Marketing, Domestic Leisure Marketing and Marketing Strategy Strategic Objective Objective Statement Baseline Justification Links SO1: To contribute to inclusive economic growth by increasing the number of international and domestic tourists To implement an international marketing strategy that contributes to increased ‒International tourist arrivals (including international business delegates) from ‒10 044 163 million in 2016/17 to 14 million in 2021. ‒Total Tourist Foreign Direct Spend from R75.5 billion in 2016/17 to R116.0 billion in 2021. ‒improve geographic spread of international tourist arrivals; and ‒improve seasonality of international tourist arrivals ‒by December 2021 (based on estimated performance for 2016/17) 10 044 163 as at December 2016 An enhanced brand recognition will increase international tourist arrivals. Outcome 11: Creating a better South Africa, and contributing to a better and safer Africa in a better world R75.5 billion as at December 2016 Inclusive growth in the tourism economy will boost job creation, in line with the NDP, and increase the contribution of tourism to GDP. Outcome 4: Decent employment through inclusive economic growth 13% geographic spread as at 31 December 2015 (new indicator) (unaudited) Implement collaborative marketing initiatives with provincial and city tourism agencies in order for each province to achieve a share in tourism growth. Implement collaborative international marketing initiatives with trade to improve seasonality patterns for sustainability of the tourism sector. 1.36% seasonality as at 31 December 2015 (new indicator) (unaudited) Slide no. 41 Strategic Plan: pages 35 – 42
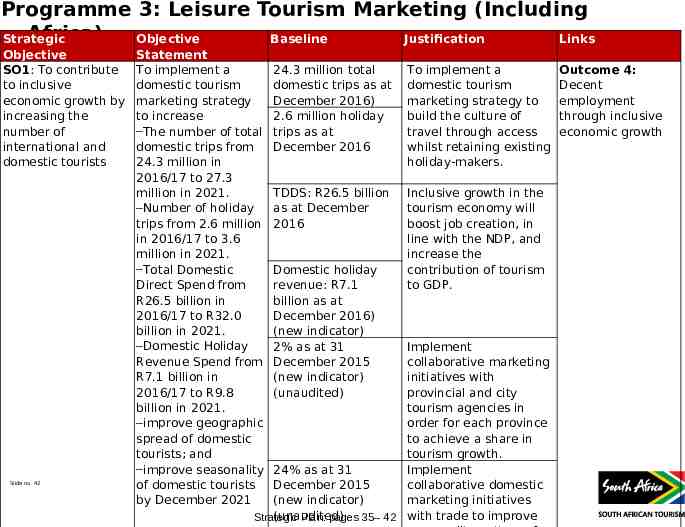
Programme 3: Leisure Tourism Marketing (Including Africa) Strategic Objective Baseline Justification Links Objective SO1: To contribute to inclusive economic growth by increasing the number of international and domestic tourists Slide no. 42 Statement To implement a domestic tourism marketing strategy to increase ‒The number of total domestic trips from 24.3 million in 2016/17 to 27.3 million in 2021. ‒Number of holiday trips from 2.6 million in 2016/17 to 3.6 million in 2021. ‒Total Domestic Direct Spend from R26.5 billion in 2016/17 to R32.0 billion in 2021. ‒Domestic Holiday Revenue Spend from R7.1 billion in 2016/17 to R9.8 billion in 2021. ‒improve geographic spread of domestic tourists; and ‒improve seasonality of domestic tourists by December 2021 24.3 million total domestic trips as at December 2016) 2.6 million holiday trips as at December 2016 To implement a domestic tourism marketing strategy to build the culture of travel through access whilst retaining existing holiday-makers. TDDS: R26.5 billion as at December 2016 Inclusive growth in the tourism economy will boost job creation, in line with the NDP, and increase the contribution of tourism to GDP. Domestic holiday revenue: R7.1 billion as at December 2016) (new indicator) 2% as at 31 December 2015 (new indicator) (unaudited) Implement collaborative marketing initiatives with provincial and city tourism agencies in order for each province to achieve a share in tourism growth. 24% as at 31 Implement December 2015 collaborative domestic (new indicator) marketing initiatives (unaudited) Strategic Plan: pages 35– 42 with trade to improve Outcome 4: Decent employment through inclusive economic growth
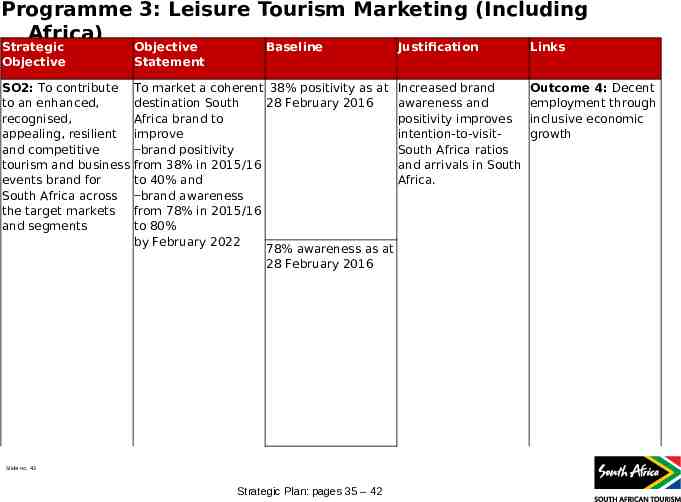
Programme 3: Leisure Tourism Marketing (Including Africa) Strategic Objective Objective Statement Baseline SO2: To contribute to an enhanced, recognised, appealing, resilient and competitive tourism and business events brand for South Africa across the target markets and segments To market a coherent 38% positivity as at destination South 28 February 2016 Africa brand to improve ‒brand positivity from 38% in 2015/16 to 40% and ‒brand awareness from 78% in 2015/16 to 80% by February 2022 78% awareness as at 28 February 2016 Slide no. 43 Strategic Plan: pages 35 – 42 Justification Links Increased brand awareness and positivity improves intention-to-visitSouth Africa ratios and arrivals in South Africa. Outcome 4: Decent employment through inclusive economic growth
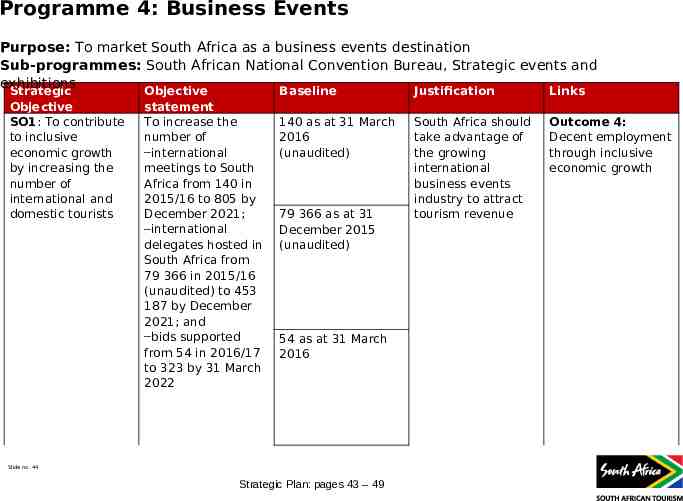
Programme 4: Business Events Purpose: To market South Africa as a business events destination Sub-programmes: South African National Convention Bureau, Strategic events and exhibitions Strategic Objective SO1: To contribute to inclusive economic growth by increasing the number of international and domestic tourists Objective statement To increase the number of ‒international meetings to South Africa from 140 in 2015/16 to 805 by December 2021; ‒international delegates hosted in South Africa from 79 366 in 2015/16 (unaudited) to 453 187 by December 2021; and ‒bids supported from 54 in 2016/17 to 323 by 31 March 2022 Baseline Justification Links 140 as at 31 March 2016 (unaudited) South Africa should take advantage of the growing international business events industry to attract tourism revenue Outcome 4: Decent employment through inclusive economic growth 79 366 as at 31 December 2015 (unaudited) 54 as at 31 March 2016 Slide no. 44 Strategic Plan: pages 43 – 49
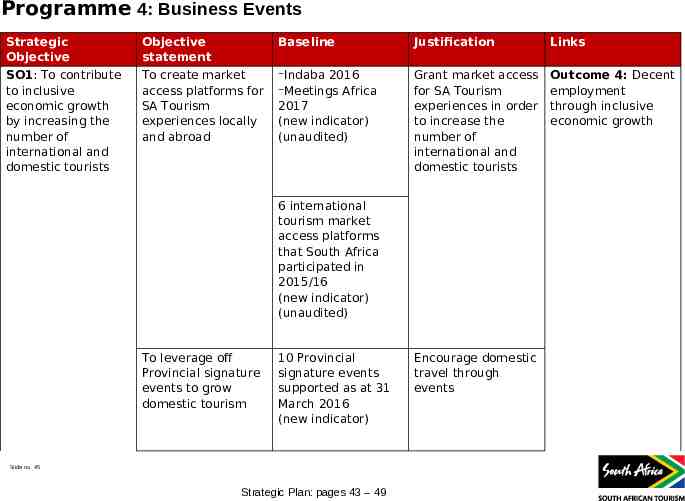
Programme 4: Business Events Strategic Objective Objective statement Baseline Justification Links SO1: To contribute to inclusive economic growth by increasing the number of international and domestic tourists To create market access platforms for SA Tourism experiences locally and abroad ‒Indaba 2016 ‒Meetings Africa 2017 (new indicator) (unaudited) Grant market access for SA Tourism experiences in order to increase the number of international and domestic tourists Outcome 4: Decent employment through inclusive economic growth 6 international tourism market access platforms that South Africa participated in 2015/16 (new indicator) (unaudited) To leverage off Provincial signature events to grow domestic tourism 10 Provincial signature events supported as at 31 March 2016 (new indicator) Slide no. 45 Strategic Plan: pages 43 – 49 Encourage domestic travel through events
Programme 4: Business Events Capacitating smaller towns and Metros: The current SANCB business event financial support model contains a financial incentive for organisers to host conferences and incentives outside of the main metro’s. This support model is being further revised to ensure that the criteria used takes into consideration the venue capacities and logistics around secondary cities and metros. The role of the city and provincial convention bureaus is also to specifically target conferences and incentives to secondary metros and towns in their regions, and this is encouraged through regular engagements with the SANCB through the BECF (Business Events Co-Ordinating Forum). At all Trade Show interactions with international clients, secondary metros and cities are promoted as alternatives to mainstream cities. Slide no. 46
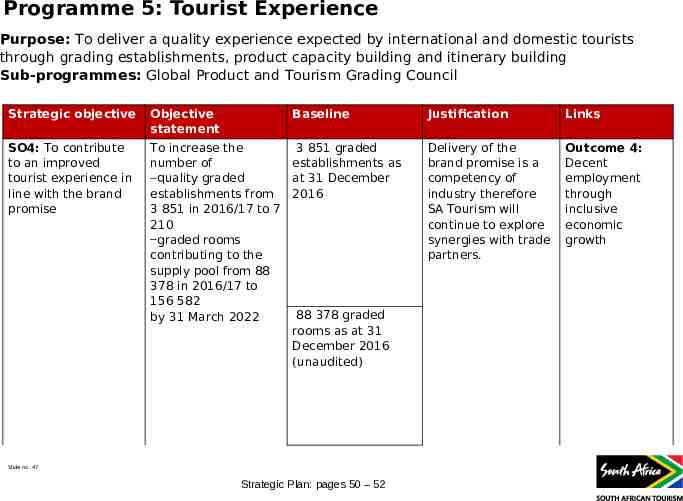
Programme 5: Tourist Experience Purpose: To deliver a quality experience expected by international and domestic tourists through grading establishments, product capacity building and itinerary building Sub-programmes: Global Product and Tourism Grading Council Strategic objective Objective statement Baseline SO4: To contribute to an improved tourist experience in line with the brand promise To increase the 3 851 graded number of establishments as ‒quality graded at 31 December establishments from 2016 3 851 in 2016/17 to 7 210 ‒graded rooms contributing to the supply pool from 88 378 in 2016/17 to 156 582 88 378 graded by 31 March 2022 rooms as at 31 December 2016 (unaudited) Slide no. 47 Strategic Plan: pages 50 – 52 Justification Links Delivery of the brand promise is a competency of industry therefore SA Tourism will continue to explore synergies with trade partners. Outcome 4: Decent employment through inclusive economic growth
Annual Performance Targets Slide no 47
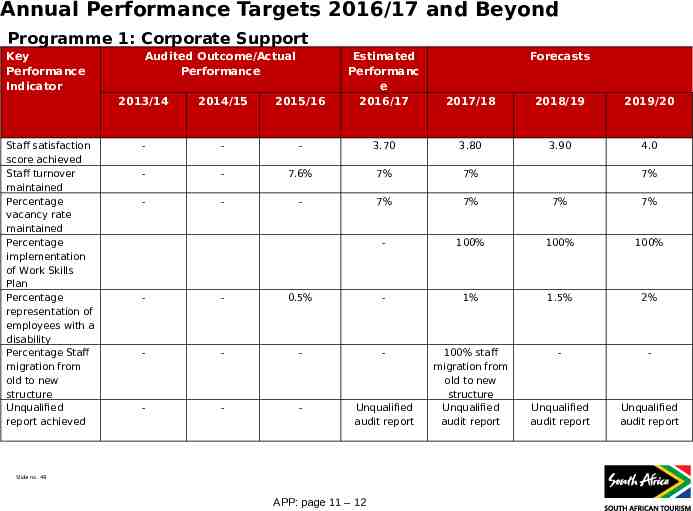
Annual Performance Targets 2016/17 and Beyond Programme 1: Corporate Support Key Performance Indicator Staff satisfaction score achieved Staff turnover maintained Percentage vacancy rate maintained Percentage implementation of Work Skills Plan Percentage representation of employees with a disability Percentage Staff migration from old to new structure Unqualified report achieved Audited Outcome/Actual Performance 2013/14 2014/15 2015/16 Estimated Performanc e 2016/17 Forecasts - - - 3.70 3.80 - - 7.6% 7% 7% - - - 7% 7% 7% 7% - 100% 100% 100% 2017/18 2018/19 2019/20 3.90 4.0 7% - - 0.5% - 1% 1.5% 2% - - - - - - - - - Unqualified audit report 100% staff migration from old to new structure Unqualified audit report Unqualified audit report Unqualified audit report Slide no. 49 APP: page 11 – 12
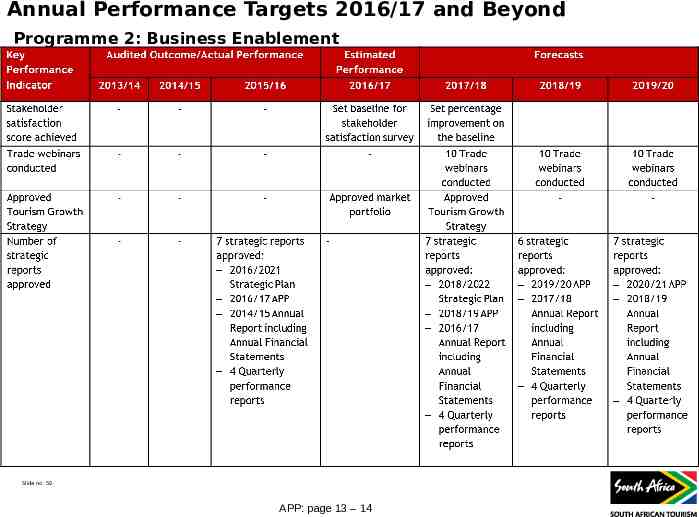
Annual Performance Targets 2016/17 and Beyond Programme 2: Business Enablement Slide no. 50 APP: page 13 – 14
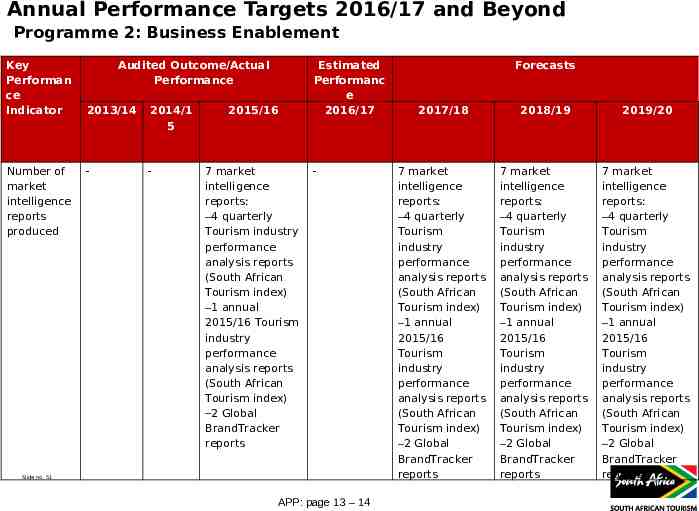
Annual Performance Targets 2016/17 and Beyond Programme 2: Business Enablement Key Performan ce Indicator Number of market intelligence reports produced Audited Outcome/Actual Performance 2013/14 2014/1 5 - - 2015/16 7 market intelligence reports: ‒4 quarterly Tourism industry performance analysis reports (South African Tourism index) ‒1 annual 2015/16 Tourism industry performance analysis reports (South African Tourism index) ‒2 Global BrandTracker reports Estimated Performanc e 2016/17 - Slide no. 51 APP: page 13 – 14 Forecasts 2017/18 2018/19 2019/20 7 market intelligence reports: ‒4 quarterly Tourism industry performance analysis reports (South African Tourism index) ‒1 annual 2015/16 Tourism industry performance analysis reports (South African Tourism index) ‒2 Global BrandTracker reports 7 market intelligence reports: ‒4 quarterly Tourism industry performance analysis reports (South African Tourism index) ‒1 annual 2015/16 Tourism industry performance analysis reports (South African Tourism index) ‒2 Global BrandTracker reports 7 market intelligence reports: ‒4 quarterly Tourism industry performance analysis reports (South African Tourism index) ‒1 annual 2015/16 Tourism industry performance analysis reports (South African Tourism index) ‒2 Global BrandTracker reports
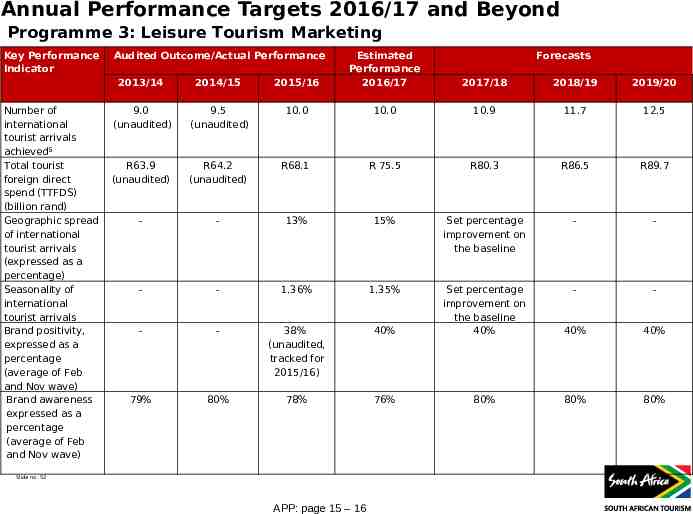
Annual Performance Targets 2016/17 and Beyond Programme 3: Leisure Tourism Marketing Key Performance Indicator Number of international tourist arrivals achieved⁵ Total tourist foreign direct spend (TTFDS) (billion rand) Geographic spread of international tourist arrivals (expressed as a percentage) Seasonality of international tourist arrivals Brand positivity, expressed as a percentage (average of Feb and Nov wave) Brand awareness expressed as a percentage (average of Feb and Nov wave) Audited Outcome/Actual Performance 2013/14 2014/15 2015/16 Estimated Performance 2016/17 9.0 (unaudited) 9.5 (unaudited) 10.0 10.0 10.9 11.7 12.5 R63.9 (unaudited) R64.2 (unaudited) R68.1 R 75.5 R80.3 R86.5 R89.7 - - 13% 15% Set percentage improvement on the baseline - - - - 1.36% 1.35% - - - - 38% (unaudited, tracked for 2015/16) 40% Set percentage improvement on the baseline 40% 40% 40% 79% 80% 78% 76% 80% 80% 80% Slide no. 52 APP: page 15 – 16 Forecasts 2017/18 2018/19 2019/20
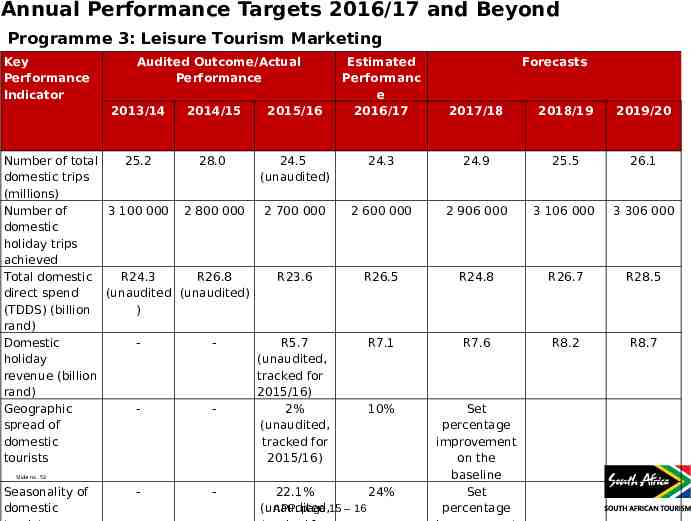
Annual Performance Targets 2016/17 and Beyond Programme 3: Leisure Tourism Marketing Key Performance Indicator Audited Outcome/Actual Performance 2013/14 2014/15 2015/16 Number of total 25.2 28.0 24.5 domestic trips (unaudited) (millions) Number of 3 100 000 2 800 000 2 700 000 domestic holiday trips achieved Total domestic R24.3 R26.8 R23.6 direct spend (unaudited (unaudited) (TDDS) (billion ) rand) Domestic R5.7 holiday (unaudited, revenue (billion tracked for rand) 2015/16) Geographic 2% spread of (unaudited, domestic tracked for tourists 2015/16) Estimated Performanc e 2016/17 2017/18 2018/19 2019/20 24.3 24.9 25.5 26.1 2 600 000 2 906 000 3 106 000 3 306 000 R26.5 R24.8 R26.7 R28.5 R7.1 R7.6 R8.2 R8.7 10% Set percentage improvement on the baseline Set percentage Slide no. 53 Seasonality of domestic - - 22.1% 24% APP: page 15 – 16 (unaudited, Forecasts
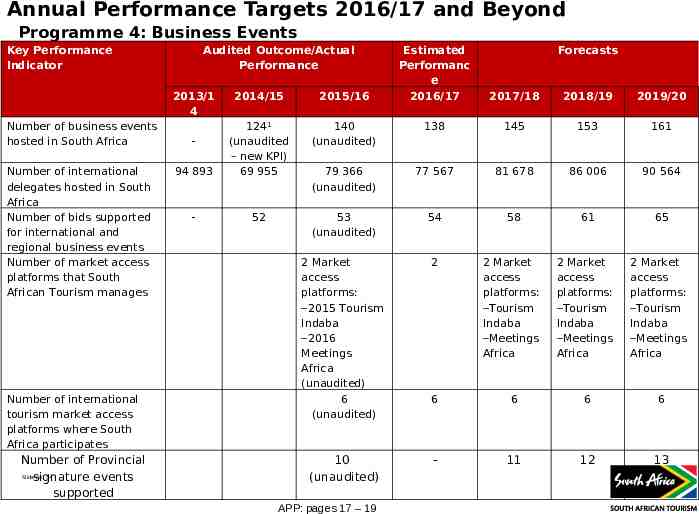
Annual Performance Targets 2016/17 and Beyond Programme 4: Business Events Key Performance Indicator Audited Outcome/Actual Performance 2013/1 4 Number of business events hosted in South Africa Number of international delegates hosted in South Africa Number of bids supported for international and regional business events Number of market access platforms that South African Tourism manages Number of international tourism market access platforms where South Africa participates Number of Provincial Slidesignature no. 54 events supported Estimated Performanc e 2016/17 Forecasts 2017/18 2018/19 2019/20 2014/15 2015/16 140 (unaudited) 138 145 153 161 94 893 124¹ (unaudited – new KPI) 69 955 79 366 (unaudited) 77 567 81 678 86 006 90 564 - 52 53 (unaudited) 54 58 61 65 2 Market access platforms: ‒2015 Tourism Indaba ‒2016 Meetings Africa (unaudited) 6 (unaudited) 2 2 Market access platforms: ‒Tourism Indaba ‒Meetings Africa 2 Market access platforms: ‒Tourism Indaba ‒Meetings Africa 2 Market access platforms: ‒Tourism Indaba ‒Meetings Africa 6 6 6 6 10 (unaudited) - 11 12 13 - APP: pages 17 – 19
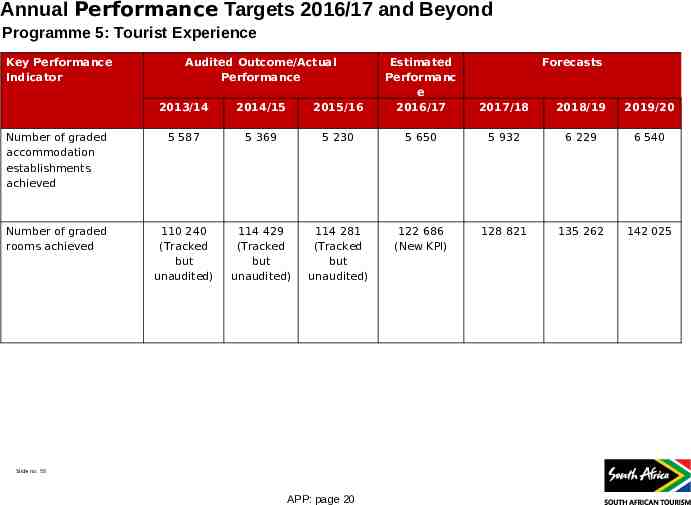
Annual Performance Targets 2016/17 and Beyond Programme 5: Tourist Experience Key Performance Indicator Audited Outcome/Actual Performance 2013/14 2014/15 2015/16 Estimated Performanc e 2016/17 Number of graded accommodation establishments achieved 5 587 5 369 5 230 5 650 5 932 6 229 6 540 Number of graded rooms achieved 110 240 (Tracked but unaudited) 114 429 (Tracked but unaudited) 114 281 (Tracked but unaudited) 122 686 (New KPI) 128 821 135 262 142 025 Slide no. 55 APP: page 20 Forecasts 2017/18 2018/19 2019/20
Quarterly Targets Slide no 55
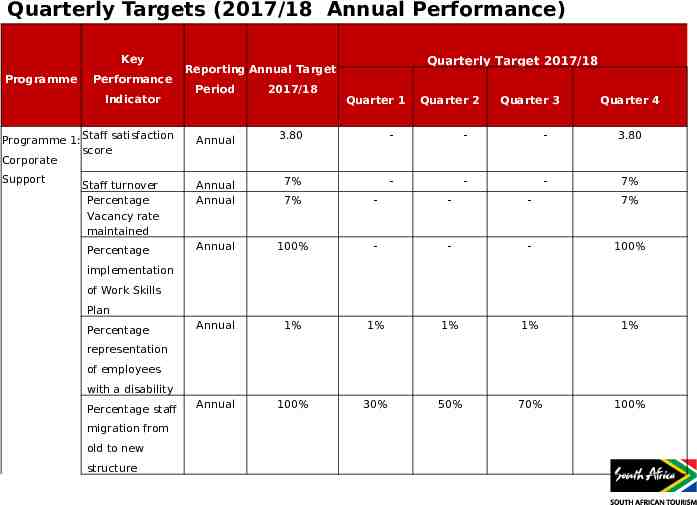
Quarterly Targets (2017/18 Annual Performance) Key Programme Performance Period 2017/18 Annual 3.80 - - - 3.80 Staff turnover Percentage Vacancy rate maintained Annual Annual 7% - - - 7% 7% - - - 7% Percentage Annual 100% - - - 100% Annual 1% 1% 1% 1% 1% Annual 100% 30% 50% 70% 100% Indicator Programme 1: Staff satisfaction score Corporate Support Quarterly Target 2017/18 Reporting Annual Target Quarter 1 Quarter 2 Quarter 3 Quarter 4 implementation of Work Skills Plan Percentage representation of employees with a disability Percentage staff migration from old to new Slide no. 57 structure
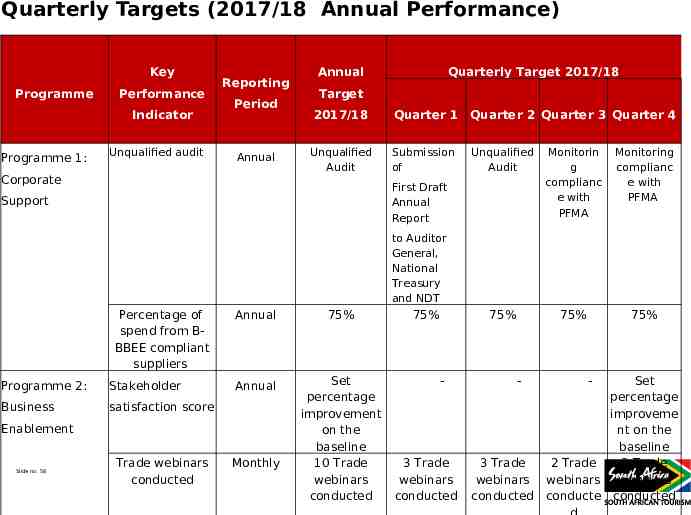
Quarterly Targets (2017/18 Annual Performance) Key Programme Performance Indicator Programme 1: Unqualified audit Reporting Period Annual Corporate Annual Quarterly Target 2017/18 Target 2017/18 Unqualified Audit Quarter 1 Quarter 2 Quarter 3 Quarter 4 Submission of Unqualified Audit Monitorin g complianc e with PFMA Monitoring complianc e with PFMA 75% 75% 75% First Draft Annual Report Support to Auditor General, National Treasury and NDT Percentage of spend from BBBEE compliant suppliers Programme 2: Stakeholder Business satisfaction score Annual 75% Annual Set percentage improvement on the baseline 10 Trade webinars conducted Enablement Slide no. 58 Trade webinars conducted Monthly 75% - 3 Trade webinars conducted - - Set percentage improveme nt on the baseline 3 Trade 2 Trade 2 Trade webinars webinars webinars conducted conducte conducted
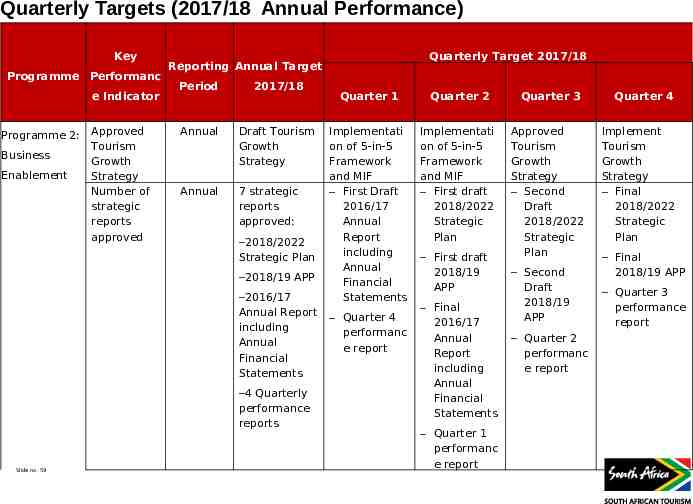
Quarterly Targets (2017/18 Annual Performance) Key Programme Performanc e Indicator Programme 2: Business Enablement Approved Tourism Growth Strategy Number of strategic reports approved Period 2017/18 Annual Draft Tourism Growth Strategy Annual 7 strategic reports approved: ‒2018/2022 Strategic Plan ‒2018/19 APP ‒2016/17 Annual Report including Annual Financial Statements ‒4 Quarterly performance reports Slide no. 59 Quarterly Target 2017/18 Reporting Annual Target Quarter 1 Quarter 2 Quarter 3 Implementati on of 5-in-5 Framework and MIF ‒ First Draft 2016/17 Annual Report including Annual Financial Statements Implementati on of 5-in-5 Framework and MIF ‒ First draft 2018/2022 Strategic Plan Approved Tourism Growth Strategy ‒ Second Draft 2018/2022 Strategic Plan ‒ Quarter 4 performanc e report ‒ First draft 2018/19 APP ‒ Final 2016/17 Annual Report including Annual Financial Statements ‒ Quarter 1 performanc e report ‒ Second Draft 2018/19 APP ‒ Quarter 2 performanc e report Quarter 4 Implement Tourism Growth Strategy ‒ Final 2018/2022 Strategic Plan ‒ Final 2018/19 APP ‒ Quarter 3 performance report
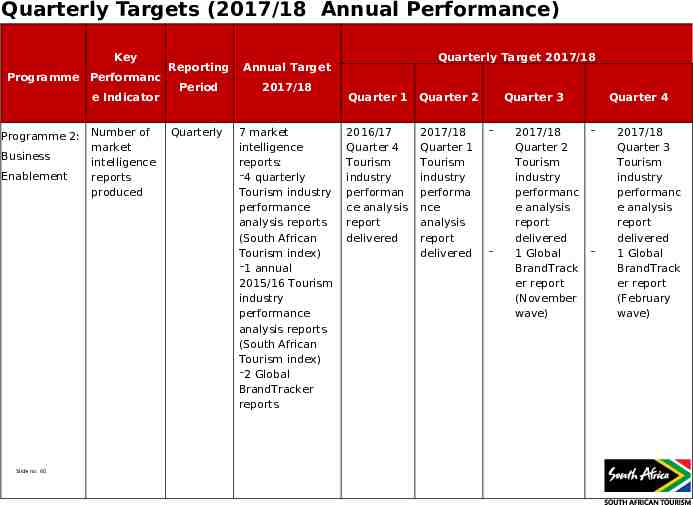
Quarterly Targets (2017/18 Annual Performance) Key Programme Performanc e Indicator Programme 2: Business Enablement Slide no. 60 Number of market intelligence reports produced Reporting Annual Target Period 2017/18 Quarterly 7 market intelligence reports: ‒4 quarterly Tourism industry performance analysis reports (South African Tourism index) ‒1 annual 2015/16 Tourism industry performance analysis reports (South African Tourism index) ‒2 Global BrandTracker reports Quarterly Target 2017/18 Quarter 1 Quarter 2 2016/17 Quarter 4 Tourism industry performan ce analysis report delivered 2017/18 Quarter 1 Tourism industry performa nce analysis report delivered Quarter 3 ‒ ‒ 2017/18 Quarter 2 Tourism industry performanc e analysis report delivered 1 Global BrandTrack er report (November wave) Quarter 4 ‒ ‒ 2017/18 Quarter 3 Tourism industry performanc e analysis report delivered 1 Global BrandTrack er report (February wave)
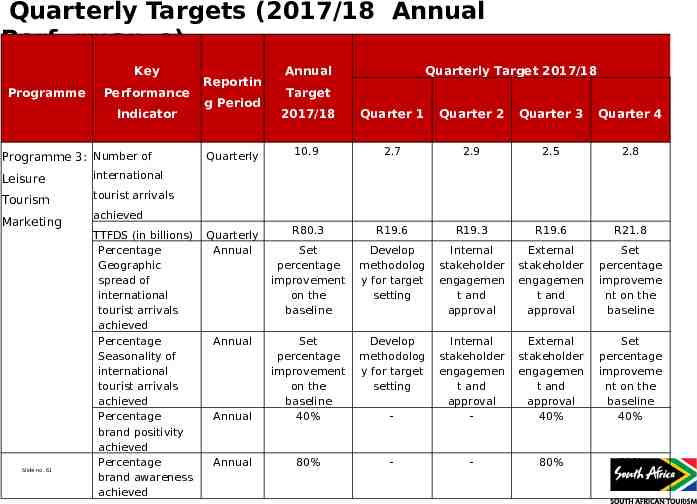
Quarterly Targets (2017/18 Annual Performance) Key Programme Performance Indicator Programme 3: Number of Leisure international Tourism tourist arrivals Marketing Slide no. 61 Reportin g Period Annual Quarterly Target 2017/18 Target 2017/18 Quarter 1 Quarter 2 Quarter 3 Quarter 4 Quarterly 10.9 2.7 2.9 2.5 2.8 Quarterly Annual R80.3 R19.6 R19.3 R19.6 R21.8 Set percentage improvement on the baseline Develop methodolog y for target setting Internal stakeholder engagemen t and approval External stakeholder engagemen t and approval Set percentage improveme nt on the baseline Develop methodolog y for target setting Annual Set percentage improvement on the baseline 40% - Internal stakeholder engagemen t and approval - External stakeholder engagemen t and approval 40% Set percentage improveme nt on the baseline 40% Annual 80% - - 80% 80% achieved TTFDS (in billions) Percentage Geographic spread of international tourist arrivals achieved Percentage Seasonality of international tourist arrivals achieved Percentage brand positivity achieved Percentage brand awareness achieved Annual
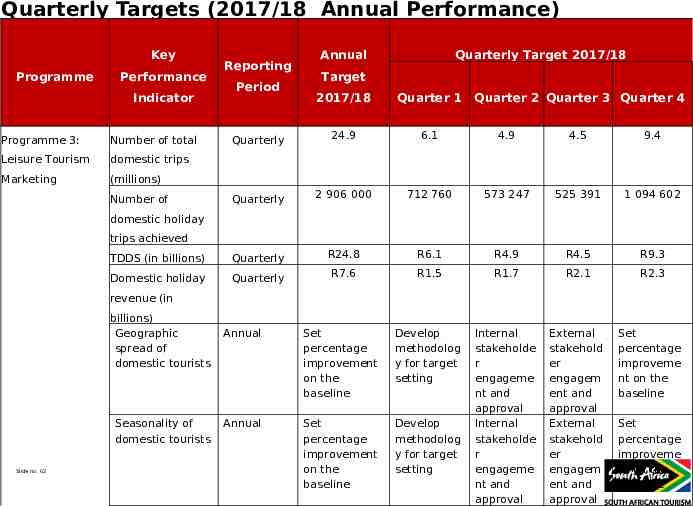
Quarterly Targets (2017/18 Annual Performance) Key Programme Performance Indicator Reporting Period Annual Quarterly Target 2017/18 Target 2017/18 Quarter 1 Quarterly 24.9 6.1 4.9 4.5 9.4 Quarterly 2 906 000 712 760 573 247 525 391 1 094 602 TDDS (in billions) Quarterly R24.8 R6.1 R4.9 R4.5 R9.3 Domestic holiday Quarterly R7.6 R1.5 R1.7 R2.1 R2.3 Annual Set percentage improvement on the baseline Develop methodolog y for target setting Set percentage improvement on the baseline Develop methodolog y for target setting External stakehold er engagem ent and approval External stakehold er engagem ent and approval Set percentage improveme nt on the baseline Annual Internal stakeholde r engageme nt and approval Internal stakeholde r engageme nt and approval Programme 3: Number of total Leisure Tourism domestic trips Marketing (millions) Number of Quarter 2 Quarter 3 Quarter 4 domestic holiday trips achieved revenue (in billions) Geographic spread of domestic tourists Seasonality of domestic tourists Slide no. 62 Set percentage improveme nt on the baseline
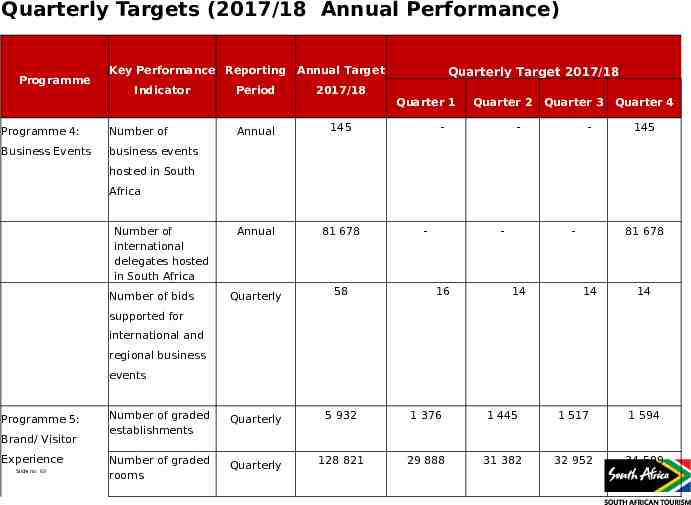
Quarterly Targets (2017/18 Annual Performance) Programme Key Performance Reporting Annual Target Indicator Quarterly Target 2017/18 Period 2017/18 Annual 145 Annual 81 678 Quarterly 58 Number of graded establishments Quarterly 5 932 1 376 1 445 1 517 1 594 Number of graded rooms Quarterly 128 821 29 888 31 382 32 952 34 599 Programme 4: Number of Business Events business events Quarter 1 Quarter 2 - Quarter 3 - - Quarter 4 145 hosted in South Africa Number of international delegates hosted in South Africa Number of bids - - 16 - 14 81 678 14 14 supported for international and regional business events Programme 5: Brand/ Visitor Experience Slide no. 63
Financial Information Slide no 63
Overview of the 2017/18 budget and MTEF estimates This section outlines South African Tourism’s Annual Performance Plan and Budget over the Medium Term Expenditure Framework ( MTEF) period. This section includes the following: Overview of revenue and expenditure estimates; Expenditure as it relates to strategic outcome-oriented goals and Budget breakdown per programme. Slide no 64 APP: page 6
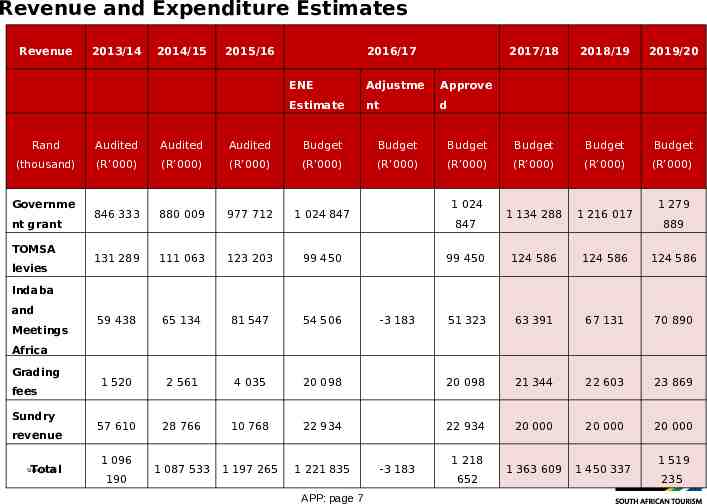
Revenue and Expenditure Estimates Revenue 2013/14 2014/15 2015/16 2016/17 ENE Adjustme Approve Estimate nt d 2017/18 2018/19 2019/20 Rand Audited Audited Audited Budget Budget Budget Budget Budget Budget (thousand) (R’000) (R’000) (R’000) (R’000) (R’000) (R’000) (R’000) (R’000) (R’000) 846 333 880 009 977 712 1 024 847 1 134 288 1 216 017 131 289 111 063 123 203 99 450 99 450 124 586 124 586 124 586 59 438 65 134 81 547 54 506 51 323 63 391 67 131 70 890 1 520 2 561 4 035 20 098 20 098 21 344 22 603 23 869 57 610 28 766 10 768 22 934 22 934 20 000 20 000 20 000 1 087 533 1 197 265 1 221 835 1 363 609 1 450 337 Governme nt grant TOMSA levies 1 024 847 1 279 889 Indaba and Meetings -3 183 Africa Grading fees Sundry revenue Total 1 096 Slide no. 66 190 APP: page 7 -3 183 1 218 652 1 519 235
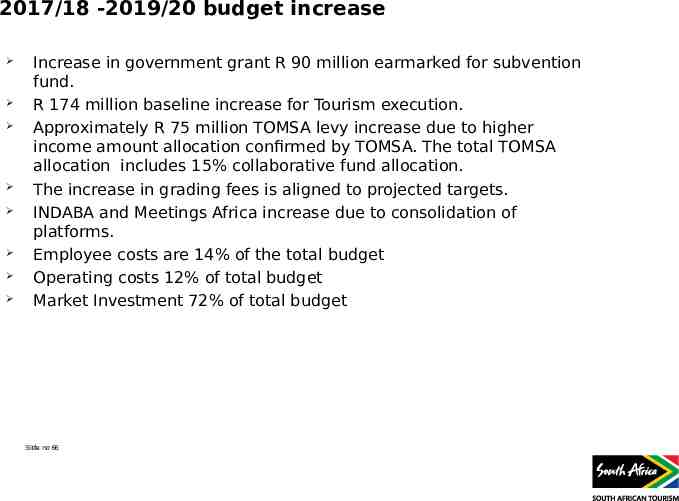
2017/18 -2019/20 budget increase Increase in government grant R 90 million earmarked for subvention fund. R 174 million baseline increase for Tourism execution. Approximately R 75 million TOMSA levy increase due to higher income amount allocation confirmed by TOMSA. The total TOMSA allocation includes 15% collaborative fund allocation. The increase in grading fees is aligned to projected targets. INDABA and Meetings Africa increase due to consolidation of platforms. Employee costs are 14% of the total budget Operating costs 12% of total budget Market Investment 72% of total budget Slide no 66
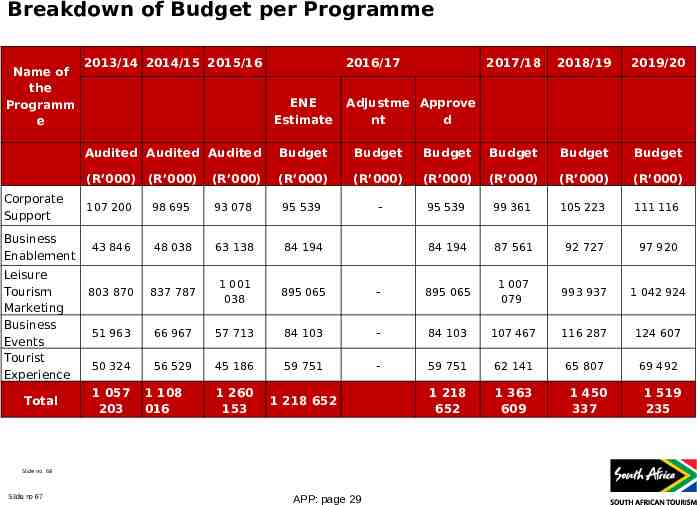
Breakdown of Budget per Programme Name of the Programm e Corporate Support Business Enablement Leisure Tourism Marketing Business Events Tourist Experience Total 2013/14 2014/15 2015/16 2016/17 ENE Estimate 2018/19 2019/20 Adjustme Approve nt d Audited Audited Audited Budget Budget Budget Budget Budget Budget (R’000) (R’000) (R’000) (R’000) (R’000) (R’000) (R’000) (R’000) (R’000) 107 200 98 695 93 078 95 539 - 95 539 99 361 105 223 111 116 43 846 48 038 63 138 84 194 84 194 87 561 92 727 97 920 803 870 837 787 1 001 038 895 065 - 895 065 1 007 079 993 937 1 042 924 51 963 66 967 57 713 84 103 - 84 103 107 467 116 287 124 607 50 324 56 529 45 186 59 751 - 59 751 62 141 65 807 69 492 1 260 153 1 218 652 1 218 652 1 363 609 1 057 203 1 108 016 Slide no. 68 Slide no 67 2017/18 APP: page 29 1 450 337 1 519 235
Organisational Risk Management Slide no 68
Organisational Risk Management At the time of finalising this Strategic Plan, SA Tourism was embarking on a risk assessment to identify risks that might have a negative impact on the achievement of its strategic objectives. This process was concluded by the end of March 2016. The top three risks identified are as follows: Risk 1: Inability to deliver on all the elements within the tourism value chain Contributing Factors: Impact: input. Mitigating Strategies: Immaturity of local market to deal with new investment market needs; Lack of feedback management process; Lack of stakeholder/customer services feedback line. Unable to ascertain stakeholder needs and Stakeholder Engagement Framework; Welcome Campaign; Brand Tracker. Slide no. 70 Strategic Plan: page 53-56
Organisational Risk Management cont. Risk 2: Negative meta perceptions and barriers of the South African Brand Contributing Factors: South Impact: Mitigating Strategies: subscribed Lack of unified communication strategy to improve Africa's reputation as a destination; Star grading stars; Ineffective barrier management Create mechanism to track compliance of unentities Planned collaboration with Brand SA in respect of reputation management Visitor Experience Strategy underpinned by Quality Assurance Slide no. 71 Strategic Plan: page 53-56
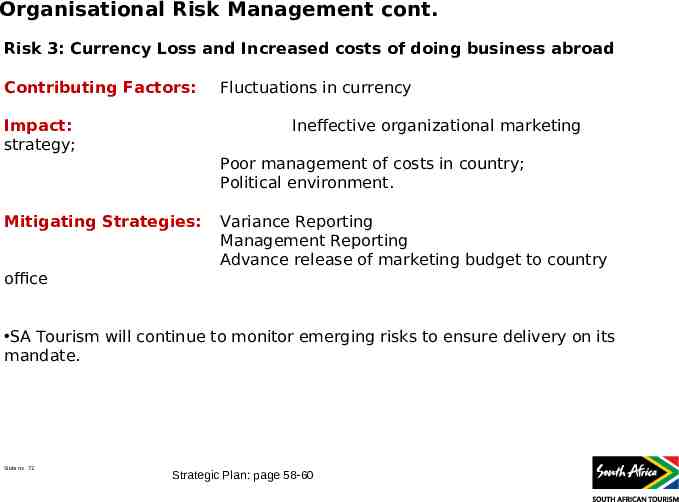
Organisational Risk Management cont. Risk 3: Currency Loss and Increased costs of doing business abroad Contributing Factors: Impact: strategy; Fluctuations in currency Ineffective organizational marketing Poor management of costs in country; Political environment. Mitigating Strategies: Variance Reporting Management Reporting Advance release of marketing budget to country office SA Tourism will continue to monitor emerging risks to ensure delivery on its mandate. Slide no. 72 Strategic Plan: page 58-60
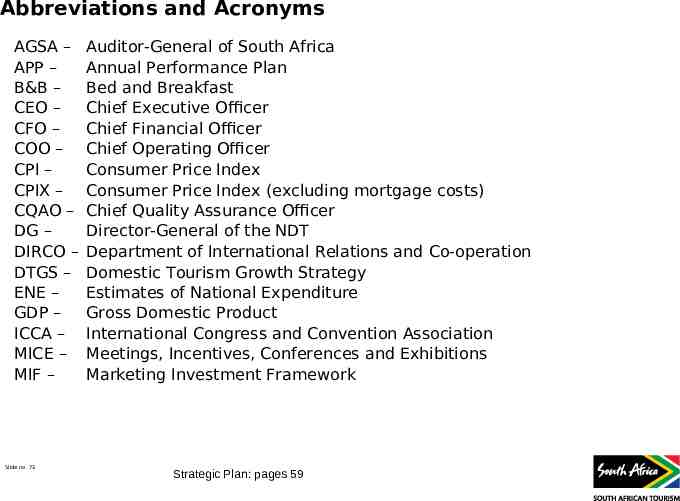
Abbreviations and Acronyms AGSA – APP – B&B – CEO – CFO – COO – CPI – CPIX – CQAO – DG – DIRCO – DTGS – ENE – GDP – ICCA – MICE – MIF – Slide no. 73 Auditor-General of South Africa Annual Performance Plan Bed and Breakfast Chief Executive Officer Chief Financial Officer Chief Operating Officer Consumer Price Index Consumer Price Index (excluding mortgage costs) Chief Quality Assurance Officer Director-General of the NDT Department of International Relations and Co-operation Domestic Tourism Growth Strategy Estimates of National Expenditure Gross Domestic Product International Congress and Convention Association Meetings, Incentives, Conferences and Exhibitions Marketing Investment Framework Strategic Plan: pages 59
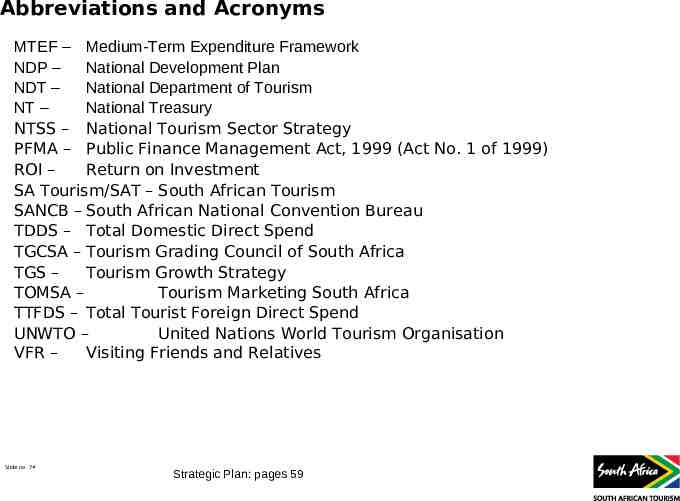
Abbreviations and Acronyms MTEF – Medium-Term Expenditure Framework NDP – National Development Plan NDT – National Department of Tourism NT – National Treasury NTSS – National Tourism Sector Strategy PFMA – Public Finance Management Act, 1999 (Act No. 1 of 1999) ROI – Return on Investment SA Tourism/SAT – South African Tourism SANCB – South African National Convention Bureau TDDS – Total Domestic Direct Spend TGCSA – Tourism Grading Council of South Africa TGS – Tourism Growth Strategy TOMSA – Tourism Marketing South Africa TTFDS – Total Tourist Foreign Direct Spend UNWTO – United Nations World Tourism Organisation VFR – Visiting Friends and Relatives Slide no. 74 Strategic Plan: pages 59
Thank You Slide no 74