Visualizing Northshore Watershed Topology and Flow Patterns James E.

12 Slides1.93 MB
Visualizing Northshore Watershed Topology and Flow Patterns James E. Mitchell, Ph.D. IT aGIS Manager at the Adapted from Presentation 2012 ESRI International User’s Conference San Diego, California – July, 2012 (Revised January, 2013)
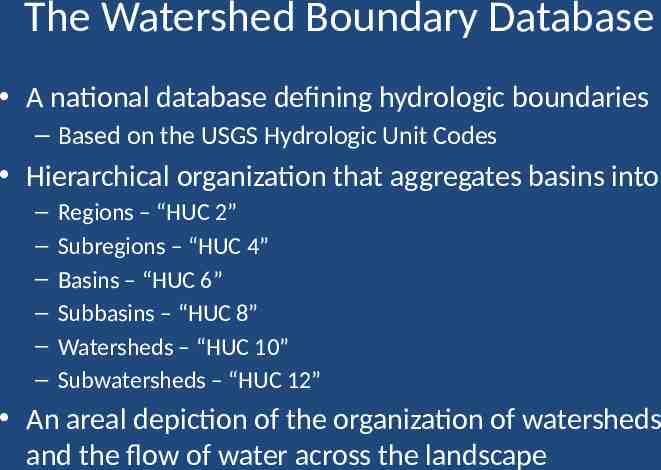
The Watershed Boundary Database A national database defining hydrologic boundaries – Based on the USGS Hydrologic Unit Codes Hierarchical organization that aggregates basins into – – – – – – Regions – “HUC 2” Subregions – “HUC 4” Basins – “HUC 6” Subbasins – “HUC 8” Watersheds – “HUC 10” Subwatersheds – “HUC 12” An areal depiction of the organization of watersheds and the flow of water across the landscape
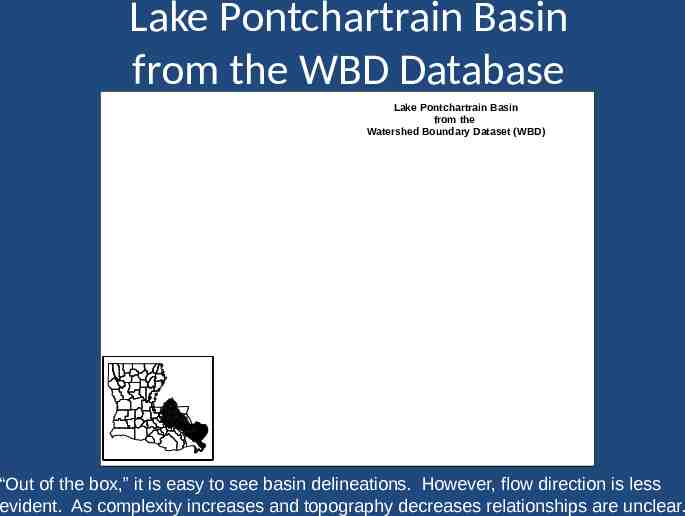
Lake Pontchartrain Basin from the WBD Database Lake Pontchartrain Basin from the Watershed Boundary Dataset (WBD) “Out of the box,” it is easy to see basin delineations. However, flow direction is less evident. As complexity increases and topography decreases relationships are unclear.
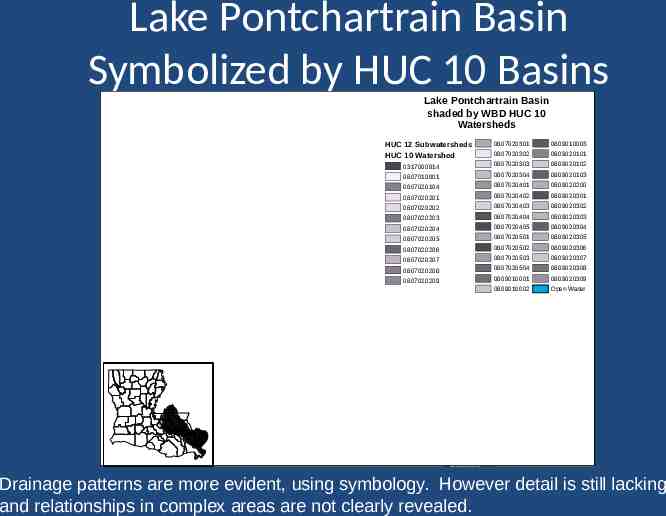
Lake Pontchartrain Basin Symbolized by HUC 10 Basins Lake Pontchartrain Basin shaded by WBD HUC 10 Watersheds HUC 12 Subwatersheds 0807020301 0809010003 HUC 10 Watershed 0807020302 0809020101 0317000914 0807020303 0809020102 0807010001 0807020304 0809020103 0807020104 0807020401 0809020200 0807020201 0807020402 0809020301 0807020202 0807020403 0809020302 0807020203 0807020404 0809020303 0807020204 0807020405 0809020304 0807020205 0807020501 0809020305 0807020206 0807020502 0809020306 0807020207 0807020503 0809020307 0807020208 0807020504 0809020308 0807020209 0809010001 0809020309 0809010002 Open Water Drainage patterns are more evident, using symbology. However detail is still lacking and relationships in complex areas are not clearly revealed.
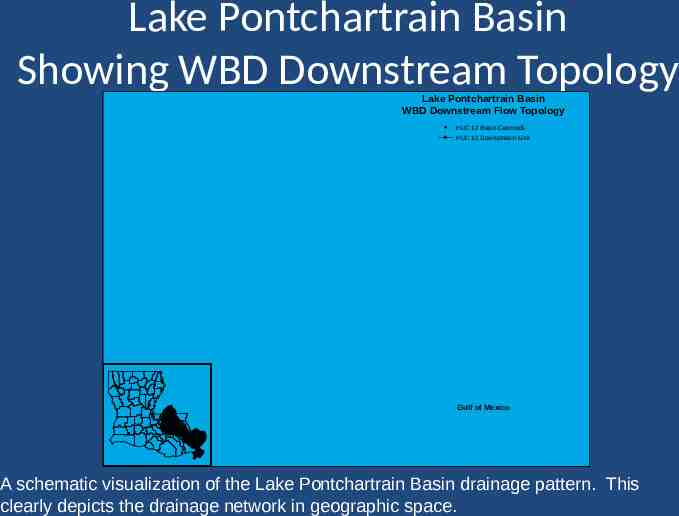
Lake Pontchartrain Basin Showing WBD Downstream Topology Lake Pontchartrain Basin WBD Downstream Flow Topology HUC 12 Basin Centroids HUC 12 Downstream Link Gulf of Mexico A schematic visualization of the Lake Pontchartrain Basin drainage pattern. This clearly depicts the drainage network in geographic space.
What Can Be Done with this Schematic Diagram? Explore WBD Relationships Identify flow relationships – Upstream/downstream (including multiple pourpoints – Flow accumulation – Diversions and interbasin transfers Visualize the flow network in different formats (styles) Trace flow paths – Connect sources to downstream impacts
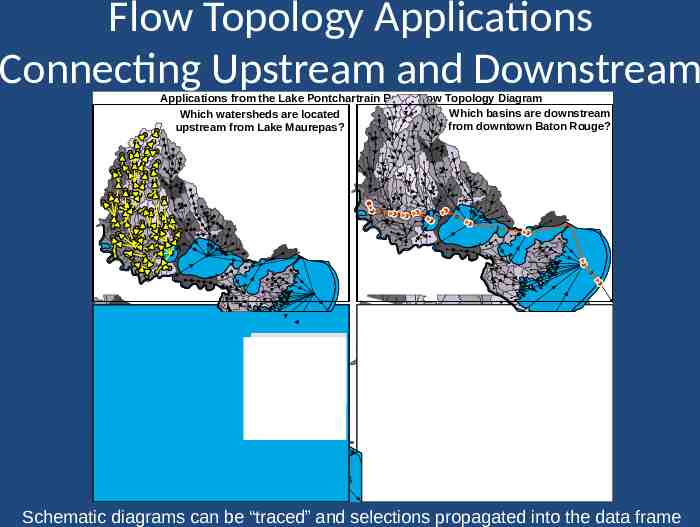
Flow Topology Applications Connecting Upstream and Downstream Applications from the Lake Pontchartrain Basin Flow Topology Diagram Which basins are downstream Which watersheds are located from downtown Baton Rouge? upstream from Lake Maurepas? What drainage systems connect to Lake Pontchartrain? What drainage systems connect Jones Creek to Lake Pontchartrain? Jones Creek Clay Cut Bayou Bayou Barbary North Pass-Manchac Pass King George Bayou Lake Maurepas Lake Pontchartrain Schematic diagrams can be “traced” and selections propagated into the data frame
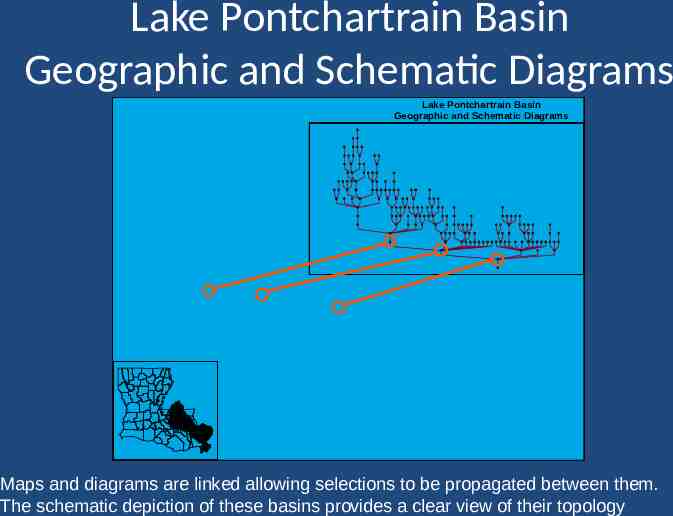
Lake Pontchartrain Basin Geographic and Schematic Diagrams Lake Pontchartrain Basin Geographic and Schematic Diagrams Maps and diagrams are linked allowing selections to be propagated between them. The schematic depiction of these basins provides a clear view of their topology
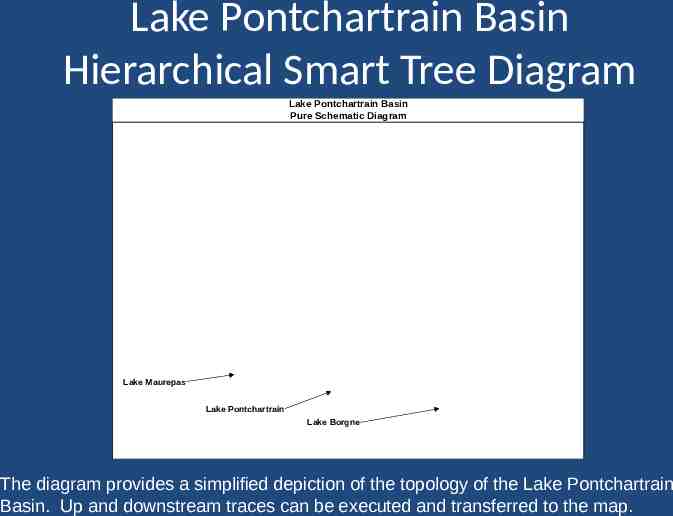
Lake Pontchartrain Basin Hierarchical Smart Tree Diagram Lake Pontchartrain Basin Pure Schematic Diagram Lake Maurepas Lake Pontchartrain Lake Borgne The diagram provides a simplified depiction of the topology of the Lake Pontchartrain Basin. Up and downstream traces can be executed and transferred to the map.
Lake Pontchartrain Basin Hierarchical Diagram/Orthogonal Corners Lake Pontchartrain Basin Pure Schematic Diagram wih Orthogonal Connections Lake Maurepas Lake Pontchartrain Lake Borgne Diagrams can be edited and reformatted using varies options. Using this capability, diagrams can be designed to satisfy essential operational and functional requirements.
Conclusions Schematics provide a powerful tool for visualizing topological relationships – “Geographic” (map) space – “Logical” (diagram) space Schematics can be used to investigate, reconcile, and explore topological relationships Schematics can be used to extend the capabilities of geospatial data, such as the Watershed Boundary Dataset by: – Creating a logical network representing the flow through geographic elements – Augmenting simple topology with complex networks – Extending the capabilities of the data with tools that can navigate through the network
For More Information Contact James E. Mitchell, Ph. D. Louisiana Office of Technology Services [email protected] 225-379-1881