Pin Tutorial Robert Cohn Intel
58 Slides2.38 MB
Pin Tutorial Robert Cohn Intel
About Me Robert Cohn – – – – – Original author of Pin Senior Principal Engineer at Intel Ph.D. in Computer Science Carnegie Mellon University Profile guided optimization, post link optimization, binary translation, instrumentation [email protected] Today’s Agenda I. Morning: Pin Intro and Overview II. Afternoon: Advanced Pin 2 Pin Tutorial Academia Sinica 2009
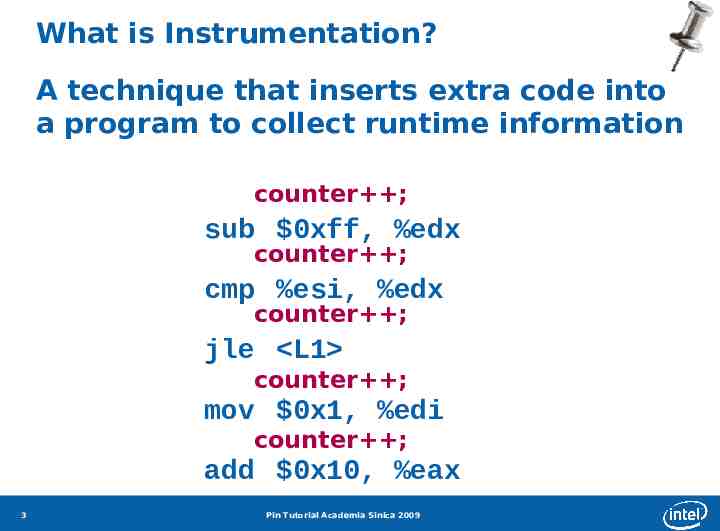
What is Instrumentation? A technique that inserts extra code into a program to collect runtime information counter ; sub 0xff, %edx counter ; cmp %esi, %edx counter ; jle L1 counter ; mov 0x1, %edi counter ; add 0x10, %eax 3 Pin Tutorial Academia Sinica 2009
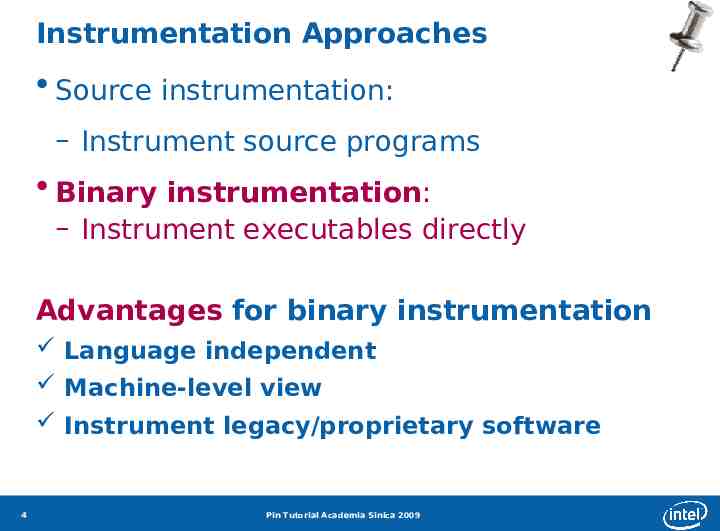
Instrumentation Approaches Source instrumentation: – Instrument source programs Binary instrumentation: – Instrument executables directly Advantages for binary instrumentation Language independent Machine-level view Instrument legacy/proprietary software 4 Pin Tutorial Academia Sinica 2009
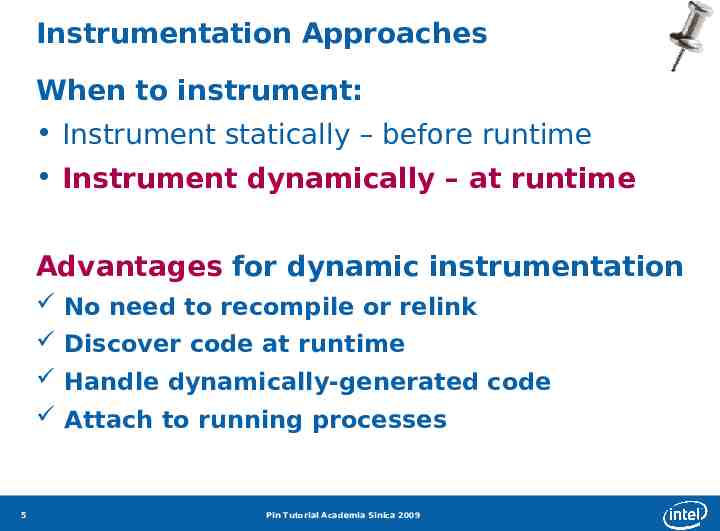
Instrumentation Approaches When to instrument: Instrument statically – before runtime Instrument dynamically – at runtime Advantages for dynamic instrumentation No need to recompile or relink Discover code at runtime Handle dynamically-generated code Attach to running processes 5 Pin Tutorial Academia Sinica 2009
How is Instrumentation used in Computer Architecture Research? Trace Generation Branch Predictor and Cache Modeling Fault Tolerance Studies Emulating Speculation Emulating New Instructions 6 Pin Tutorial Academia Sinica 2009
How is Instrumentation used in Program Analysis? Code coverage Call-graph generation Memory-leak detection Instruction profiling Data dependence profiling Thread analysis – Thread profiling – Race detection 7 Pin Tutorial Academia Sinica 2009
Advantages of Pin Instrumentation Easy-to-use Instrumentation: Uses dynamic instrumentation – Do not need source code, recompilation, post-linking Programmable Instrumentation: Provides rich APIs to write in C/C your own instrumentation tools (called Pintools) Multiplatform: Supports x86, x86-64, Itanium Supports Linux, Windows Robust: Instruments real-life applications: Database, web browsers, Instruments multithreaded applications Supports signals Efficient: Applies compiler optimizations on instrumentation code 8 Pin Tutorial Academia Sinica 2009
Widely Used and Supported Large user base in academia and industry – 30,000 downloads – 400 citations – Active mailing list (Pinheads) Actively developed at Intel – Intel products and internal tools depend on it – Nightly testing of 25000 binaries on 15 platforms 9 Pin Tutorial Academia Sinica 2009
Program Analysis Products That Use Pin Detects: memory leaks, uninitialized data, dangling pointer, deadlocks, data races Performance analysis: concurrency, locking 10 Pin Tutorial Academia Sinica 2009
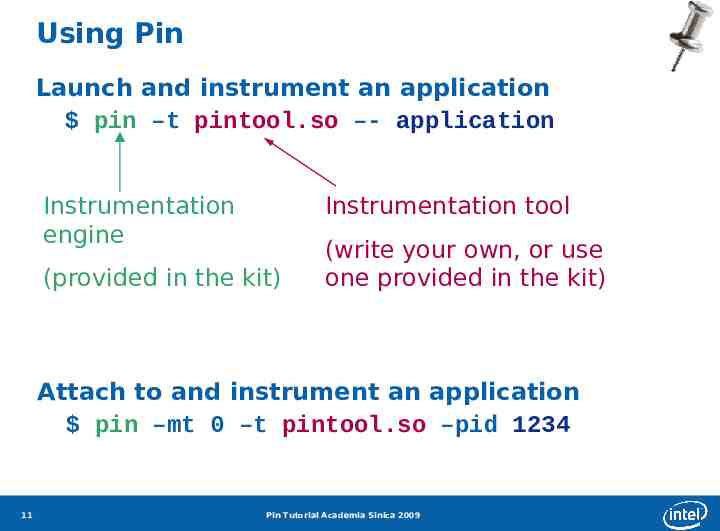
Using Pin Launch and instrument an application pin –t pintool.so –- application Instrumentation engine Instrumentation tool (provided in the kit) (write your own, or use one provided in the kit) Attach to and instrument an application pin –mt 0 –t pintool.so –pid 1234 11 Pin Tutorial Academia Sinica 2009
Pin Instrumentation APIs Basic APIs are architecture independent: Provide common functionalities like determining: – Control-flow changes – Memory accesses Architecture-specific APIs e.g., Info about opcodes and operands Call-based APIs: Instrumentation routines Analysis routines 12 Pin Tutorial Academia Sinica 2009
Instrumentation vs. Analysis Concepts borrowed from the ATOM tool: Instrumentation routines define where instrumentation is inserted e.g., before instruction Occurs first time an instruction is executed Analysis routines define what to do when instrumentation is activated e.g., increment counter Occurs every time an instruction is executed 13 Pin Tutorial Academia Sinica 2009
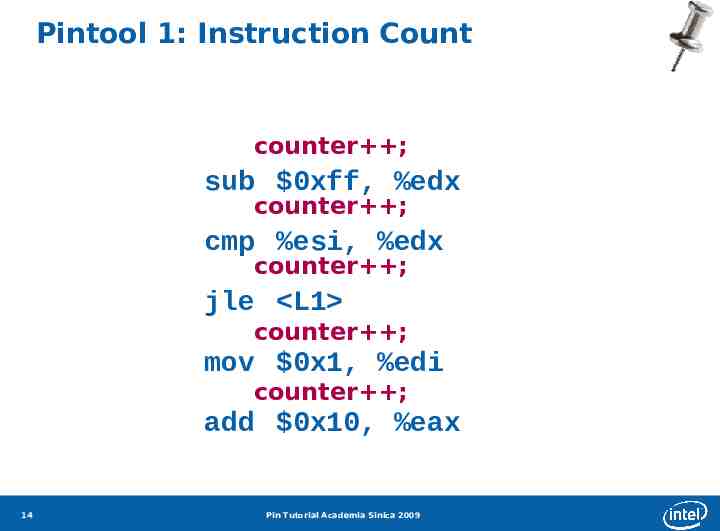
Pintool 1: Instruction Count counter ; sub 0xff, %edx counter ; cmp %esi, %edx counter ; jle L1 counter ; mov 0x1, %edi counter ; add 0x10, %eax 14 Pin Tutorial Academia Sinica 2009
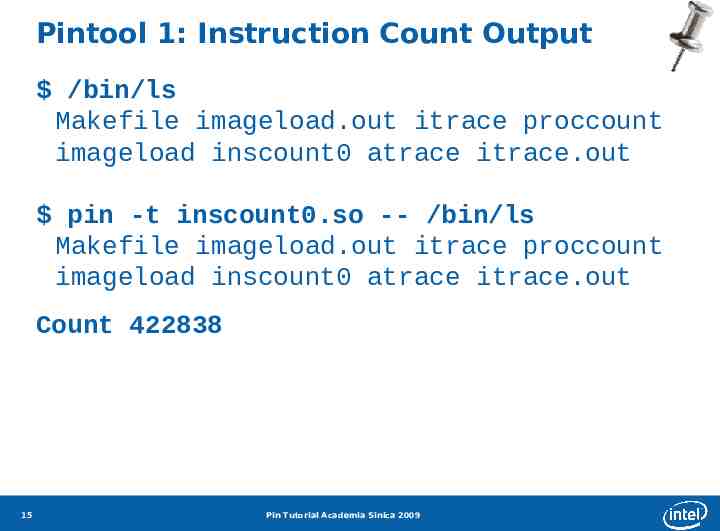
Pintool 1: Instruction Count Output /bin/ls Makefile imageload.out itrace proccount imageload inscount0 atrace itrace.out pin -t inscount0.so -- /bin/ls Makefile imageload.out itrace proccount imageload inscount0 atrace itrace.out Count 422838 15 Pin Tutorial Academia Sinica 2009
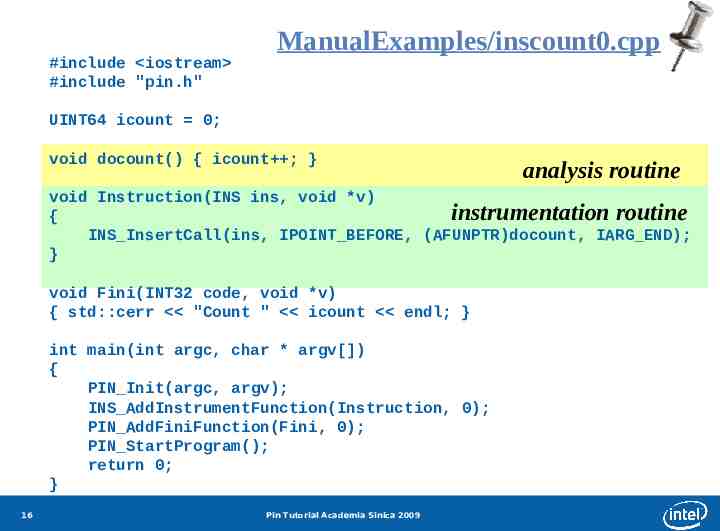
#include iostream #include "pin.h" ManualExamples/inscount0.cpp UINT64 icount 0; void docount() { icount ; } analysis routine void Instruction(INS ins, void *v) instrumentation routine { INS InsertCall(ins, IPOINT BEFORE, (AFUNPTR)docount, IARG END); } void Fini(INT32 code, void *v) { std::cerr "Count " icount endl; } int main(int argc, char * argv[]) { PIN Init(argc, argv); INS AddInstrumentFunction(Instruction, 0); PIN AddFiniFunction(Fini, 0); PIN StartProgram(); return 0; } 16 Pin Tutorial Academia Sinica 2009
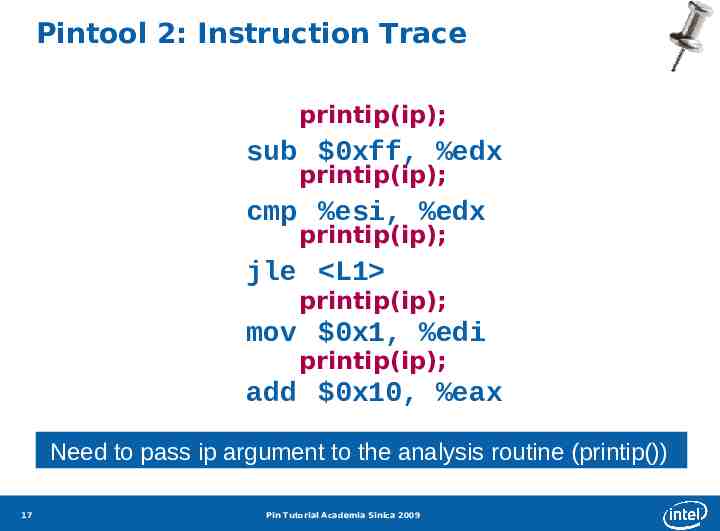
Pintool 2: Instruction Trace printip(ip); sub 0xff, %edx printip(ip); cmp %esi, %edx printip(ip); jle L1 printip(ip); mov 0x1, %edi printip(ip); add 0x10, %eax Need to pass ip argument to the analysis routine (printip()) 17 Pin Tutorial Academia Sinica 2009
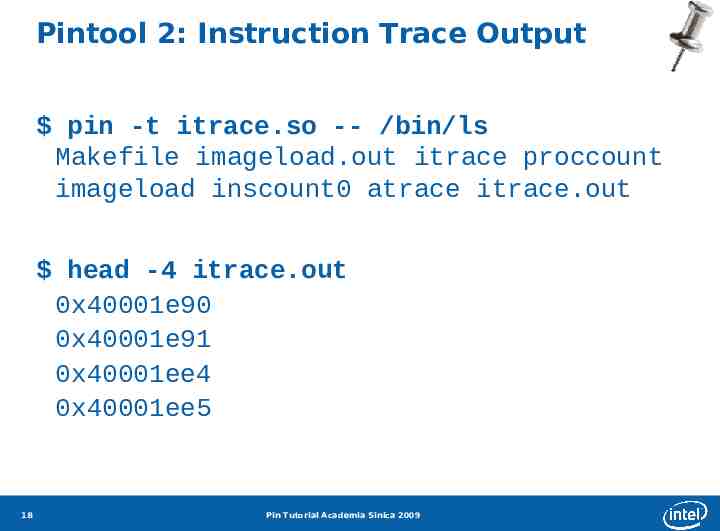
Pintool 2: Instruction Trace Output pin -t itrace.so -- /bin/ls Makefile imageload.out itrace proccount imageload inscount0 atrace itrace.out head -4 itrace.out 0x40001e90 0x40001e91 0x40001ee4 0x40001ee5 18 Pin Tutorial Academia Sinica 2009
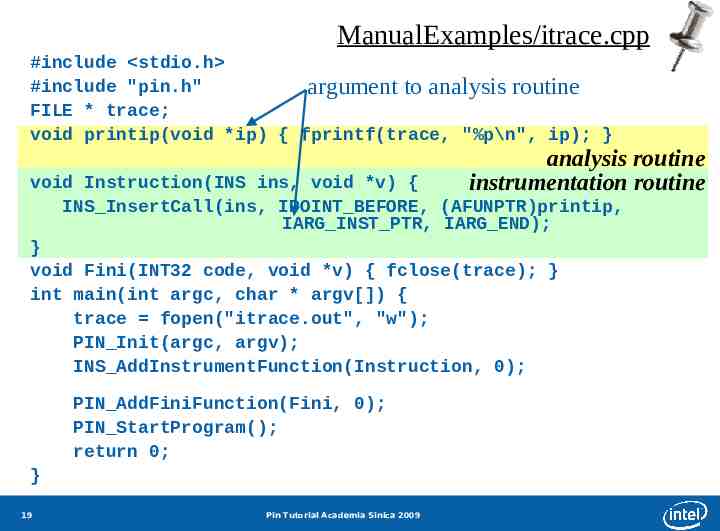
ManualExamples/itrace.cpp #include stdio.h #include "pin.h" argument to analysis routine FILE * trace; void printip(void *ip) { fprintf(trace, "%p\n", ip); } analysis routine instrumentation routine void Instruction(INS ins, void *v) { INS InsertCall(ins, IPOINT BEFORE, (AFUNPTR)printip, IARG INST PTR, IARG END); } void Fini(INT32 code, void *v) { fclose(trace); } int main(int argc, char * argv[]) { trace fopen("itrace.out", "w"); PIN Init(argc, argv); INS AddInstrumentFunction(Instruction, 0); PIN AddFiniFunction(Fini, 0); PIN StartProgram(); return 0; } 19 Pin Tutorial Academia Sinica 2009
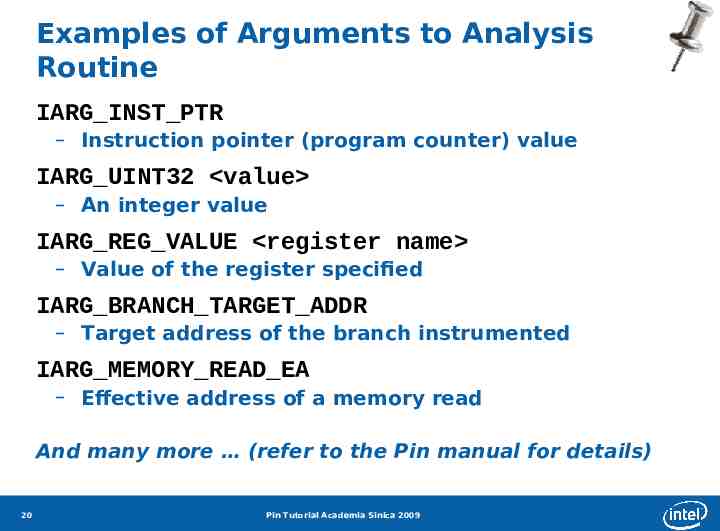
Examples of Arguments to Analysis Routine IARG INST PTR – Instruction pointer (program counter) value IARG UINT32 value – An integer value IARG REG VALUE register name – Value of the register specified IARG BRANCH TARGET ADDR – Target address of the branch instrumented IARG MEMORY READ EA – Effective address of a memory read And many more (refer to the Pin manual for details) 20 Pin Tutorial Academia Sinica 2009
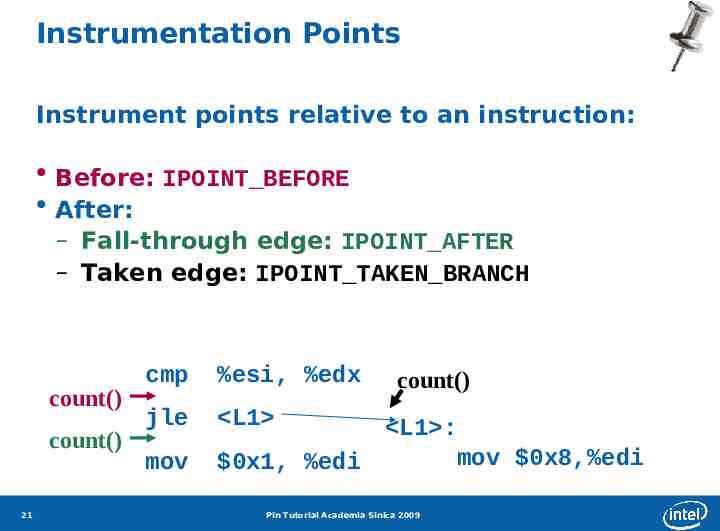
Instrumentation Points Instrument points relative to an instruction: Before: IPOINT BEFORE After: – Fall-through edge: IPOINT AFTER – Taken edge: IPOINT TAKEN BRANCH count() count() 21 cmp %esi, %edx jle L1 mov count() L1 : mov 0x8,%edi 0x1, %edi Pin Tutorial Academia Sinica 2009
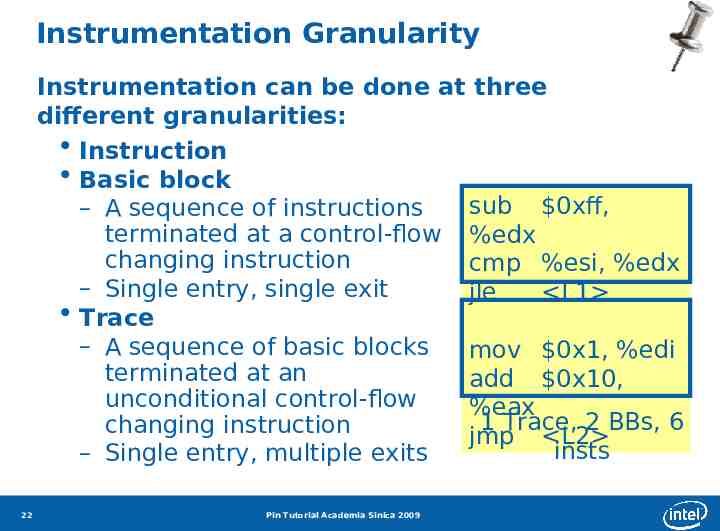
Instrumentation Granularity Instrumentation can be done at three different granularities: Instruction Basic block sub 0xff, – A sequence of instructions terminated at a control-flow %edx changing instruction cmp %esi, %edx – Single entry, single exit jle L1 Trace – A sequence of basic blocks mov 0x1, %edi terminated at an add 0x10, unconditional control-flow %eax 1 Trace, 2 BBs, 6 changing instruction jmp L2 insts – Single entry, multiple exits 22 Pin Tutorial Academia Sinica 2009
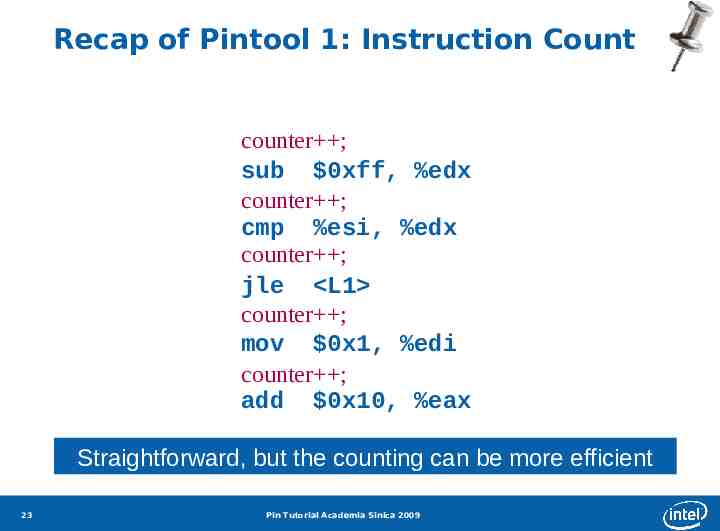
Recap of Pintool 1: Instruction Count counter ; sub 0xff, %edx counter ; cmp %esi, %edx counter ; jle L1 counter ; mov 0x1, %edi counter ; add 0x10, %eax Straightforward, but the counting can be more efficient 23 Pin Tutorial Academia Sinica 2009
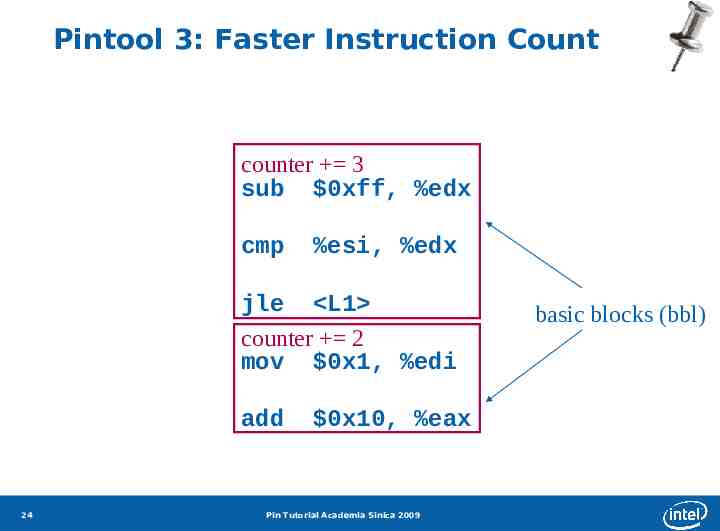
Pintool 3: Faster Instruction Count counter 3 sub 0xff, %edx cmp %esi, %edx jle L1 counter 2 mov 0x1, %edi add 24 0x10, %eax Pin Tutorial Academia Sinica 2009 basic blocks (bbl)
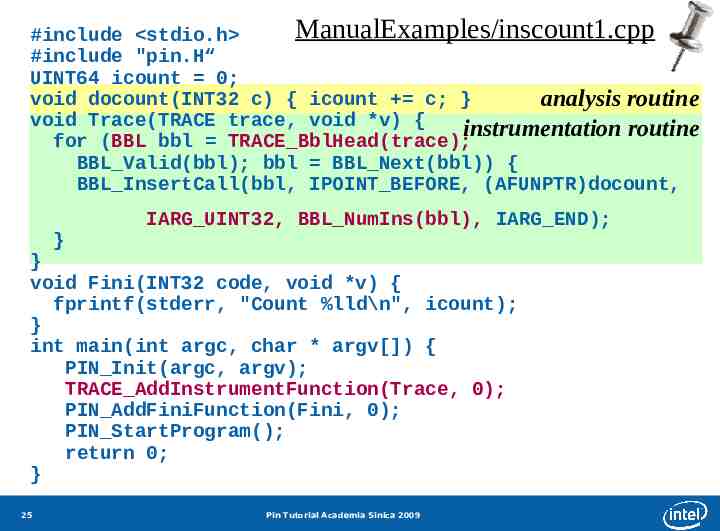
ManualExamples/inscount1.cpp #include stdio.h #include "pin.H“ UINT64 icount 0; void docount(INT32 c) { icount c; } analysis routine void Trace(TRACE trace, void *v) { instrumentation routine for (BBL bbl TRACE BblHead(trace); BBL Valid(bbl); bbl BBL Next(bbl)) { BBL InsertCall(bbl, IPOINT BEFORE, (AFUNPTR)docount, } IARG UINT32, BBL NumIns(bbl), IARG END); } void Fini(INT32 code, void *v) { fprintf(stderr, "Count %lld\n", icount); } int main(int argc, char * argv[]) { PIN Init(argc, argv); TRACE AddInstrumentFunction(Trace, 0); PIN AddFiniFunction(Fini, 0); PIN StartProgram(); return 0; } 25 Pin Tutorial Academia Sinica 2009
Modifying Program Behavior Pin allows you not only to observe but also change program behavior Ways to change program behavior: Add/delete instructions Change register values Change memory values Change control flow 26 Pin Tutorial Academia Sinica 2009
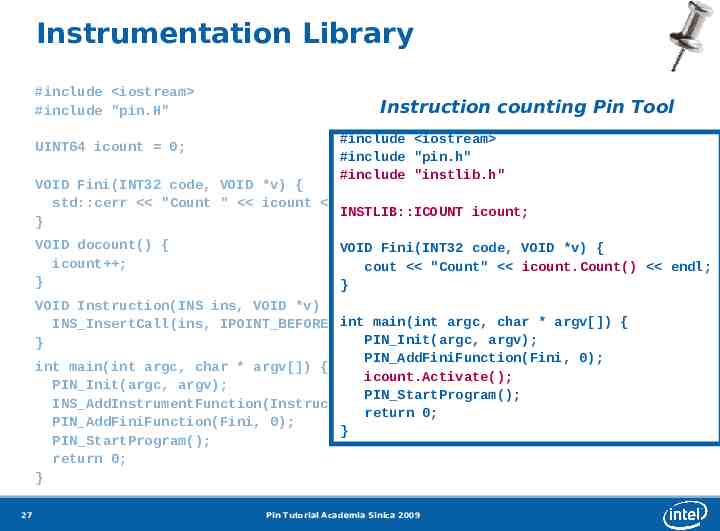
Instrumentation Library #include iostream #include "pin.H" UINT64 icount 0; Instruction counting Pin Tool #include iostream #include "pin.h" #include "instlib.h" VOID Fini(INT32 code, VOID *v) { std::cerr "Count " icount endl; INSTLIB::ICOUNT icount; } VOID docount() { icount ; } VOID Fini(INT32 code, VOID *v) { cout "Count" icount.Count() endl; } VOID Instruction(INS ins, VOID *v) { int main(int argc,IARG END); char * argv[]) { INS InsertCall(ins, IPOINT BEFORE,(AFUNPTR)docount, PIN Init(argc, argv); } PIN AddFiniFunction(Fini, 0); int main(int argc, char * argv[]) { icount.Activate(); PIN Init(argc, argv); PIN StartProgram(); INS AddInstrumentFunction(Instruction, 0); return 0; PIN AddFiniFunction(Fini, 0); } PIN StartProgram(); return 0; } 27 Pin Tutorial Academia Sinica 2009
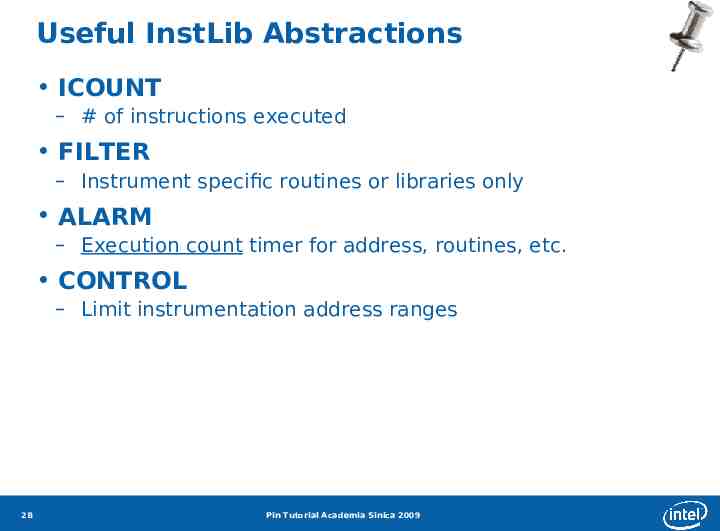
Useful InstLib Abstractions ICOUNT – # of instructions executed FILTER – Instrument specific routines or libraries only ALARM – Execution count timer for address, routines, etc. CONTROL – Limit instrumentation address ranges 28 Pin Tutorial Academia Sinica 2009
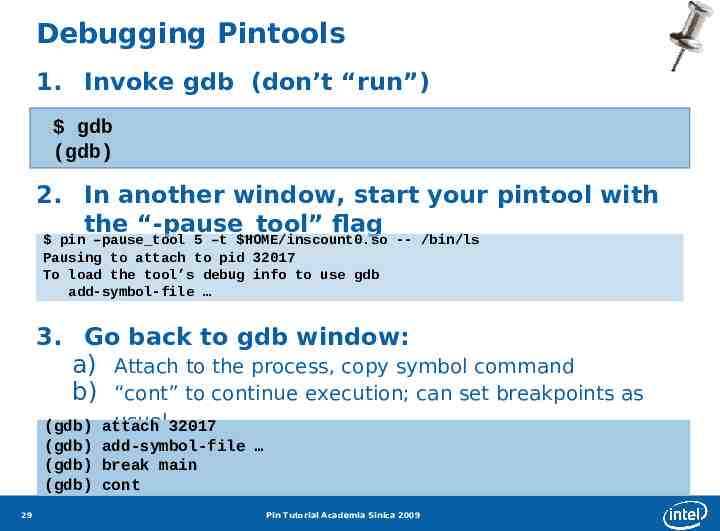
Debugging Pintools 1. Invoke gdb (don’t “run”) gdb (gdb) 2. In another window, start your pintool with the “-pause tool” flag pin –pause tool 5 –t HOME/inscount0.so -- /bin/ls Pausing to attach to pid 32017 To load the tool’s debug info to use gdb add-symbol-file 3. Go back to gdb window: a) Attach to the process, copy symbol command b) “cont” to continue execution; can set breakpoints as (gdb) (gdb) (gdb) (gdb) 29 usual 32017 attach add-symbol-file break main cont Pin Tutorial Academia Sinica 2009
Pin Internals
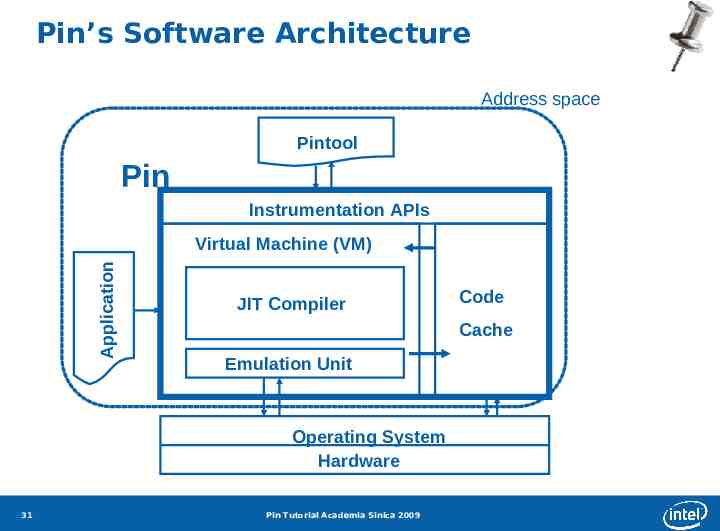
Pin’s Software Architecture Address space Pintool Pin Instrumentation APIs Application Virtual Machine (VM) JIT Compiler Cache Emulation Unit Operating System Hardware 31 Code Pin Tutorial Academia Sinica 2009
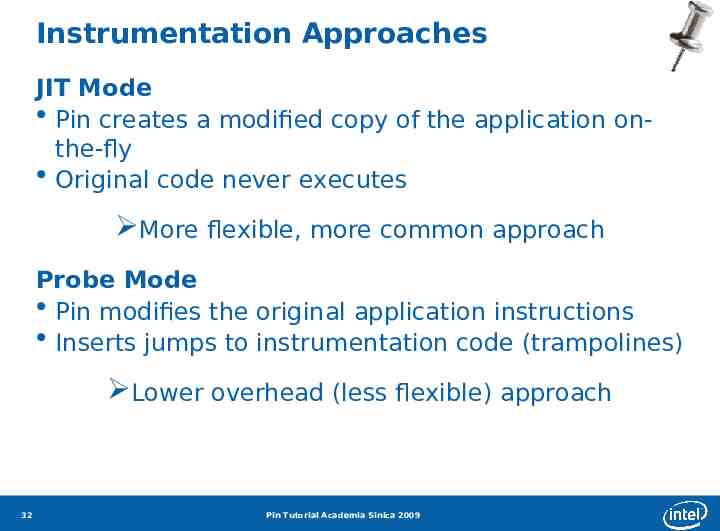
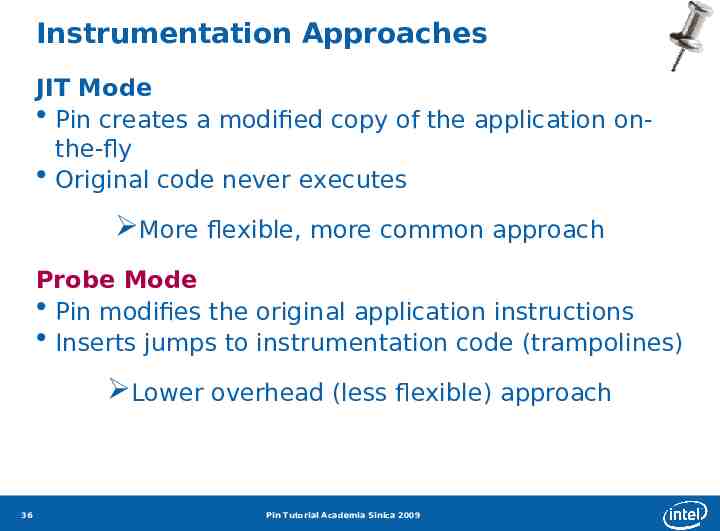
Instrumentation Approaches JIT Mode Pin creates a modified copy of the application onthe-fly Original code never executes More flexible, more common approach Probe Mode Pin modifies the original application instructions Inserts jumps to instrumentation code (trampolines) Lower overhead (less flexible) approach 32 Pin Tutorial Academia Sinica 2009
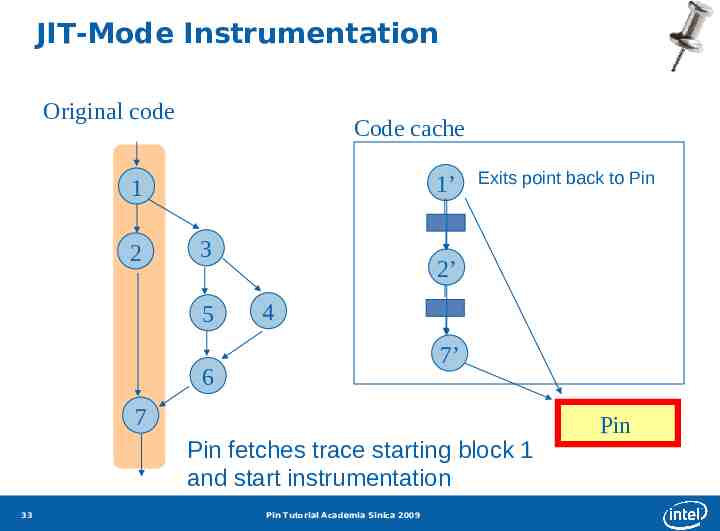
JIT-Mode Instrumentation Original code Code cache 1’ 1 2 3 5 Exits point back to Pin 2’ 4 7’ 6 7 Pin fetches trace starting block 1 and start instrumentation 33 Pin Tutorial Academia Sinica 2009 Pin
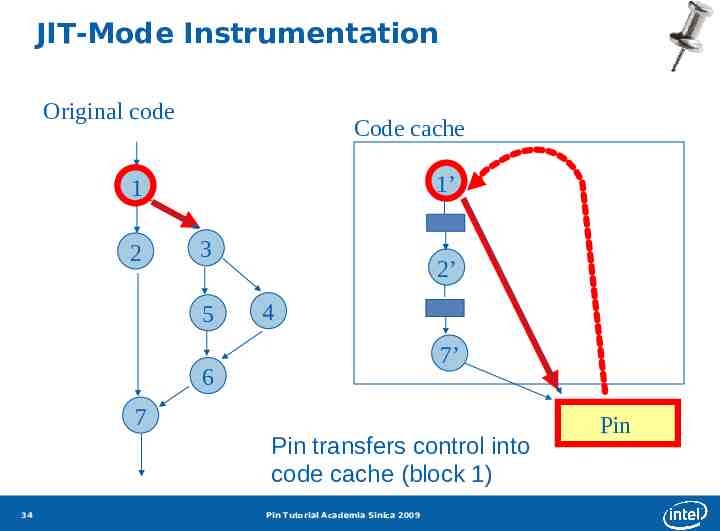
JIT-Mode Instrumentation Original code Code cache 1’ 1 2 3 5 2’ 4 7’ 6 7 Pin transfers control into code cache (block 1) 34 Pin Tutorial Academia Sinica 2009 Pin
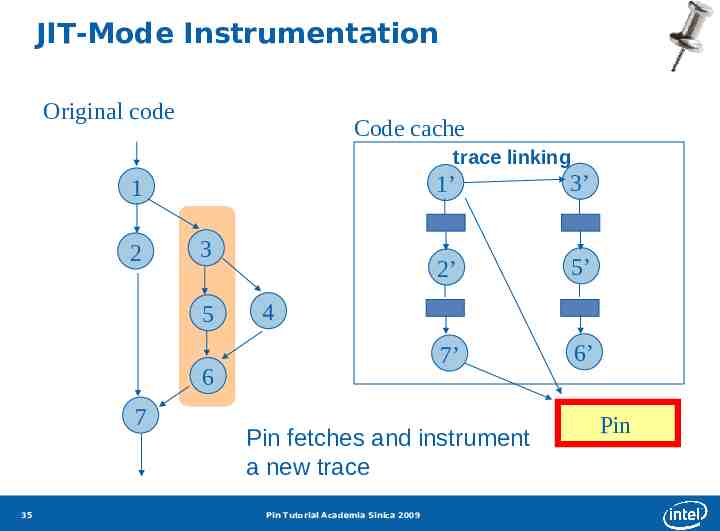
JIT-Mode Instrumentation Original code Code cache trace linking 1 2 3 5 35 3’ 2’ 5’ 7’ 6’ 4 6 7 1’ Pin fetches and instrument a new trace Pin Tutorial Academia Sinica 2009 Pin
Instrumentation Approaches JIT Mode Pin creates a modified copy of the application onthe-fly Original code never executes More flexible, more common approach Probe Mode Pin modifies the original application instructions Inserts jumps to instrumentation code (trampolines) Lower overhead (less flexible) approach 36 Pin Tutorial Academia Sinica 2009
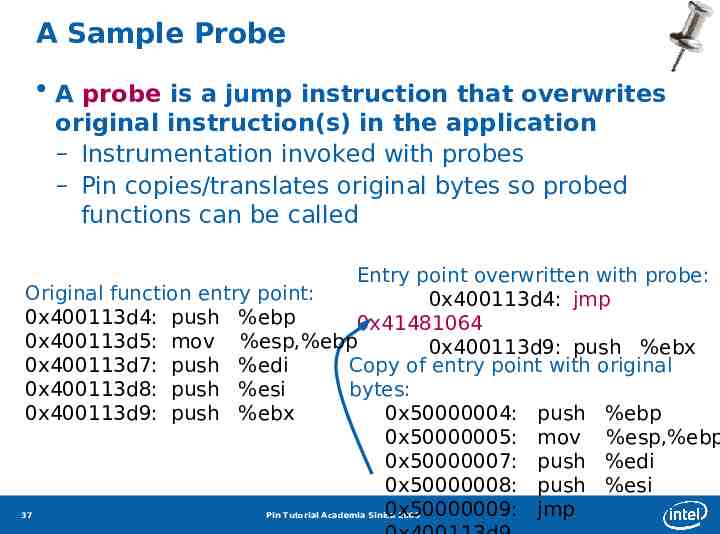
A Sample Probe A probe is a jump instruction that overwrites original instruction(s) in the application – Instrumentation invoked with probes – Pin copies/translates original bytes so probed functions can be called Entry point overwritten with probe: Original function entry point: 0x400113d4: jmp 0x400113d4: push %ebp 0x41481064 0x400113d5: mov %esp,%ebp 0x400113d9: push %ebx 0x400113d7: push %edi Copy of entry point with original 0x400113d8: push %esi bytes: 0x400113d9: push %ebx 0x50000004: push %ebp 0x50000005: mov %esp,%ebp 0x50000007: push %edi 0x50000008: push %esi 0x50000009: jmp 37 Pin Tutorial Academia Sinica 2009
PinProbes Instrumentation Advantages: Low overhead – few percent Less intrusive – execute original code Leverages Pin: – API – Instrumentation engine Disadvantages: More tool writer responsibility Routine-level granularity (RTN) 38 Pin Tutorial Academia Sinica 2009
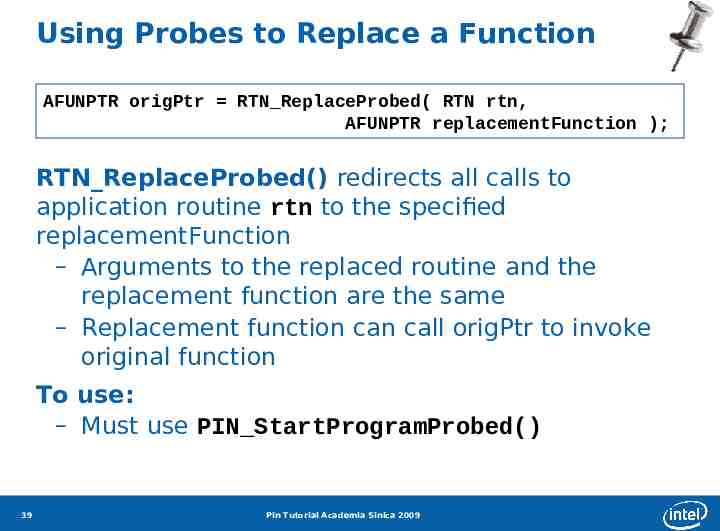
Using Probes to Replace a Function AFUNPTR origPtr RTN ReplaceProbed( RTN rtn, AFUNPTR replacementFunction ); RTN ReplaceProbed() redirects all calls to application routine rtn to the specified replacementFunction – Arguments to the replaced routine and the replacement function are the same – Replacement function can call origPtr to invoke original function To use: – Must use PIN StartProgramProbed() 39 Pin Tutorial Academia Sinica 2009
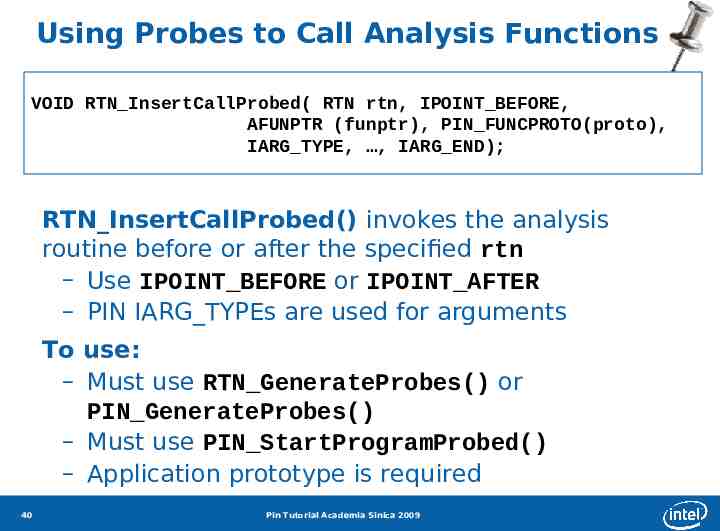
Using Probes to Call Analysis Functions VOID RTN InsertCallProbed( RTN rtn, IPOINT BEFORE, AFUNPTR (funptr), PIN FUNCPROTO(proto), IARG TYPE, , IARG END); RTN InsertCallProbed() invokes the analysis routine before or after the specified rtn – Use IPOINT BEFORE or IPOINT AFTER – PIN IARG TYPEs are used for arguments To use: – Must use RTN GenerateProbes() or PIN GenerateProbes() – Must use PIN StartProgramProbed() – Application prototype is required 40 Pin Tutorial Academia Sinica 2009
Tool Writer Responsibilities No control flow into the instruction space where probe is placed 6 bytes on IA32, 7 bytes on Intel64, 1 bundle on IA64 Branch into “replaced” instructions will fail Probes at function entry point only Thread safety for insertion and deletion of probes During image load callback is safe Only loading thread has a handle to the image Replacement function has same behavior as original 41 Pin Tutorial Academia Sinica 2009
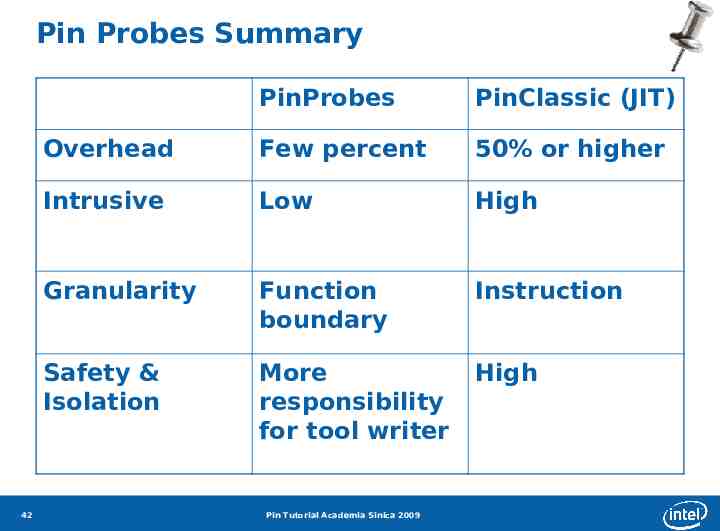
Pin Probes Summary 42 PinProbes PinClassic (JIT) Overhead Few percent 50% or higher Intrusive Low High Granularity Function boundary Instruction Safety & Isolation More responsibility for tool writer High Pin Tutorial Academia Sinica 2009
Pin Applications
Pin Applications Sample tools in the Pin distribution: Cache simulators, branch predictors, address tracer, syscall tracer, edge profiler, stride profiler Some tools developed and used inside Intel: Opcodemix (analyze code generated by compilers) PinPoints (find representative regions in programs to simulate) Companies are writing their own Pintools Universities use Pin in teaching and research 44 Pin Tutorial Academia Sinica 2009
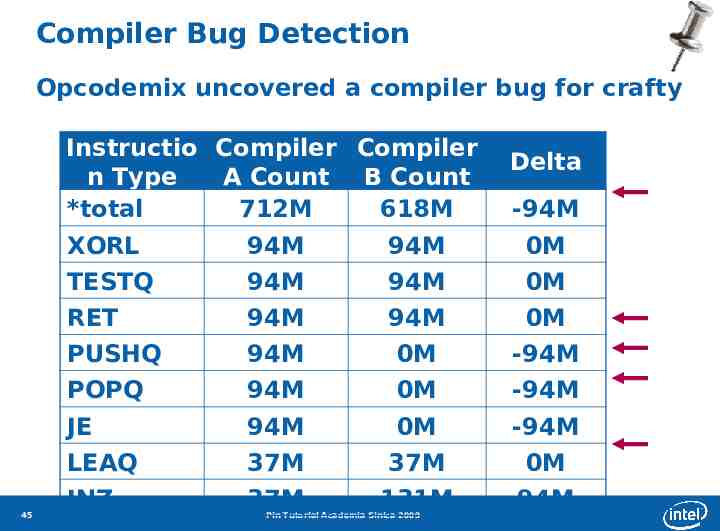
Compiler Bug Detection Opcodemix uncovered a compiler bug for crafty Instructio Compiler Compiler n Type A Count B Count *total 712M 618M 45 Delta -94M XORL 94M 94M 0M TESTQ 94M 94M 0M RET 94M 94M 0M PUSHQ 94M 0M -94M POPQ 94M 0M -94M JE 94M 0M -94M LEAQ 37M 37M 0M JNZ 37M 131M 94M Pin Tutorial Academia Sinica 2009
Thread Checker Basics Detect common parallel programming bugs: Data races, deadlocks, thread stalls, threading API usage violations Instrumentation used: Memory operations Synchronization operations (via function replacement) Call stack Pin-based prototype Runs on Linux, x86 and x86 64 A Pintool 2500 C lines 46 Pin Tutorial Academia Sinica 2009
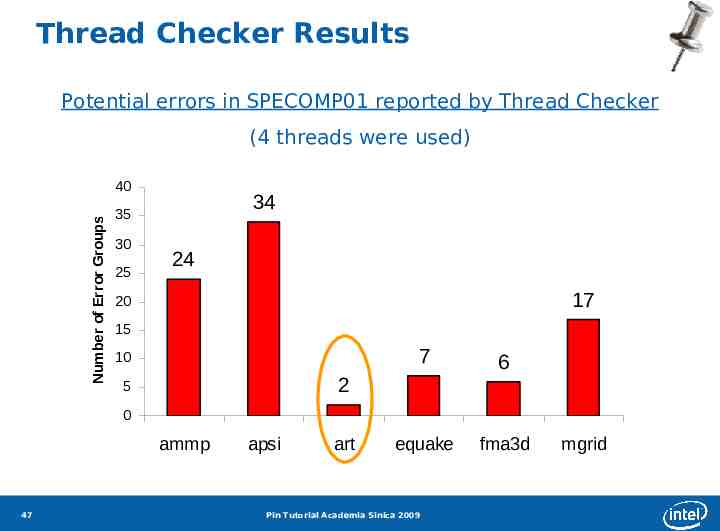
Thread Checker Results Potential errors in SPECOMP01 reported by Thread Checker (4 threads were used) Number of Error Groups 40 34 35 30 25 24 17 20 15 10 7 6 equake fma3d 2 5 0 ammp 47 apsi art Pin Tutorial Academia Sinica 2009 mgrid
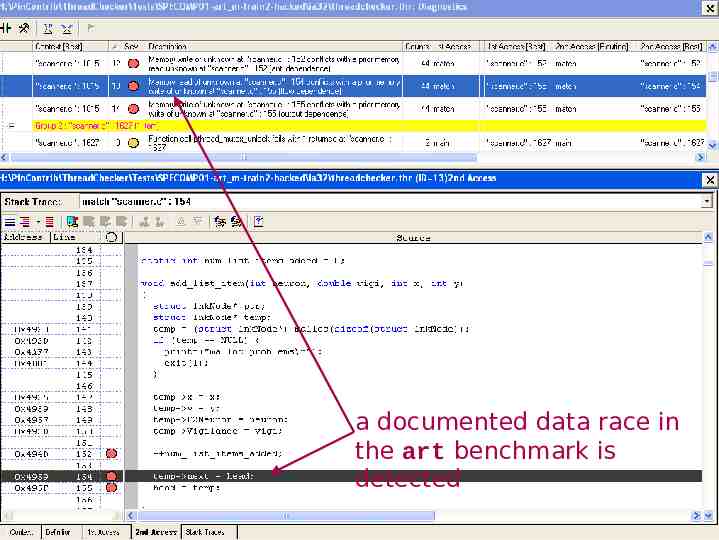
a documented data race in the art benchmark is detected 48 Pin Tutorial Academia Sinica 2009
Instrumentation-Driven Simulation Fast exploratory studies Instrumentation native execution Simulation speeds at MIPS Characterize complex applications E.g. Oracle, Java, parallel data-mining apps Simple to build instrumentation tools Tools can feed simulation models in real time Tools can gather instruction traces for later use 49 Pin Tutorial Academia Sinica 2009
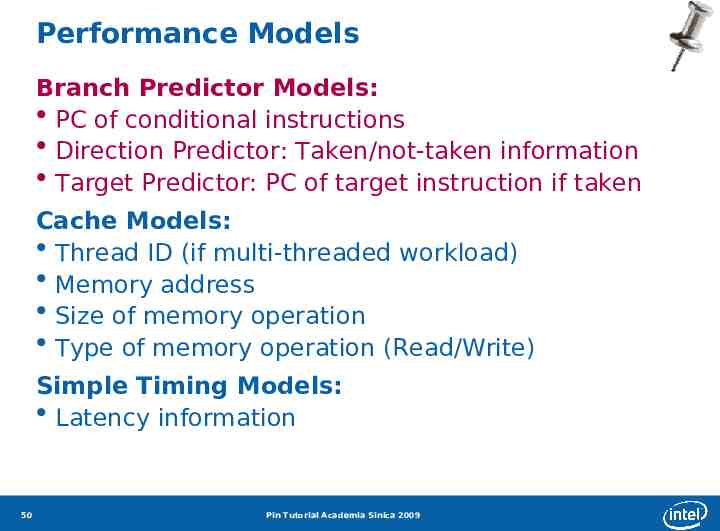
Performance Models Branch Predictor Models: PC of conditional instructions Direction Predictor: Taken/not-taken information Target Predictor: PC of target instruction if taken Cache Models: Thread ID (if multi-threaded workload) Memory address Size of memory operation Type of memory operation (Read/Write) Simple Timing Models: Latency information 50 Pin Tutorial Academia Sinica 2009
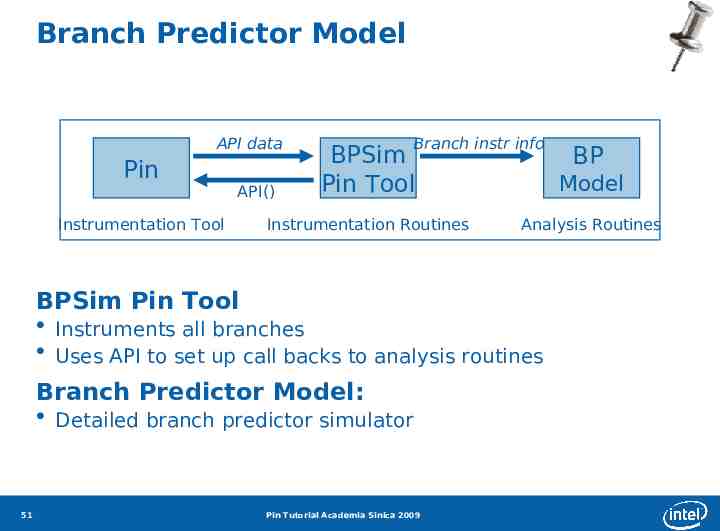
Branch Predictor Model API data Pin Instrumentation Tool Branch instr info BPSim Pin Tool Model Instrumentation Routines Analysis Routines API() BPSim Pin Tool Instruments all branches Uses API to set up call backs to analysis routines Branch Predictor Model: Detailed branch predictor simulator 51 Pin Tutorial Academia Sinica 2009 BP
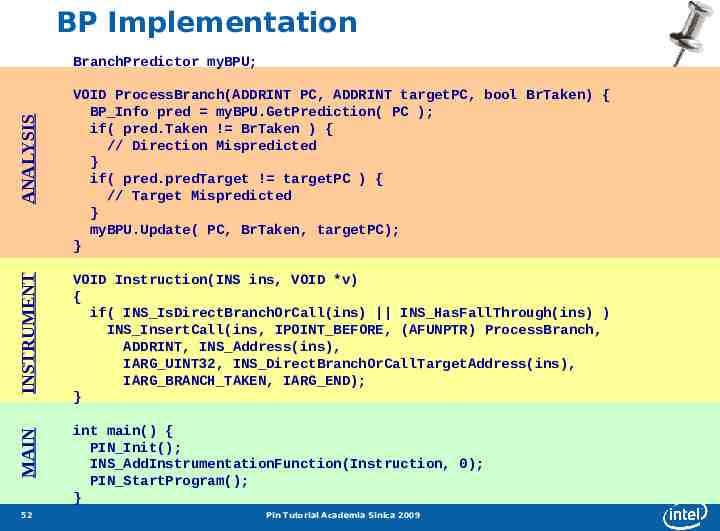
BP Implementation INSTRUMENT VOID ProcessBranch(ADDRINT PC, ADDRINT targetPC, bool BrTaken) { BP Info pred myBPU.GetPrediction( PC ); if( pred.Taken ! BrTaken ) { // Direction Mispredicted } if( pred.predTarget ! targetPC ) { // Target Mispredicted } myBPU.Update( PC, BrTaken, targetPC); } VOID Instruction(INS ins, VOID *v) { if( INS IsDirectBranchOrCall(ins) INS HasFallThrough(ins) ) INS InsertCall(ins, IPOINT BEFORE, (AFUNPTR) ProcessBranch, ADDRINT, INS Address(ins), IARG UINT32, INS DirectBranchOrCallTargetAddress(ins), IARG BRANCH TAKEN, IARG END); } MAIN ANALYSIS BranchPredictor myBPU; int main() { PIN Init(); INS AddInstrumentationFunction(Instruction, 0); PIN StartProgram(); } 52 Pin Tutorial Academia Sinica 2009
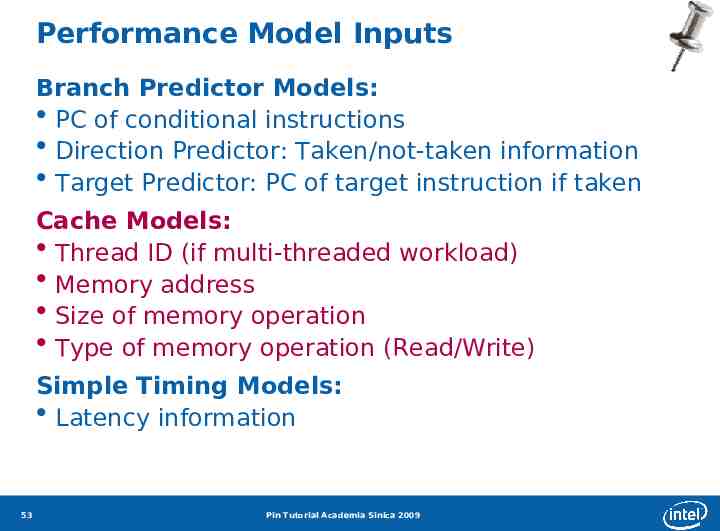
Performance Model Inputs Branch Predictor Models: PC of conditional instructions Direction Predictor: Taken/not-taken information Target Predictor: PC of target instruction if taken Cache Models: Thread ID (if multi-threaded workload) Memory address Size of memory operation Type of memory operation (Read/Write) Simple Timing Models: Latency information 53 Pin Tutorial Academia Sinica 2009
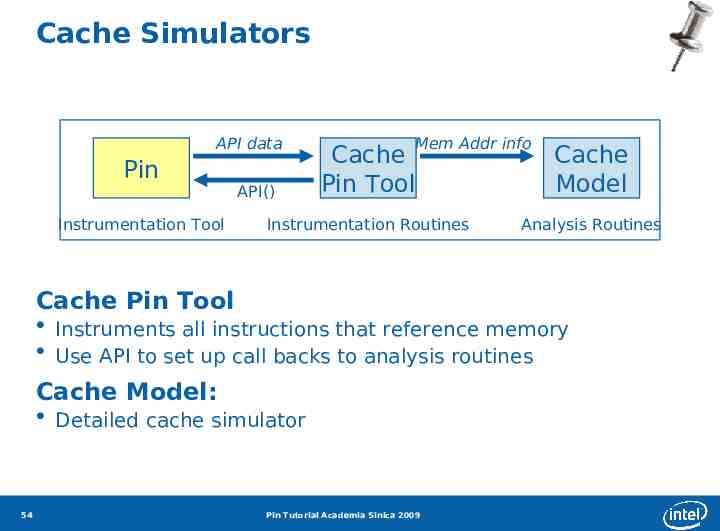
Cache Simulators API data Pin Instrumentation Tool Mem Addr info Cache Pin Tool Cache Model Instrumentation Routines Analysis Routines API() Cache Pin Tool Instruments all instructions that reference memory Use API to set up call backs to analysis routines Cache Model: Detailed cache simulator 54 Pin Tutorial Academia Sinica 2009
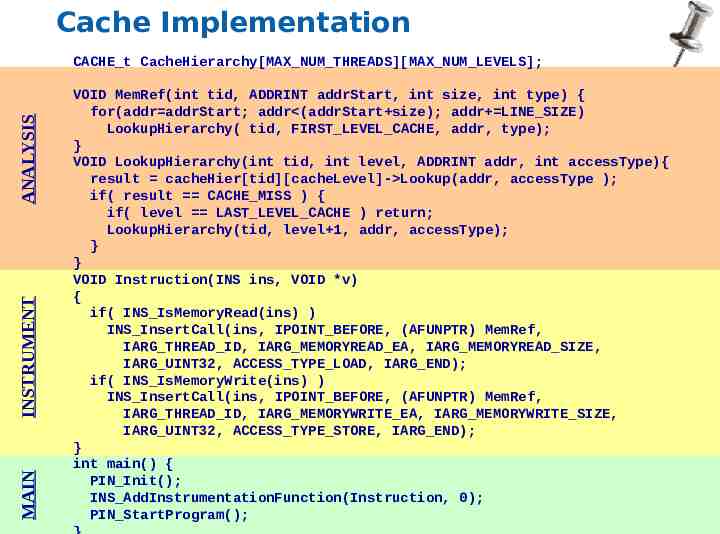
Cache Implementation MAIN INSTRUMENT ANALYSIS CACHE t CacheHierarchy[MAX NUM THREADS][MAX NUM LEVELS]; 55 VOID MemRef(int tid, ADDRINT addrStart, int size, int type) { for(addr addrStart; addr (addrStart size); addr LINE SIZE) LookupHierarchy( tid, FIRST LEVEL CACHE, addr, type); } VOID LookupHierarchy(int tid, int level, ADDRINT addr, int accessType){ result cacheHier[tid][cacheLevel]- Lookup(addr, accessType ); if( result CACHE MISS ) { if( level LAST LEVEL CACHE ) return; LookupHierarchy(tid, level 1, addr, accessType); } } VOID Instruction(INS ins, VOID *v) { if( INS IsMemoryRead(ins) ) INS InsertCall(ins, IPOINT BEFORE, (AFUNPTR) MemRef, IARG THREAD ID, IARG MEMORYREAD EA, IARG MEMORYREAD SIZE, IARG UINT32, ACCESS TYPE LOAD, IARG END); if( INS IsMemoryWrite(ins) ) INS InsertCall(ins, IPOINT BEFORE, (AFUNPTR) MemRef, IARG THREAD ID, IARG MEMORYWRITE EA, IARG MEMORYWRITE SIZE, IARG UINT32, ACCESS TYPE STORE, IARG END); } int main() { PIN Init(); INS AddInstrumentationFunction(Instruction, 0); PIN StartProgram(); Pin Tutorial Academia Sinica 2009
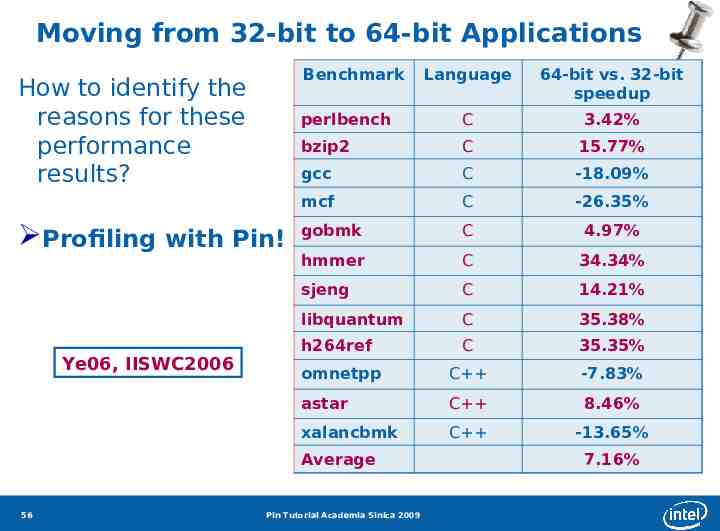
Moving from 32-bit to 64-bit Applications Benchmark How to identify the reasons for these performance results? Profiling with Pin! Ye06, IISWC2006 Language 64-bit vs. 32-bit speedup perlbench C 3.42% bzip2 C 15.77% gcc C -18.09% mcf C -26.35% gobmk C 4.97% hmmer C 34.34% sjeng C 14.21% libquantum C 35.38% h264ref C 35.35% omnetpp C -7.83% astar C 8.46% xalancbmk C -13.65% Average 56 Pin Tutorial Academia Sinica 2009 7.16%
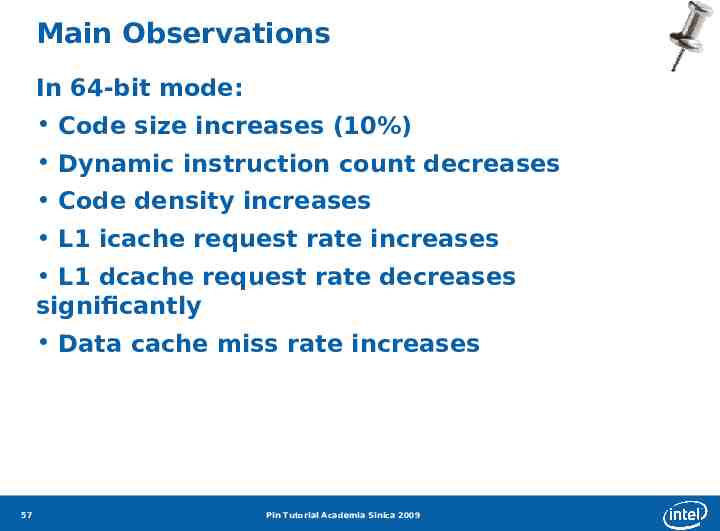
Main Observations In 64-bit mode: Code size increases (10%) Dynamic instruction count decreases Code density increases L1 icache request rate increases L1 dcache request rate decreases significantly Data cache miss rate increases 57 Pin Tutorial Academia Sinica 2009
Instrumentation-Based Simulation Simple compared to detailed models Can easily run complex applications Provides insight on workload behavior over their entire runs in a reasonable amount of time Illustrated the use of Pin for: Program Analysis – Bug detection, thread analysis Computer architecture – Branch predictors, cache simulators, timing models, architecture width Architecture changes – Moving from 32-bit to 64-bit 58 Pin Tutorial Academia Sinica 2009