NAIC 2020 Insurance Summit Financial Keynote Presentation Sean


53 Slides8.26 MB
NAIC 2020 Insurance Summit Financial Keynote Presentation Sean Kevelighan Chief Executive Officer September 8, 2020 Insurance Information Institute 110 William Street New York, NY 10038 [email protected] 212.346.5520 www.iii.org 2 0 2 0 NAIC INSURANCE SUMMIT
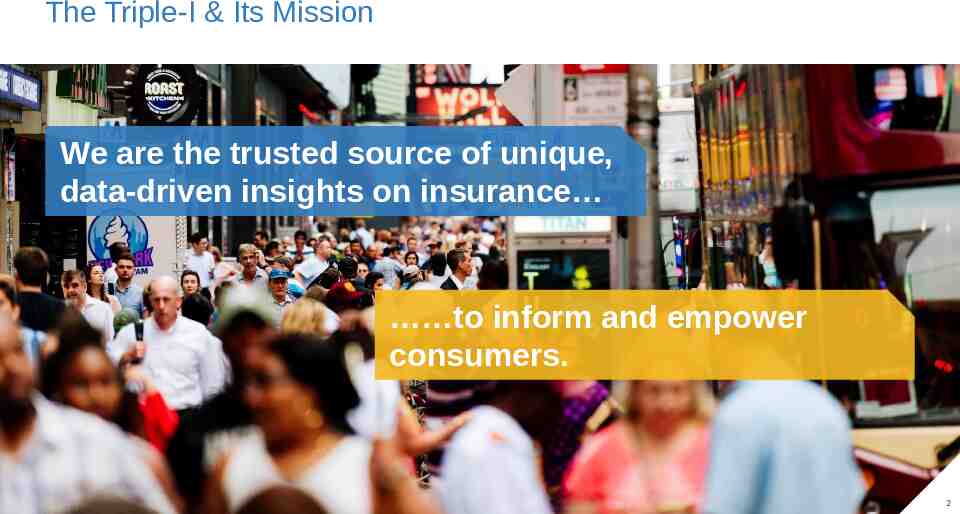
The Triple-I & Its Mission We are the trusted source of unique, A world with MORE insurance data-driven insights on insurance to inform and empower consumers. 2020 NAIC INSURANCE SUMMIT 2
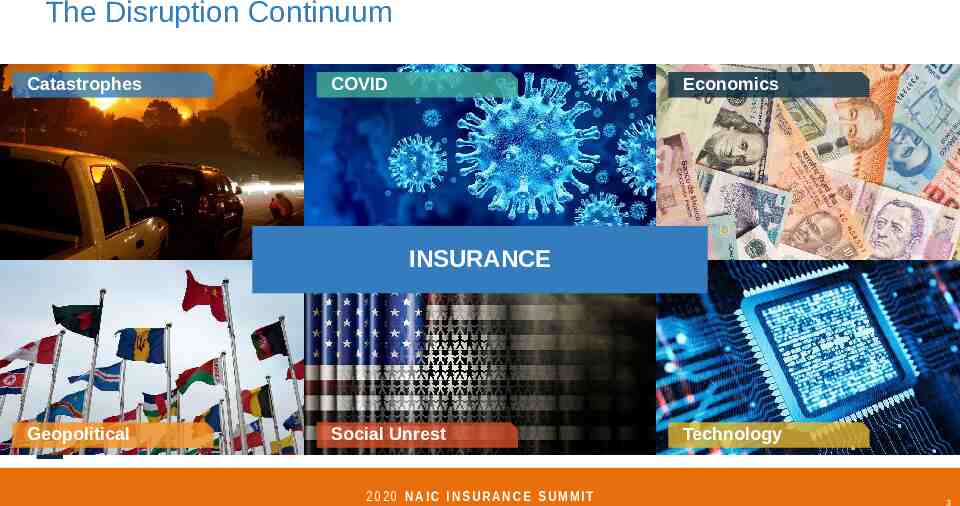
The Disruption Continuum Catastrophes COVID Economics INSURANCE Geopolitical Social Unrest 2020 NAIC INSURANCE SUMMIT Technology 3
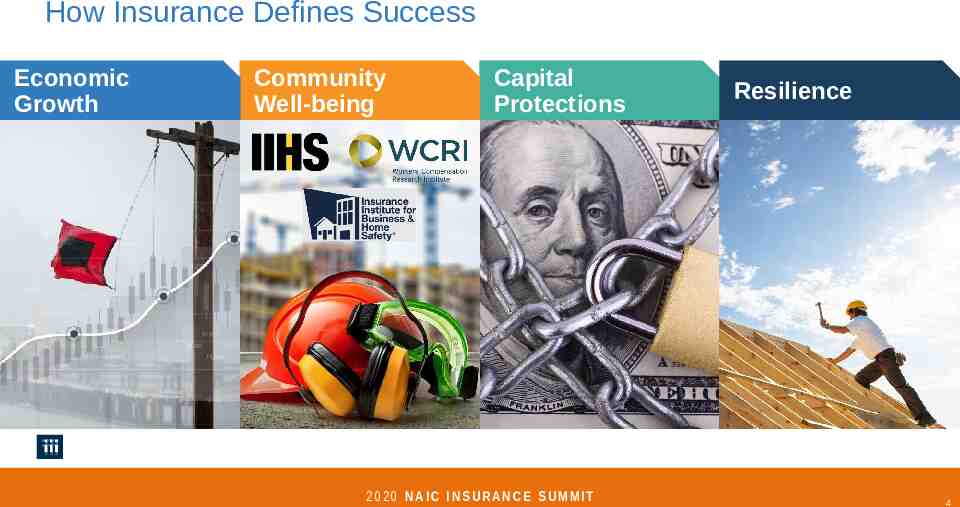
How Insurance Defines Success Economic Growth Community Well-being Capital Protections 2020 NAIC INSURANCE SUMMIT Resilience 4
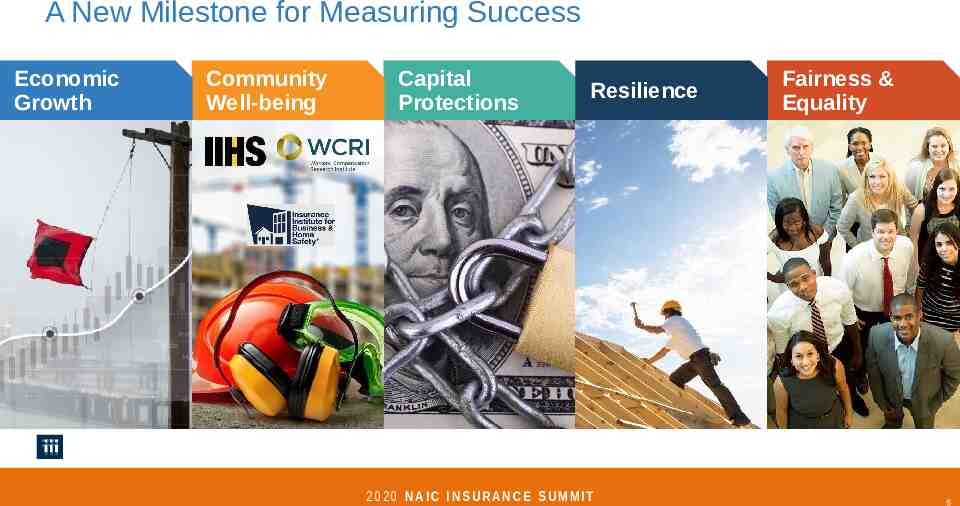
A New Milestone for Measuring Success Economic Growth Community Well-being Capital Protections Resilience 2020 NAIC INSURANCE SUMMIT Fairness & Equality 5
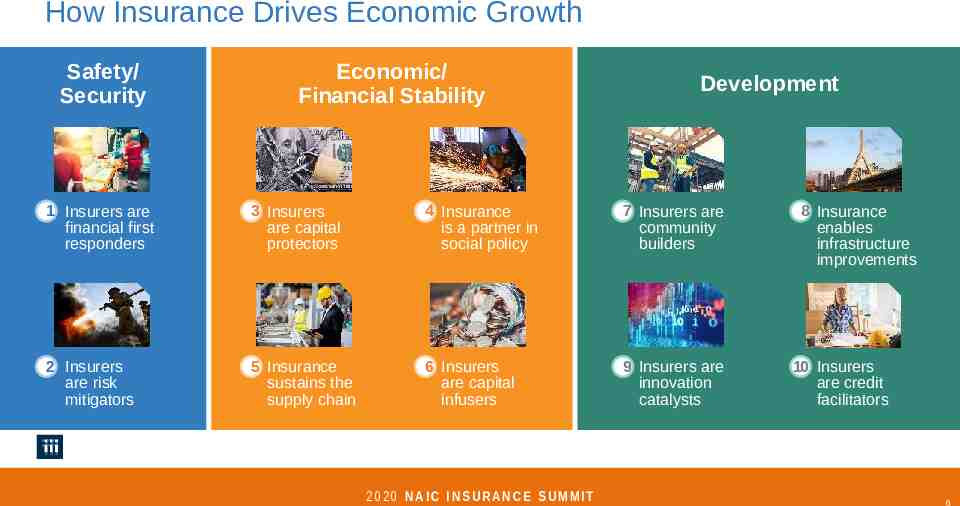
How Insurance Drives Economic Growth Safety/ Security Economic/ Financial Stability Development 1 Insurers are financial first responders 3 Insurers are capital protectors 4 Insurance is a partner in social policy 7 Insurers are community builders 2 Insurers are risk mitigators 5 Insurance sustains the supply chain 6 Insurers are capital infusers 9 Insurers are innovation catalysts 2020 NAIC INSURANCE SUMMIT 8 Insurance enables infrastructure improvements 10 Insurers are credit facilitators 6
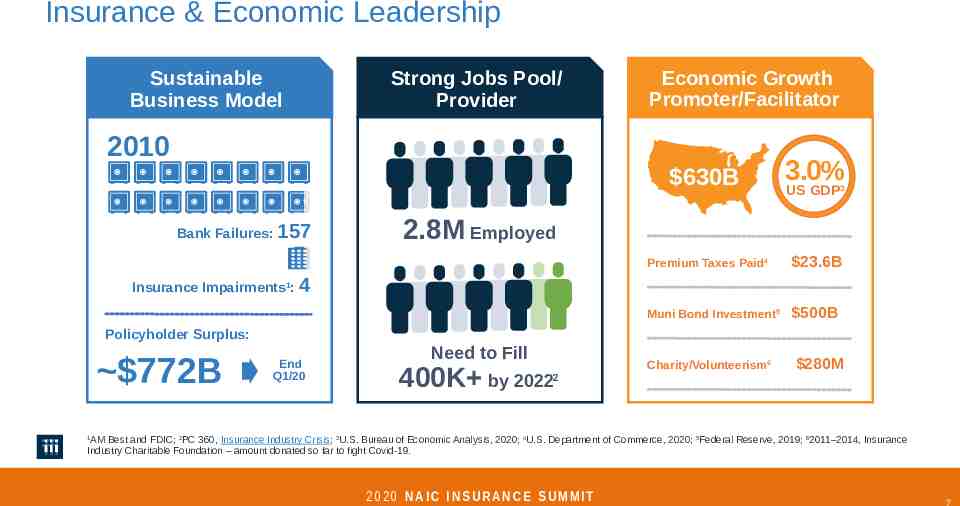
Insurance & Economic Leadership Sustainable Business Model Strong Jobs Pool/ Provider Economic Growth Promoter/Facilitator 2010 Bank Failures: 157 630B 3.0% Premium Taxes Paid4 23.6B Muni Bond Investment5 500B US GDP3 2.8M Employed Insurance Impairments1: 4 Policyholder Surplus: 772B End Q1/20 Need to Fill 400K by 2022 2 Charity/Volunteerism6 280M AM Best and FDIC; 2PC 360, Insurance Industry Crisis; 3U.S. Bureau of Economic Analysis, 2020; 4U.S. Department of Commerce, 2020; 5Federal Reserve, 2019; 62011–2014, Insurance Industry Charitable Foundation – amount donated so far to fight Covid-19. 1 2020 NAIC INSURANCE SUMMIT 7
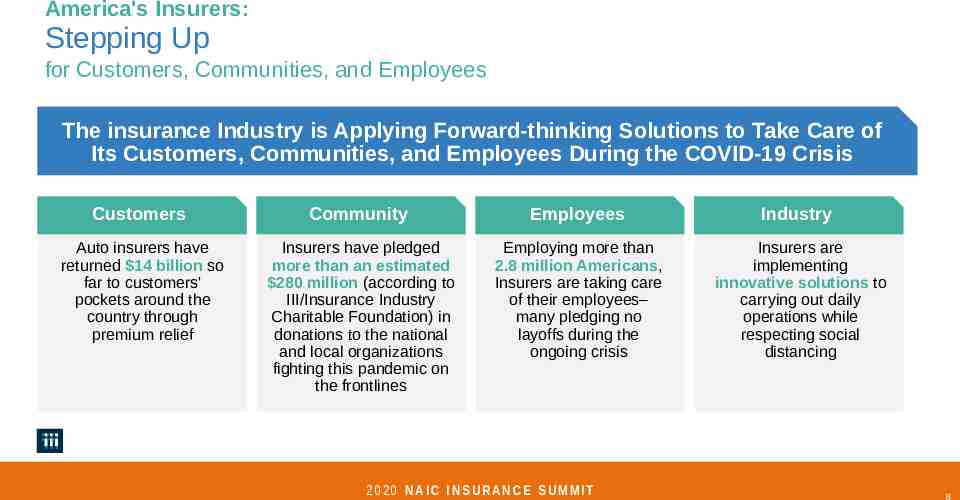
America's Insurers: Stepping Up for Customers, Communities, and Employees The insurance Industry is Applying Forward-thinking Solutions to Take Care of Its Customers, Communities, and Employees During the COVID-19 Crisis Customers Community Employees Industry Auto insurers have returned 14 billion so far to customers' pockets around the country through premium relief Insurers have pledged more than an estimated 280 million (according to III/Insurance Industry Charitable Foundation) in donations to the national and local organizations fighting this pandemic on the frontlines Employing more than 2.8 million Americans, Insurers are taking care of their employees– many pledging no layoffs during the ongoing crisis Insurers are implementing innovative solutions to carrying out daily operations while respecting social distancing 2020 NAIC INSURANCE SUMMIT 8
Underwriting Trends 2 0 2 0 NAIC INSURANCE SUMMIT
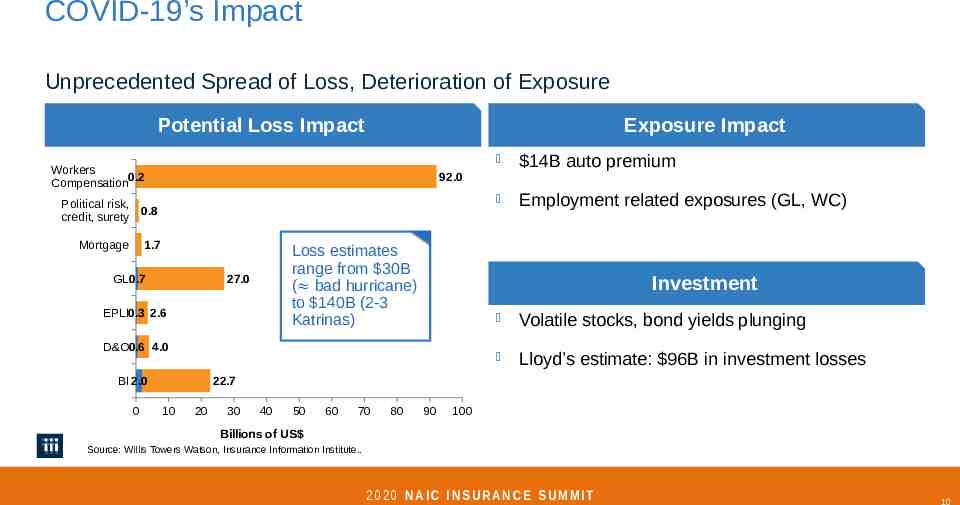
COVID-19’s Impact Unprecedented Spread of Loss, Deterioration of Exposure Potential Loss Impact Exposure Impact Workers 0.2 Compensation Political risk, credit, surety 0.8 Mortgage 1.7 14B auto premium Employment related exposures (GL, WC) 92.0 GL0.7 Loss estimates range from 30B ( bad hurricane) to 140B (2-3 Katrinas) 27.0 EPLI0.3 2.6 Investment D&O0.6 4.0 BI 2.0 0 Volatile stocks, bond yields plunging Lloyd’s estimate: 96B in investment losses 22.7 10 20 30 40 50 60 70 80 90 100 Billions of US Source: Willis Towers Watson, Insurance Information Institute. 2020 NAIC INSURANCE SUMMIT 10
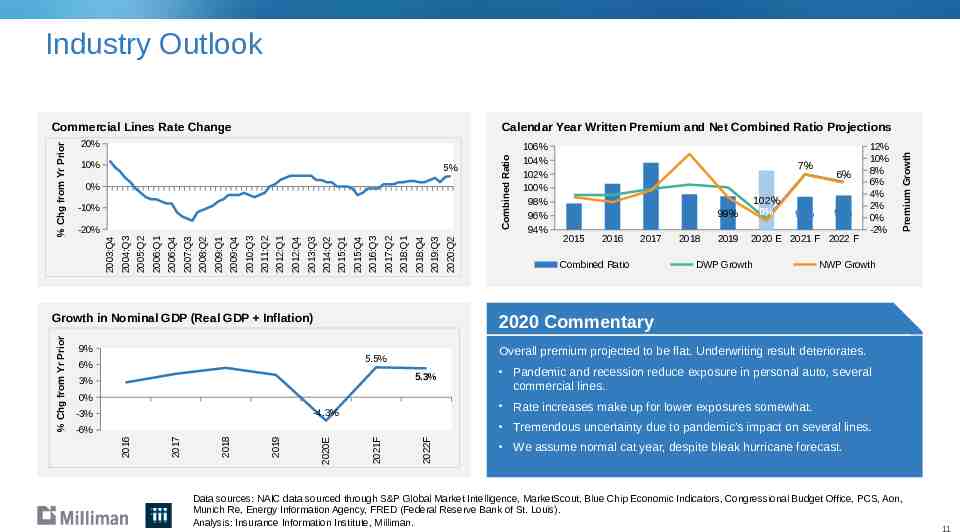
Industry Outlook 5% 0% -10% 5.3% 3% 0% -4.3% 2022F 2021F 2020E 2019 2018 -6% 2017 2015 2016 2017 Combined Ratio 2018 6% 99% 102% 0% 2019 2020 E 2021 F 2022 F 99% DWP Growth 99% NWP Growth Overall premium projected to be flat. Underwriting result deteriorates. 5.5% 6% -3% 7% 12% 10% 8% 6% 4% 2% 0% -2% 2020 Commentary 9% 2016 % Chg from Yr Prior Growth in Nominal GDP (Real GDP Inflation) 2020:Q2 2019:Q3 2018:Q4 2018:Q1 2017:Q2 2016:Q3 2015:Q4 2015:Q1 2014:Q2 2013:Q3 2012:Q4 2012:Q1 2011:Q2 2010:Q3 2009:Q4 2009:Q1 2008:Q2 2007:Q3 2006:Q4 2006:Q1 2005:Q2 2004:Q3 -20% Combined Ratio 10% 106% 104% 102% 100% 98% 96% 94% Premium Growth Calendar Year Written Premium and Net Combined Ratio Projections 20% 2003:Q4 % Chg from Yr Prior Commercial Lines Rate Change Pandemic and recession reduce exposure in personal auto, several commercial lines. Rate increases make up for lower exposures somewhat. Tremendous uncertainty due to pandemic’s impact on several lines. We assume normal cat year, despite bleak hurricane forecast. Data sources: NAIC data sourced through S&P Global Market Intelligence, MarketScout, Blue Chip Economic Indicators, Congressional Budget Office, PCS, Aon, Munich Re, Energy Information Agency, FRED (Federal Reserve Bank of St. Louis). Analysis: Insurance Information Institute, Milliman. 11
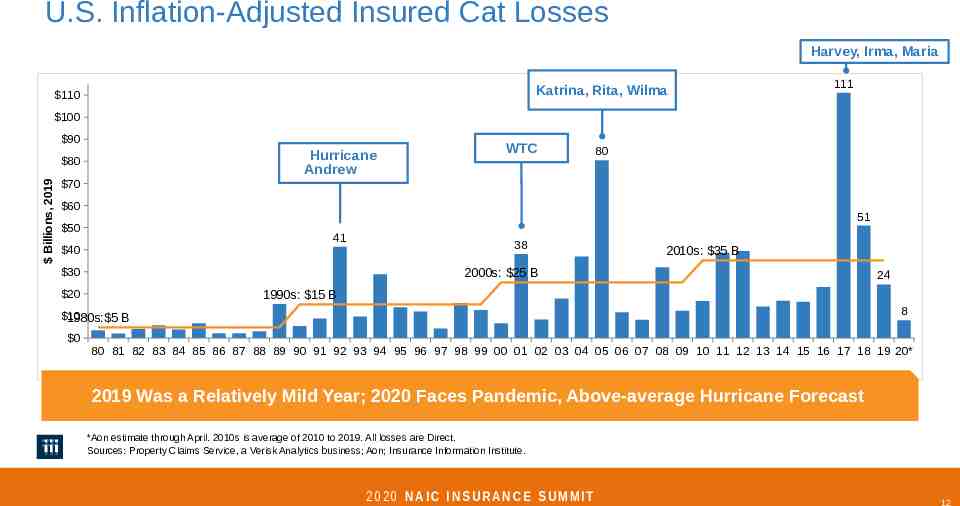
U.S. Inflation-Adjusted Insured Cat Losses Harvey, Irma, Maria Katrina, Rita, Wilma 110 111 100 90 Hurricane Andrew Billions, 2019 80 70 WTC 80 60 51 50 41 40 38 2010s: 35 B 2000s: 25 B 30 1990s: 15 B 20 8 10 1980s: 5 B 0 24 80 81 82 83 84 85 86 87 88 89 90 91 92 93 94 95 96 97 98 99 00 01 02 03 04 05 06 07 08 09 10 11 12 13 14 15 16 17 18 19 20* 2019 Was a Relatively Mild Year; 2020 Faces Pandemic, Above-average Hurricane Forecast *Aon estimate through April. 2010s is average of 2010 to 2019. All losses are Direct. Sources: Property Claims Service, a Verisk Analytics business; Aon; Insurance Information Institute. 2020 NAIC INSURANCE SUMMIT 12
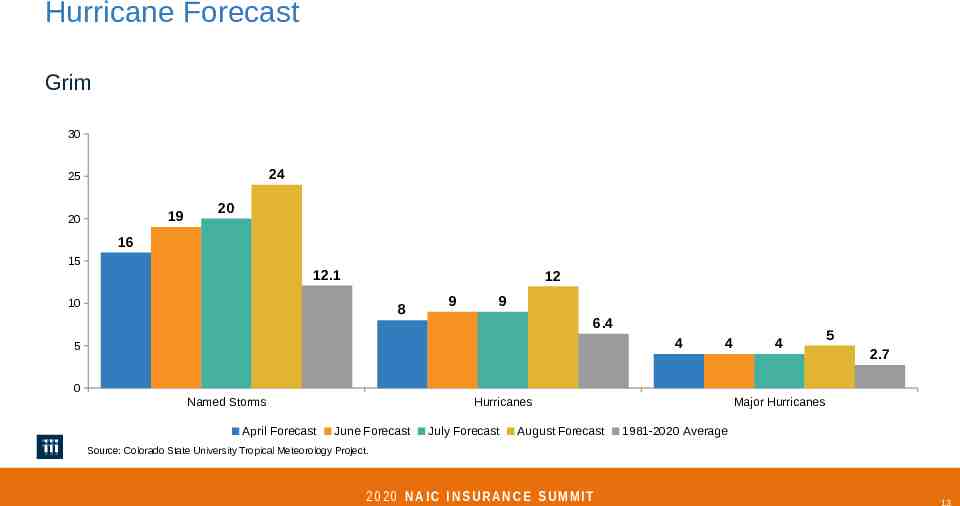
Hurricane Forecast Grim 30 24 25 19 20 20 16 15 12.1 12 10 8 9 9 6.4 4 5 4 4 5 2.7 0 Named Storms April Forecast Hurricanes June Forecast July Forecast August Forecast Major Hurricanes 1981-2020 Average Source: Colorado State University Tropical Meteorology Project. 2020 NAIC INSURANCE SUMMIT 13
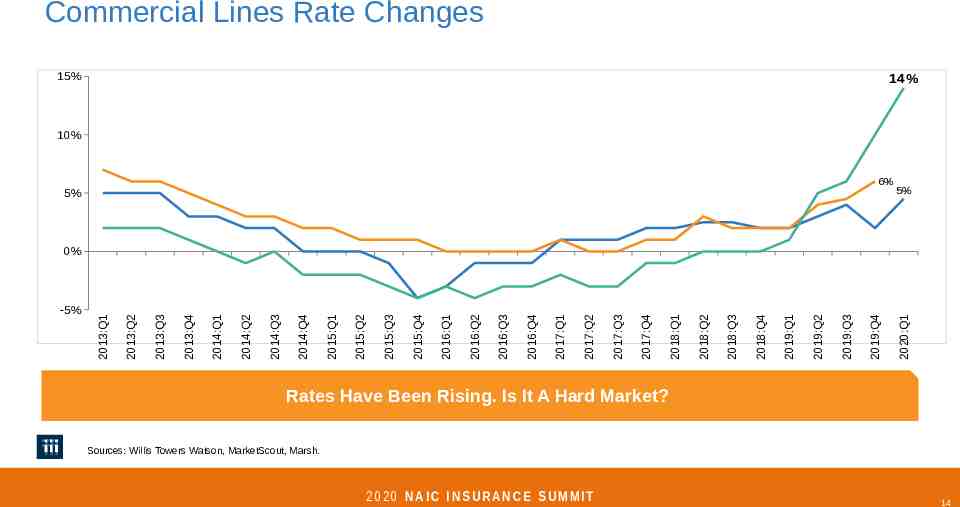
-5% 2020 NAIC INSURANCE SUMMIT 15% 6% 2020:Q1 5% 2019:Q4 2019:Q3 2019:Q2 2019:Q1 2018:Q4 2018:Q3 2018:Q2 2018:Q1 2017:Q4 2017:Q3 2017:Q2 2017:Q1 2016:Q4 2016:Q3 2016:Q2 2016:Q1 2015:Q4 2015:Q3 2015:Q2 2015:Q1 2014:Q4 2014:Q3 2014:Q2 2014:Q1 2013:Q4 2013:Q3 2013:Q2 2013:Q1 Commercial Lines Rate Changes 14% 10% 5% 0% Rates Have Been Rising. Is It A Hard Market? Sources: Willis Towers Watson, MarketScout, Marsh. 14
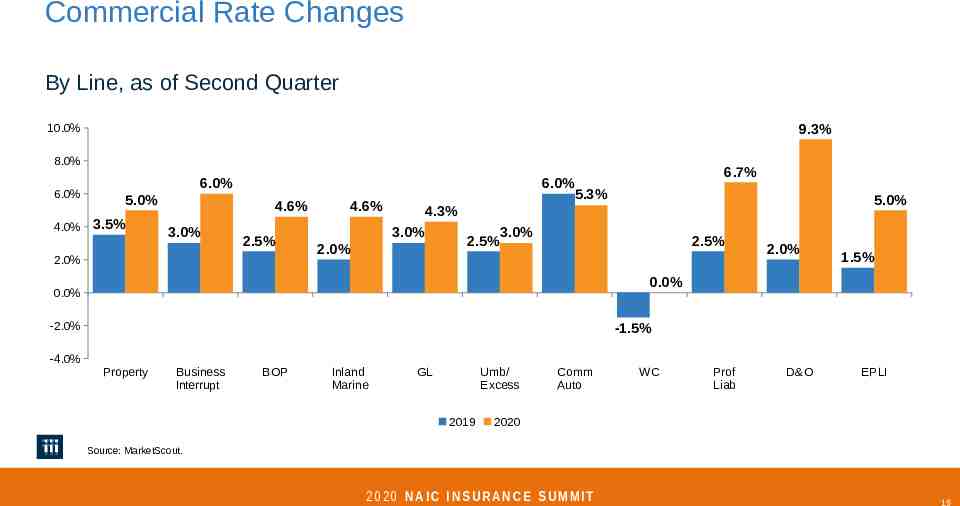
Commercial Rate Changes By Line, as of Second Quarter 9.3% 10.0% 8.0% 6.0% 6.0% 5.0% 4.0% 3.5% 4.6% 3.0% 2.5% 2.0% 4.6% 6.7% 6.0% 5.3% 5.0% 4.3% 3.0% 2.0% 3.0% 2.5% 2.5% 2.0% 1.5% 0.0% 0.0% -2.0% -1.5% -4.0% Property Business Interrupt BOP Inland Marine GL Umb/ Excess 2019 Comm Auto WC Prof Liab D&O EPLI 2020 Source: MarketScout. 2020 NAIC INSURANCE SUMMIT 15
Financial Trends 2 0 2 0 NAIC INSURANCE SUMMIT
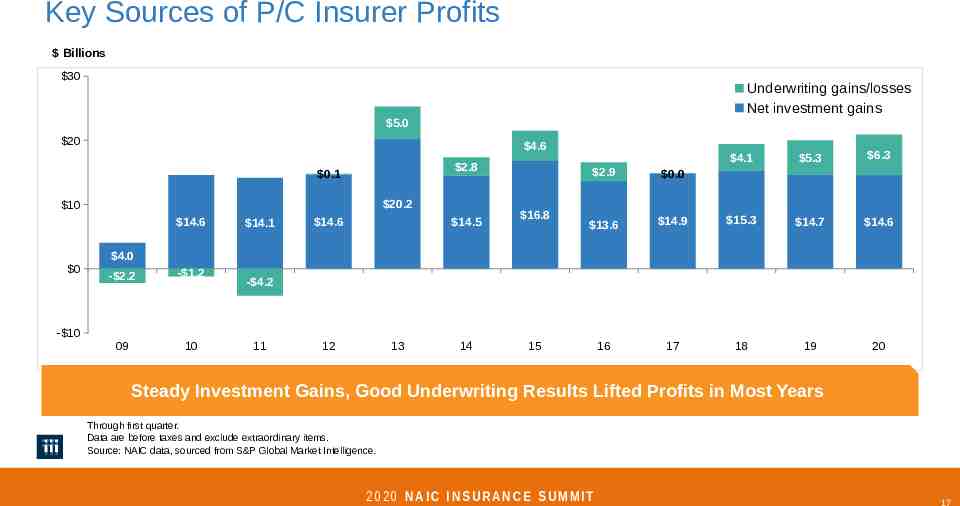
Key Sources of P/C Insurer Profits Billions 30 Underwriting gains/losses Net investment gains 5.0 20 4.6 2.8 0.1 20.2 10 14.6 0 14.1 14.6 14.5 16.8 4.1 5.3 6.3 2.9 0.0 13.6 14.9 15.3 14.7 14.6 16 17 18 19 20 4.0 - 2.2 - 1.2 09 10 - 4.2 - 10 11 12 13 14 15 Steady Investment Gains, Good Underwriting Results Lifted Profits in Most Years Through first quarter. Data are before taxes and exclude extraordinary items. Source: NAIC data, sourced from S&P Global Market Intelligence. 2020 NAIC INSURANCE SUMMIT 17
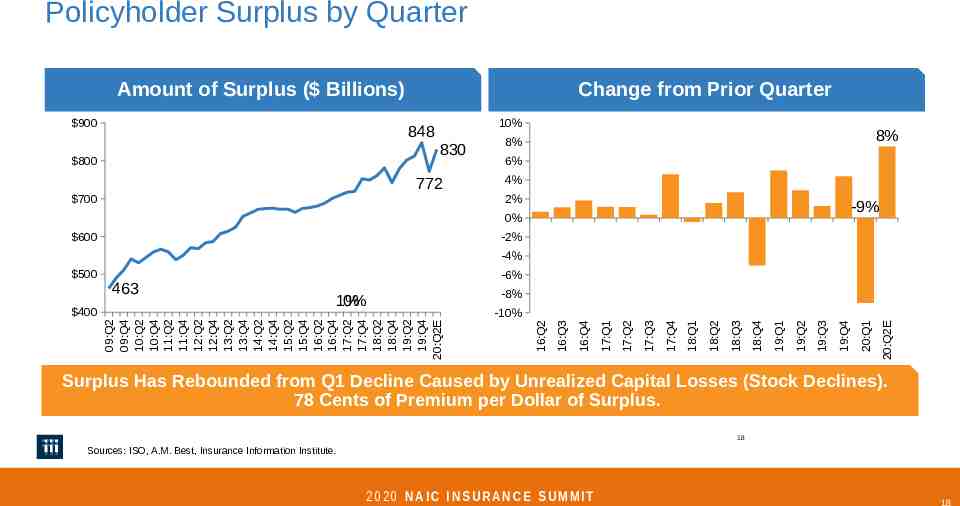
Policyholder Surplus by Quarter Amount of Surplus ( Billions) 900 Change from Prior Quarter 10% 848 830 800 772 700 8% 8% 6% 4% 2% -9% 0% 600 -2% -4% -8% 20:Q2E 20:Q1 19:Q4 19:Q3 19:Q2 19:Q1 18:Q4 18:Q3 18:Q2 18:Q1 17:Q4 17:Q3 17:Q2 17:Q1 16:Q4 -10% 16:Q3 1% 0% 09:Q2 09:Q4 10:Q2 10:Q4 11:Q2 11:Q4 12:Q2 12:Q4 13:Q2 13:Q4 14:Q2 14:Q4 15:Q2 15:Q4 16:Q2 16:Q4 17:Q2 17:Q4 18:Q2 18:Q4 19:Q2 19:Q4 20:Q2E 400 463 -6% 16:Q2 500 Surplus Has Rebounded from Q1 Decline Caused by Unrealized Capital Losses (Stock Declines). 78 Cents of Premium per Dollar of Surplus. 18 Sources: ISO, A.M. Best, Insurance Information Institute. 2020 NAIC INSURANCE SUMMIT 18
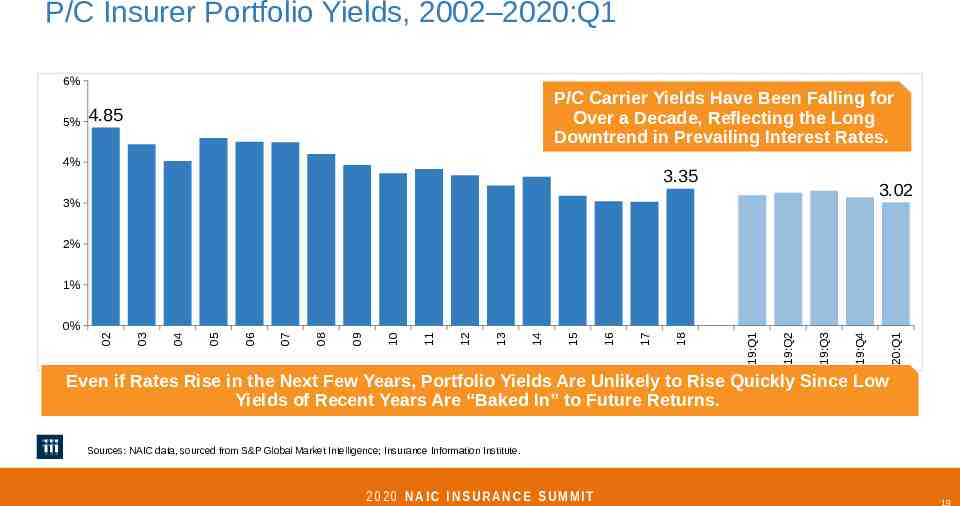
P/C Insurer Portfolio Yields, 2002–2020:Q1 6% 5% P/C Carrier Yields Have Been Falling for Over a Decade, Reflecting the Long Downtrend in Prevailing Interest Rates. 4.85 4% 3.35 3.02 3% 2% 1% 20:Q1 19:Q4 19:Q3 19:Q2 19:Q1 18 17 16 15 14 13 12 11 10 09 08 07 06 05 04 03 02 0% Even if Rates Rise in the Next Few Years, Portfolio Yields Are Unlikely to Rise Quickly Since Low Yields of Recent Years Are “Baked In” to Future Returns. Sources: NAIC data, sourced from S&P Global Market Intelligence; Insurance Information Institute. 2020 NAIC INSURANCE SUMMIT 19
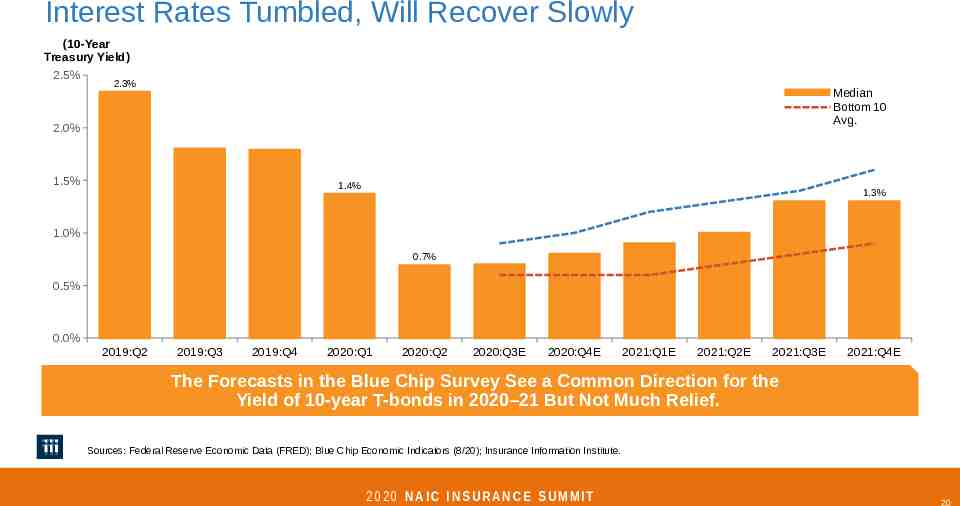
Interest Rates Tumbled, Will Recover Slowly (10-Year Treasury Yield) 2.5% 2.3% Median Bottom 10 Avg. 2.0% 1.5% 1.4% 1.3% 1.0% 0.7% 0.5% 0.0% 2019:Q2 2019:Q3 2019:Q4 2020:Q1 2020:Q2 2020:Q3E 2020:Q4E 2021:Q1E 2021:Q2E 2021:Q3E 2021:Q4E The Forecasts in the Blue Chip Survey See a Common Direction for the Yield of 10-year T-bonds in 2020–21 But Not Much Relief. Sources: Federal Reserve Economic Data (FRED); Blue Chip Economic Indicators (8/20); Insurance Information Institute. 2020 NAIC INSURANCE SUMMIT 20
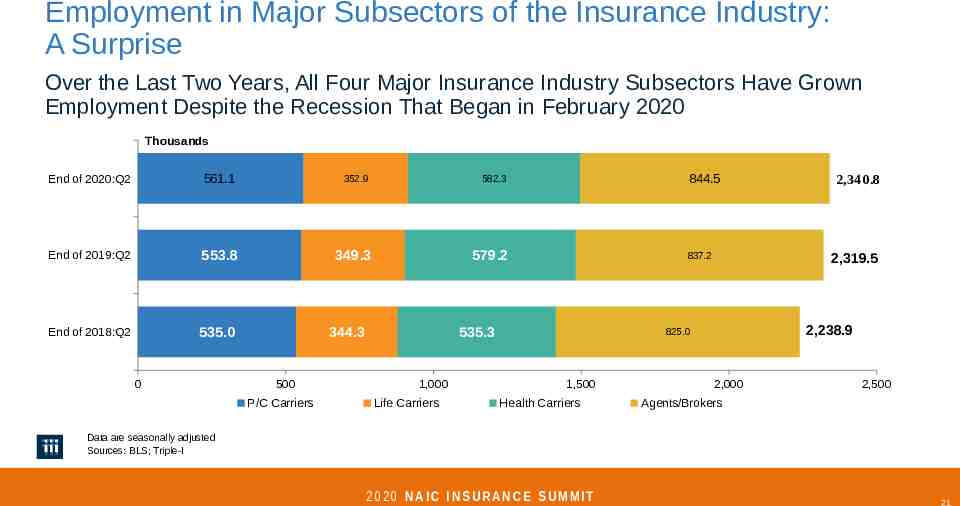
Employment in Major Subsectors of the Insurance Industry: A Surprise Over the Last Two Years, All Four Major Insurance Industry Subsectors Have Grown Employment Despite the Recession That Began in February 2020 Thousands End of 2020:Q2 561.1 352.9 582.3 End of 2019:Q2 553.8 349.3 579.2 End of 2018:Q2 535.0 0 344.3 500 P/C Carriers 844.5 837.2 535.3 1,000 Life Carriers 2,319.5 2,238.9 825.0 1,500 Health Carriers 2,340.8 2,000 2,500 Agents/Brokers Data are seasonally adjusted Sources: BLS; Triple-I 2020 NAIC INSURANCE SUMMIT 21
COVID-19 Economic and Cultural Impacts: An Industry’s Response 2 0 2 0 NAIC INSURANCE SUMMIT
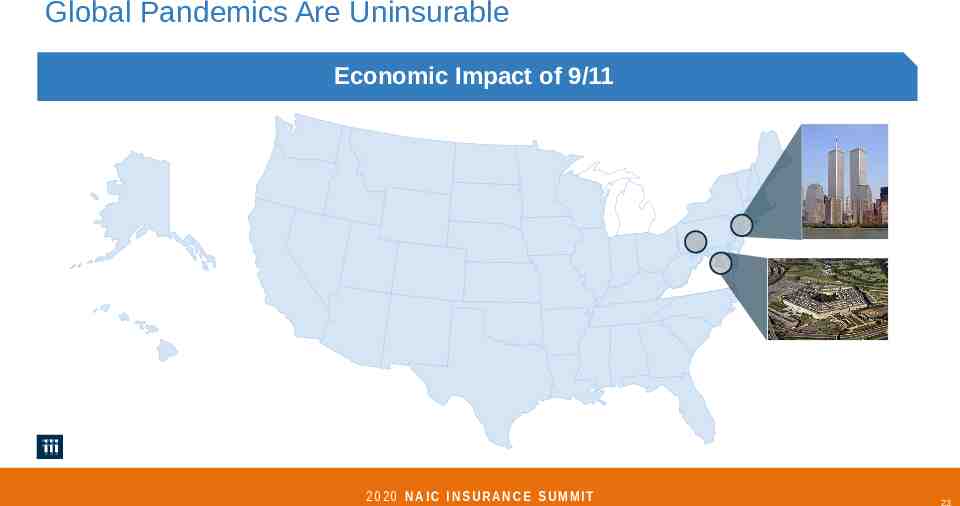
Global Pandemics Are Uninsurable Economic Impact of 9/11 2020 NAIC INSURANCE SUMMIT 23
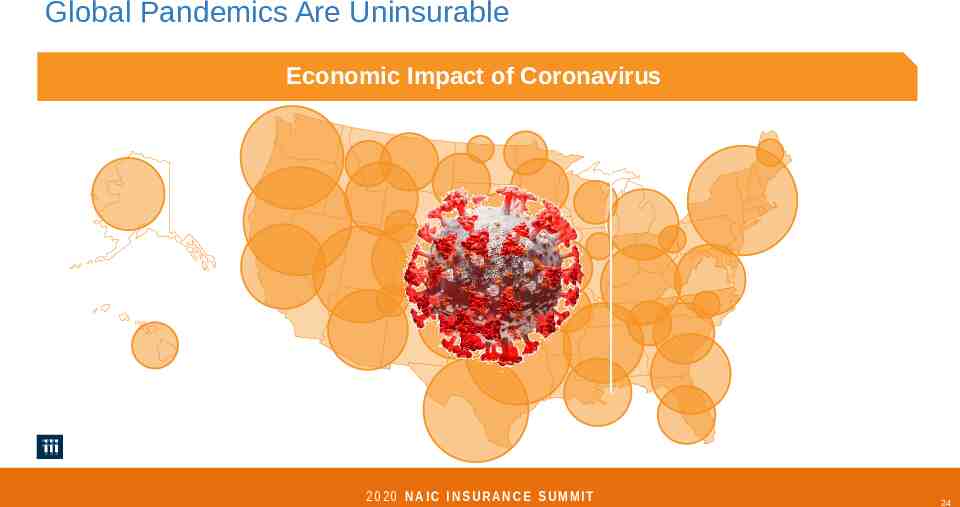
Global Pandemics Are Uninsurable Economic Impact of Coronavirus 2020 NAIC INSURANCE SUMMIT 24
Adopting and Adapting: Workarounds in the Workflow Zoom Meetings Restaurant Take Out Staying Home 2020 NAIC INSURANCE SUMMIT Social Distancing 25
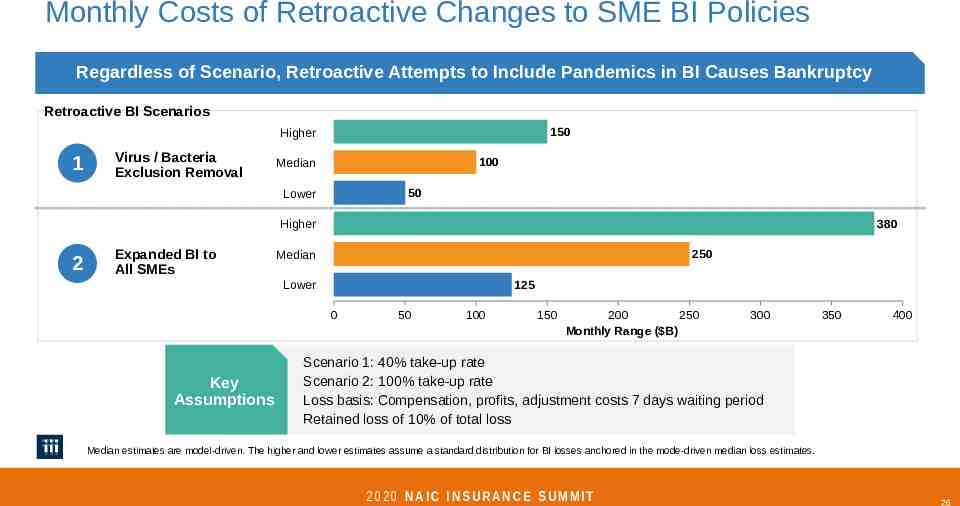
Monthly Costs of Retroactive Changes to SME BI Policies Regardless of Scenario, Retroactive Attempts to Include Pandemics in BI Causes Bankruptcy Retroactive BI Scenarios 150 Higher 1 Virus / Bacteria Exclusion Removal 100 Median 50 Lower 380 Higher 2 Expanded BI to All SMEs 250 Median 125 Lower 0 Key Assumptions 50 100 150 200 250 Monthly Range ( B) 300 350 400 Scenario 1: 40% take-up rate Scenario 2: 100% take-up rate Loss basis: Compensation, profits, adjustment costs 7 days waiting period Retained loss of 10% of total loss Median estimates are model-driven. The higher and lower estimates assume a standard distribution for BI losses anchored in the mode-driven median loss estimates. 2020 NAIC INSURANCE SUMMIT 26
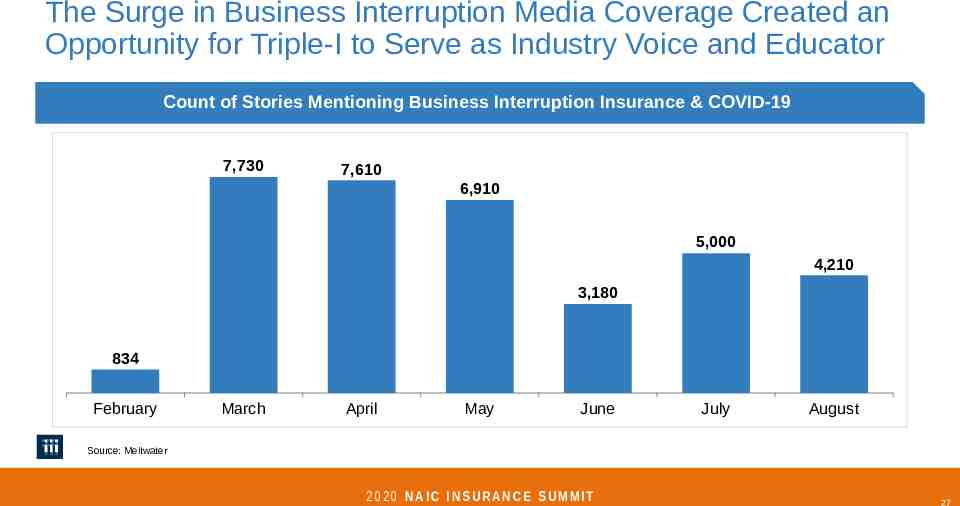
The Surge in Business Interruption Media Coverage Created an Opportunity for Triple-I to Serve as Industry Voice and Educator Count of Stories Mentioning Business Interruption Insurance & COVID-19 7,730 7,610 6,910 5,000 4,210 3,180 834 February March April May June July August Source: Meltwater 2020 NAIC INSURANCE SUMMIT 27
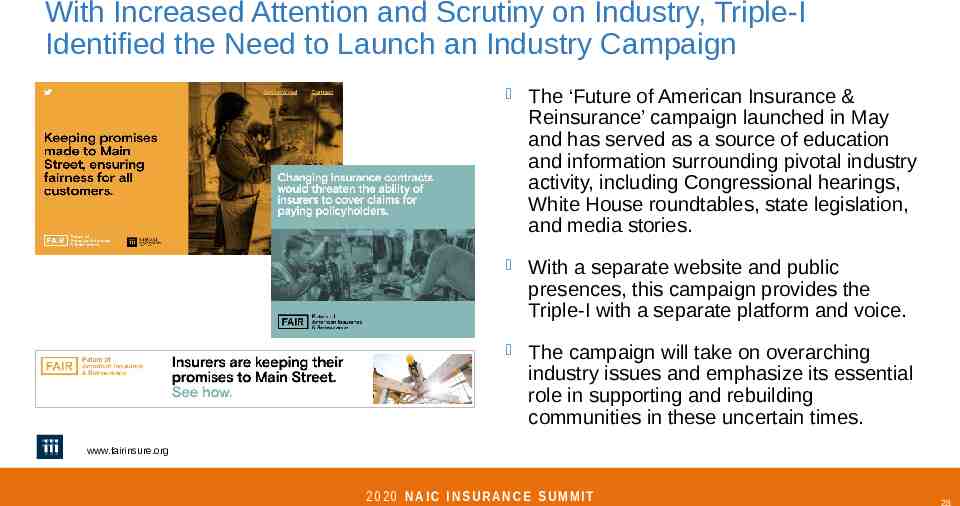
With Increased Attention and Scrutiny on Industry, Triple-I Identified the Need to Launch an Industry Campaign The ‘Future of American Insurance & Reinsurance’ campaign launched in May and has served as a source of education and information surrounding pivotal industry activity, including Congressional hearings, White House roundtables, state legislation, and media stories. With a separate website and public presences, this campaign provides the Triple-I with a separate platform and voice. The campaign will take on overarching industry issues and emphasize its essential role in supporting and rebuilding communities in these uncertain times. www.fairinsure.org 2020 NAIC INSURANCE SUMMIT 28
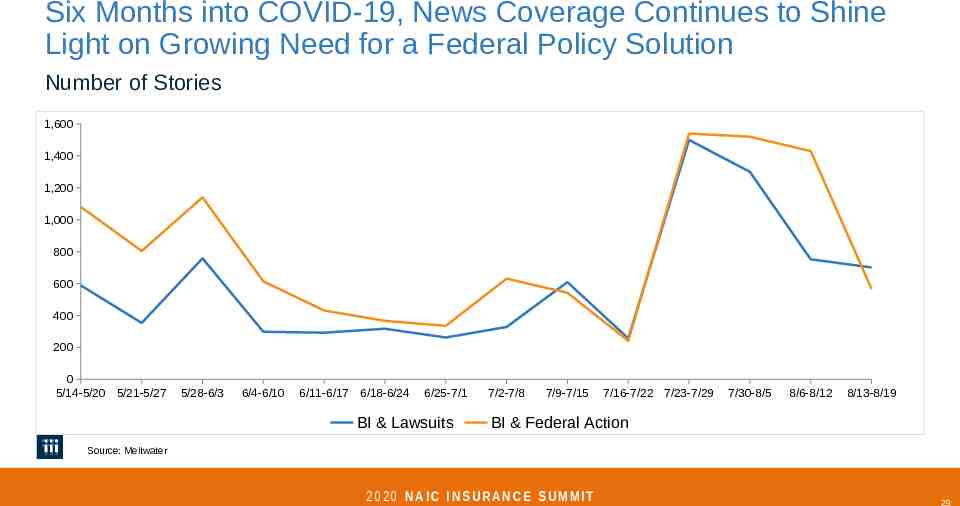
Six Months into COVID-19, News Coverage Continues to Shine Light on Growing Need for a Federal Policy Solution Number of Stories 1,600 1,400 1,200 1,000 800 600 400 200 0 5/14-5/20 5/21-5/27 5/28-6/3 6/4-6/10 6/11-6/17 6/18-6/24 6/25-7/1 BI & Lawsuits 7/2-7/8 7/9-7/15 7/16-7/22 7/23-7/29 7/30-8/5 8/6-8/12 8/13-8/19 BI & Federal Action Source: Meltwater 2020 NAIC INSURANCE SUMMIT 29
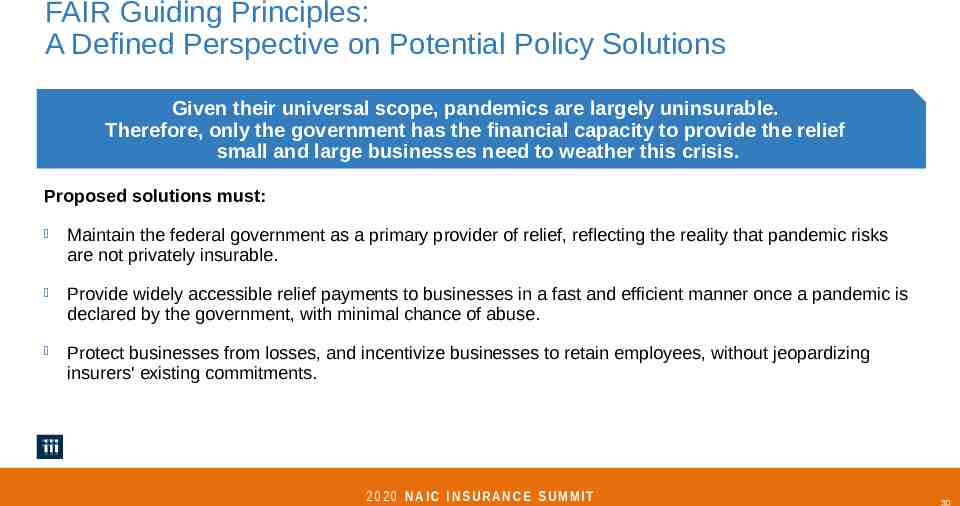
FAIR Guiding Principles: A Defined Perspective on Potential Policy Solutions Given their universal scope, pandemics are largely uninsurable. Therefore, only the government has the financial capacity to provide the relief small and large businesses need to weather this crisis. Proposed solutions must: Maintain the federal government as a primary provider of relief, reflecting the reality that pandemic risks are not privately insurable. Provide widely accessible relief payments to businesses in a fast and efficient manner once a pandemic is declared by the government, with minimal chance of abuse. Protect businesses from losses, and incentivize businesses to retain employees, without jeopardizing insurers' existing commitments. 2020 NAIC INSURANCE SUMMIT 30
Summer 2020 An initiative of the
Objective Drive behavioral change to help people and communities better manage risk and become more resilient 32
Strategies Create a resilience movement giving households and communities a stake in risk mitigation Educate and empower stakeholders about protection gaps and their impact on their recovery Fast-track the use of cost effective tools to drive risk mitigation, transfer and retention 33
Success Metrics 1. Quantify, track and improve resilience ratings for 50 cities 2. Connect 5,000 decision-makers 3. Bring-to-market 5 resilience tools 4. Change how 50,000 businesses and households manage risk 5. Integrate risk mitigation into 5% of residential and commercial policies Five byby 2025 “Five 2025” 34
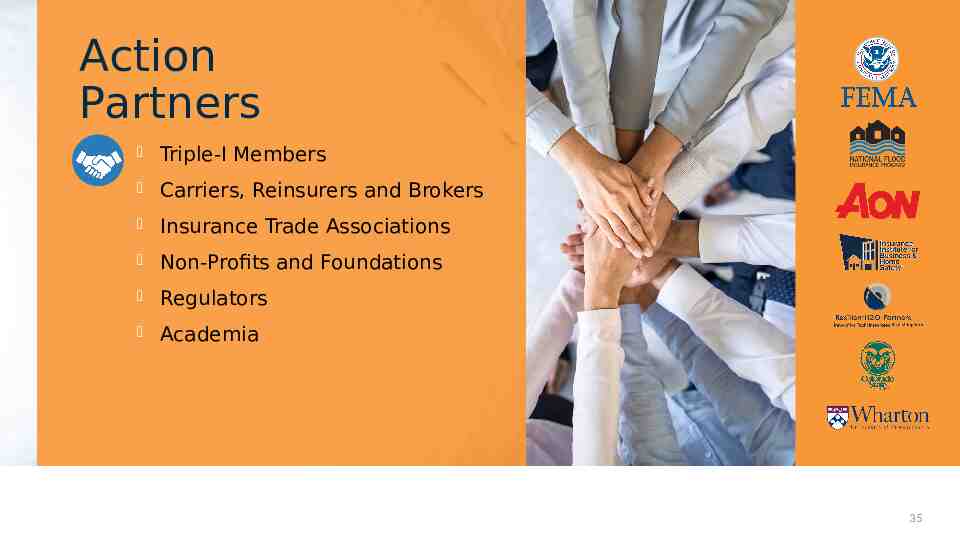
Action Partners Triple-I Members Carriers, Reinsurers and Brokers Insurance Trade Associations Non-Profits and Foundations Regulators Academia 35
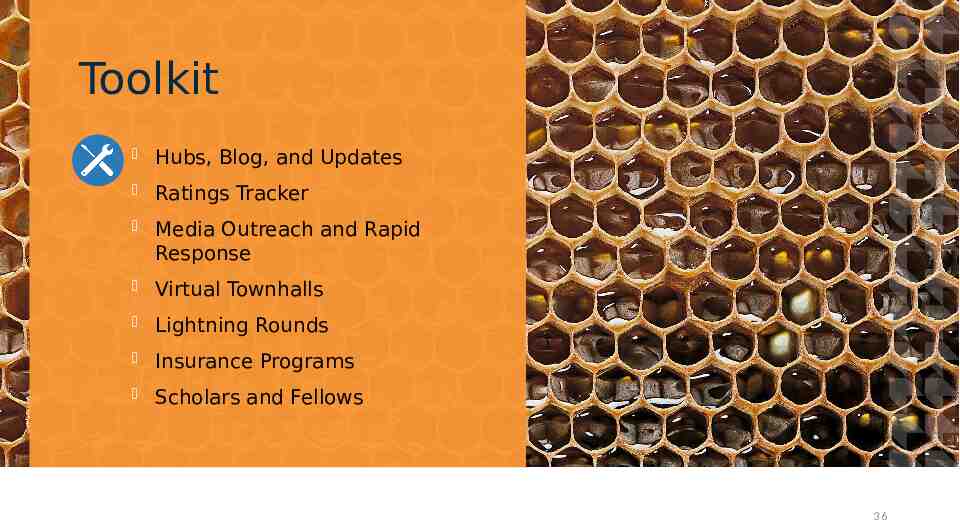
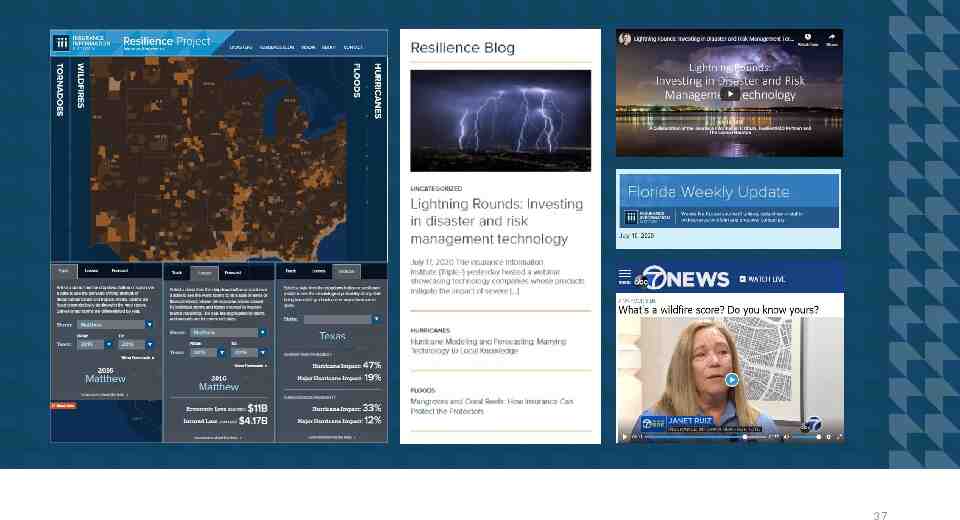
Toolkit Hubs, Blog, and Updates Ratings Tracker Media Outreach and Rapid Response Virtual Townhalls Lightning Rounds Insurance Programs Scholars and Fellows 36
37
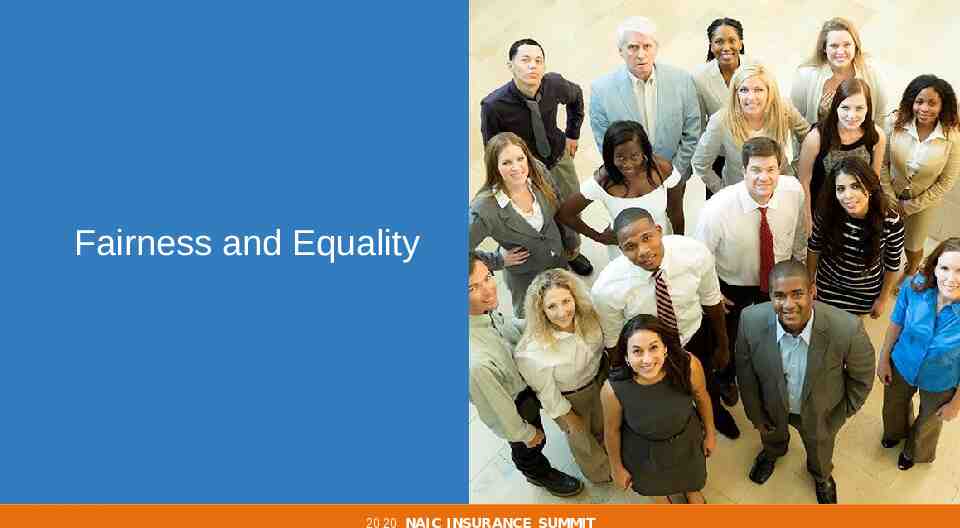
Fairness and Equality 2 0 2 0 NAIC INSURANCE SUMMIT
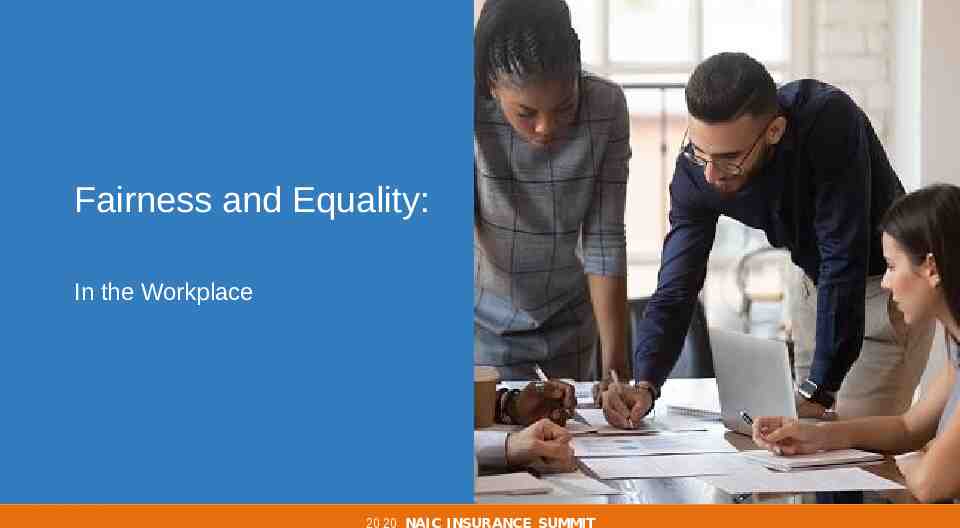
Fairness and Equality: In the Workplace 2 0 2 0 NAIC INSURANCE SUMMIT
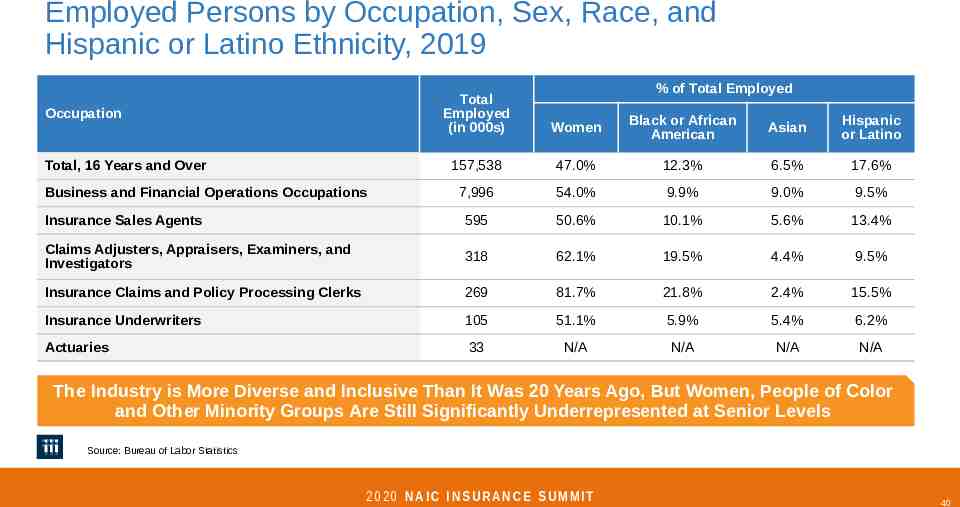
Employed Persons by Occupation, Sex, Race, and Hispanic or Latino Ethnicity, 2019 % of Total Employed Total Employed (in 000s) Women Black or African American Asian Hispanic or Latino 157,538 47.0% 12.3% 6.5% 17.6% 7,996 54.0% 9.9% 9.0% 9.5% Insurance Sales Agents 595 50.6% 10.1% 5.6% 13.4% Claims Adjusters, Appraisers, Examiners, and Investigators 318 62.1% 19.5% 4.4% 9.5% Insurance Claims and Policy Processing Clerks 269 81.7% 21.8% 2.4% 15.5% Insurance Underwriters 105 51.1% 5.9% 5.4% 6.2% Actuaries 33 N/A N/A N/A N/A Occupation Total, 16 Years and Over Business and Financial Operations Occupations The Industry is More Diverse and Inclusive Than It Was 20 Years Ago, But Women, People of Color and Other Minority Groups Are Still Significantly Underrepresented at Senior Levels Source: Bureau of Labor Statistics 2020 NAIC INSURANCE SUMMIT 40
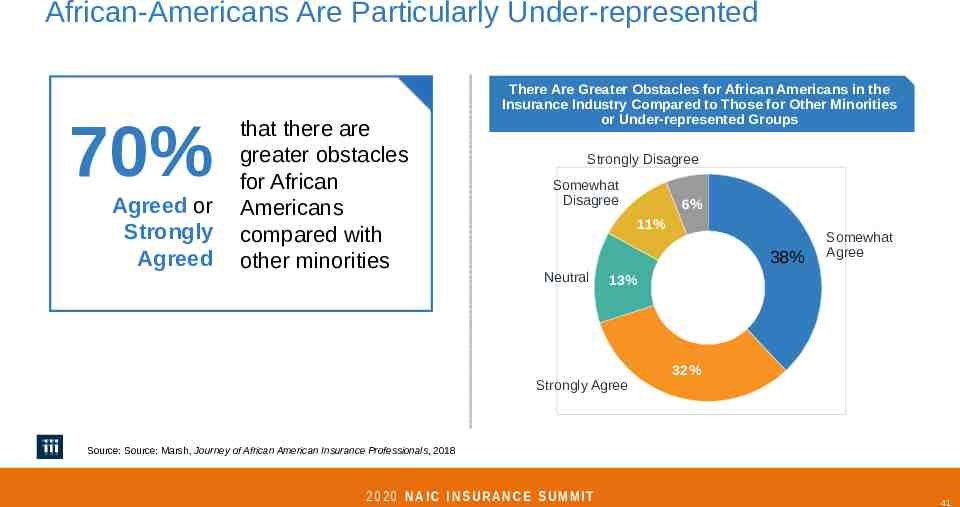
African-Americans Are Particularly Under-represented 70% Agreed or Strongly Agreed that there are greater obstacles for African Americans compared with other minorities There Are Greater Obstacles for African Americans in the Insurance Industry Compared to Those for Other Minorities or Under-represented Groups Strongly Disagree Somewhat Disagree 6% 11% 38% Neutral Somewhat Agree 13% Strongly Agree 32% Source: Source: Marsh, Journey of African American Insurance Professionals, 2018 2020 NAIC INSURANCE SUMMIT 41
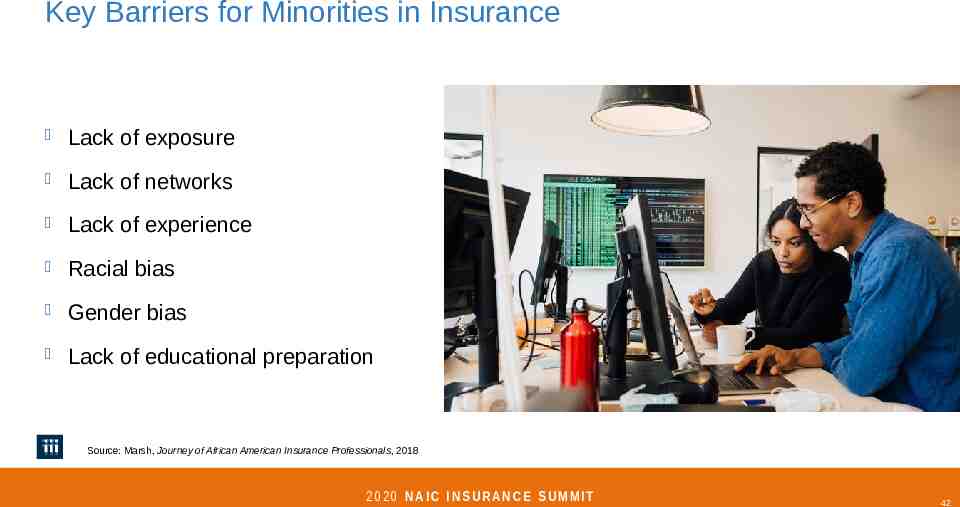
Key Barriers for Minorities in Insurance Lack of exposure Lack of networks Lack of experience Racial bias Gender bias Lack of educational preparation Source: Marsh, Journey of African American Insurance Professionals, 2018 2020 NAIC INSURANCE SUMMIT 42
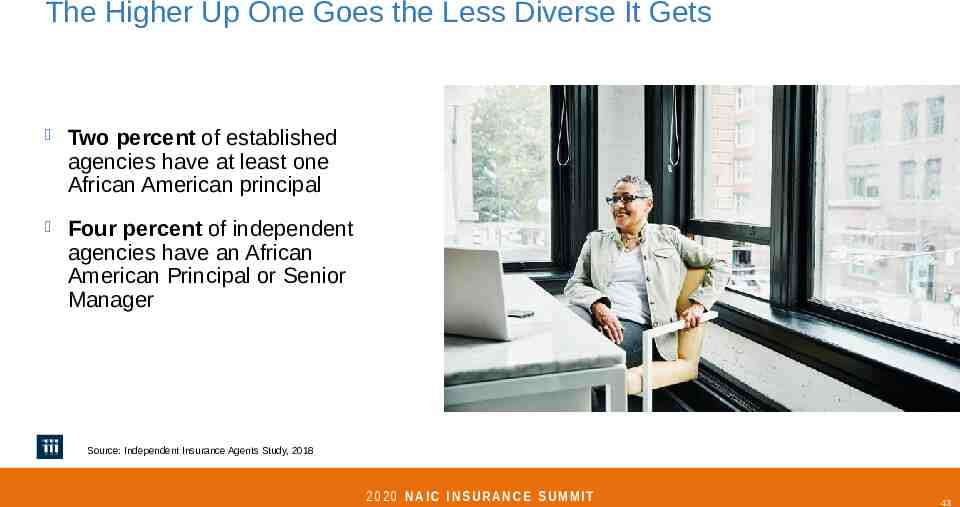
The Higher Up One Goes the Less Diverse It Gets Two percent of established agencies have at least one African American principal Four percent of independent agencies have an African American Principal or Senior Manager Source: Independent Insurance Agents Study, 2018 2020 NAIC INSURANCE SUMMIT 43
Fairer Outcomes for All 2 0 2 0 NAIC INSURANCE SUMMIT
Solutions? The NAIC's newly formed committee on race and insurance will address practices that potentially disadvantage minorities – the industry will engage with the NAIC to review the recommended steps SOLUTIO N 2020 NAIC INSURANCE SUMMIT 45
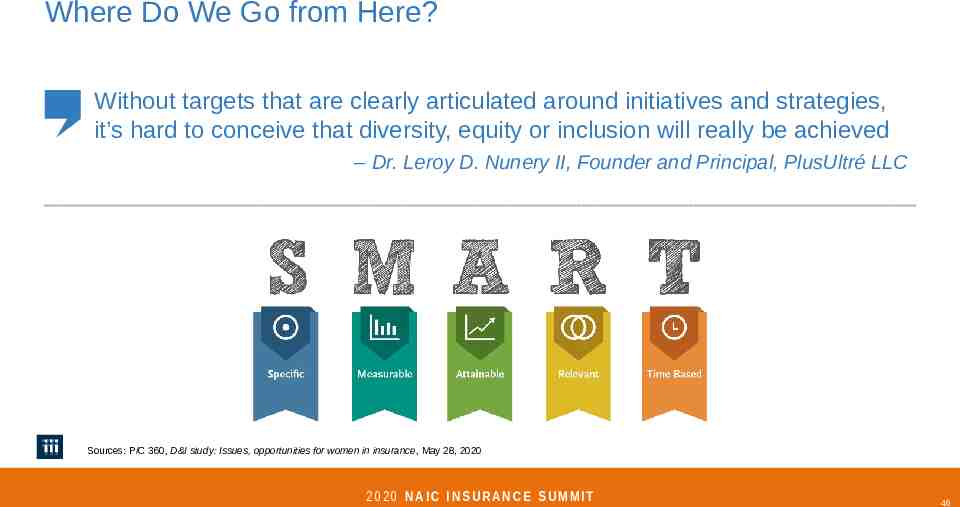
Where Do We Go from Here? Without targets that are clearly articulated around initiatives and strategies, it’s hard to conceive that diversity, equity or inclusion will really be achieved – Dr. Leroy D. Nunery II, Founder and Principal, PlusUltré LLC Sources: P/C 360, D&I study: Issues, opportunities for women in insurance, May 28, 2020 2020 NAIC INSURANCE SUMMIT 46
Final Thoughts 2 0 2 0 NAIC INSURANCE SUMMIT
Insurers Are Financially Sound and Have the Resources* to Keep America Resilient Despite setbacks due to COVID-19, the insurance industry stands ready to live up to its promises to keep households, communities and the American economy more secure, productive and stronger. *See COVID-19 “Final Thought” 2020 NAIC INSURANCE SUMMIT 48
It Takes a Movement to Build a Stronger, More Resilient America Greater catastrophe risks demand greater mitigation and resilience tools to reduce loss of lives and money. The Resilience Accelerator and its partners advance this cause by building a Resilience Movement to empower all. 2020 NAIC INSURANCE SUMMIT 49
Commitment to Creating and Empowering Structure to Ensure Diversity and Inclusion at All Levels Diversity and inclusion in our industry won’t just “happen.” We’ve made organic gains in the 21st century and are creating new structures by devoting energy and resources necessary to make the insurance industry a leader in breaking down barriers and building truly inclusive workforce. 2020 NAIC INSURANCE SUMMIT 50
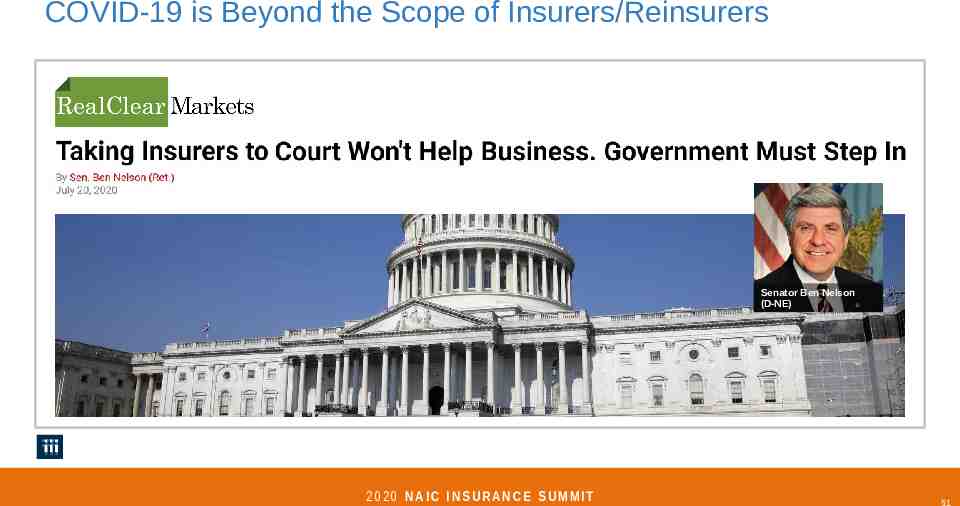
COVID-19 is Beyond the Scope of Insurers/Reinsurers Senator Ben Nelson (D-NE) 2020 NAIC INSURANCE SUMMIT 51
Working in Tandem to Overcome Unprecedented Challenges The insurance industry is proud of its continued success in these areas—in large part because this success is built on a foundation of working in close partnership with consumers and regulators 2020 NAIC INSURANCE SUMMIT 52
Informed. Empowered. Thank you! www.iii.org 2 0 2 0 NAIC INSURANCE SUMMIT