Market Outlook May, 2010
16 Slides892.50 KB
Market Outlook May, 2010
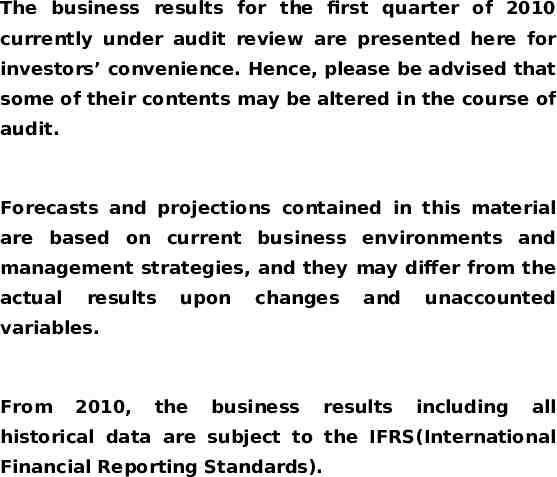
The business results for the first quarter of 2010 currently under audit review are presented here for investors’ convenience. Hence, please be advised that some of their contents may be altered in the course of audit. Forecasts and projections contained in this material are based on current business environments and management strategies, and they may differ from the actual results upon changes and unaccounted variables. From 2010, the business results including all historical data are subject to the IFRS(International Financial Reporting Standards).
Table of Contents LG Chem at a Glance 1 Mid to Long-term Business Strategy2 Differentiated Competitiveness 3 1Q 2010 Business Results 4 Divisional Results & Outlook 6 2010 Business Plan 8 Appendix 9
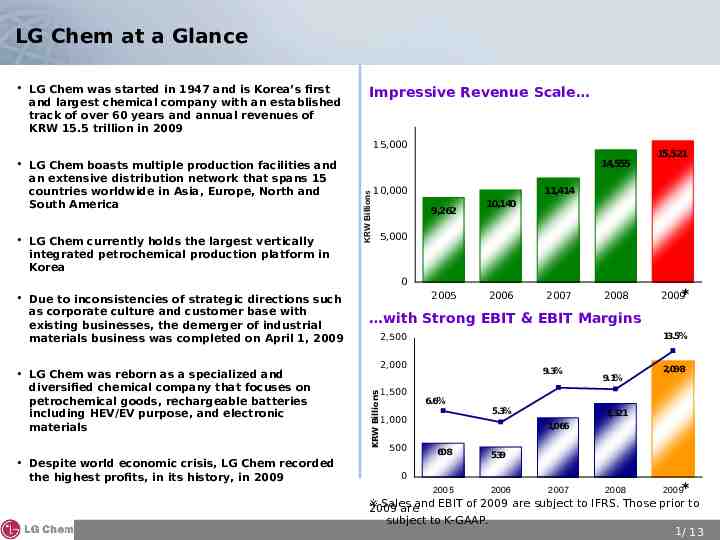
LG Chem at a Glance LG Chem was started in 1947 and is Korea’s first and largest chemical company with an established track of over 60 years and annual revenues of KRW 15.5 trillion in 2009 Impressive Revenue Scale 15,000 LG Chem currently holds the largest vertically integrated petrochemical production platform in Korea 14,555 KRW Billions LG Chem boasts multiple production facilities and an extensive distribution network that spans 15 countries worldwide in Asia, Europe, North and South America 10,000 11,414 9,262 10,140 5,000 0 LG Chem was reborn as a specialized and diversified chemical company that focuses on petrochemical goods, rechargeable batteries including HEV/EV purpose, and electronic materials Despite world economic crisis, LG Chem recorded the highest profits, in its history, in 2009 2005 2006 2007 2008 2009* with Strong EBIT & EBIT Margins 13.5% 2,500 2,000 KRW Billions Due to inconsistencies of strategic directions such as corporate culture and customer base with existing businesses, the demerger of industrial materials business was completed on April 1, 2009 15,521 1,500 9.3% 6.6% 1,000 500 5.3% 9.1% 2,098 1,321 1,066 608 539 2005 2006 0 2007 2008 2009* ※ Sales 2009 areand EBIT of 2009 are subject to IFRS. Those prior to subject to K-GAAP. 1/ 13
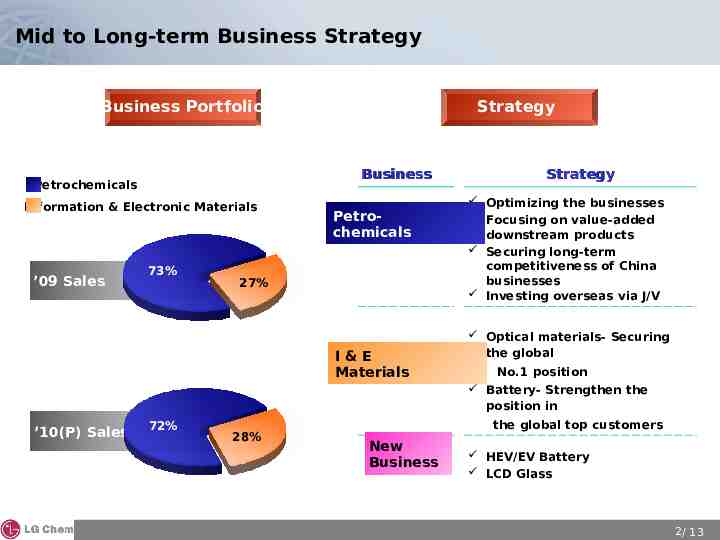
Mid to Long-term Business Strategy Business Portfolio Business Petrochemicals Information & Electronic Materials ’09 Sales Strategy 73% Petrochemicals 27% I&E Materials Strategy Optimizing the businesses Focusing on value-added downstream products Securing long-term competitiveness of China businesses Investing overseas via J/V Optical materials- Securing the global No.1 position Battery- Strengthen the position in ’10(P) Sales 72% 28% the global top customers New Business HEV/EV Battery LCD Glass 2 / 13
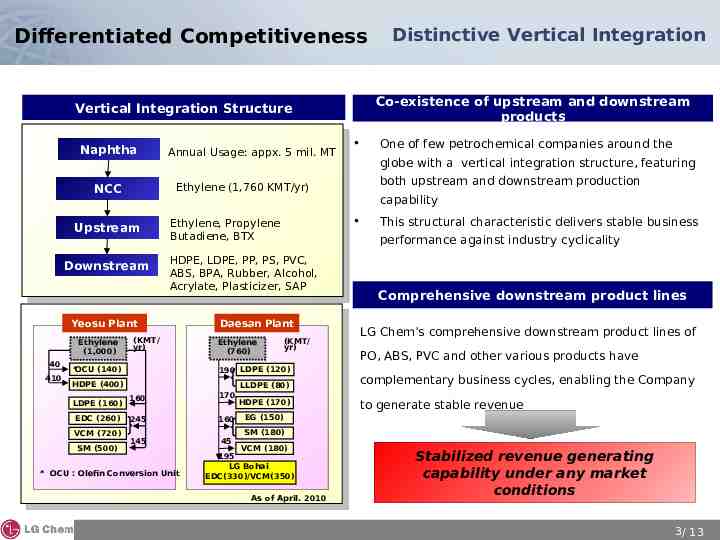
Differentiated Competitiveness Co-existence of upstream and downstream products Vertical Integration Structure Naphtha Annual Usage: appx. 5 mil. MT Upstream Downstream 40 410 *OCU (140) Daesan Plant Ethylene (760) EDC (260) VCM (720) SM (500) (KMT/ yr) 190 LDPE (120) HDPE (400) LDPE (160) both upstream and downstream production LLDPE (80) 160 170 245 160 145 45 * OCU : Olefin Conversion Unit capability This structural characteristic delivers stable business performance against industry cyclicality HDPE, LDPE, PP, PS, PVC, ABS, BPA, Rubber, Alcohol, Acrylate, Plasticizer, SAP (KMT/ yr) One of few petrochemical companies around the globe with a vertical integration structure, featuring Ethylene, Propylene Butadiene, BTX Yeosu Plant Ethylene (1,000) Ethylene (1,760 KMT/yr) NCC Distinctive Vertical Integration HDPE (170) Comprehensive downstream product lines LG Chem’s comprehensive downstream product lines of PO, ABS, PVC and other various products have complementary business cycles, enabling the Company to generate stable revenue EG (150) SM (180) VCM (180) 195 LG Bohai EDC(330)/VCM(350) As of April. 2010 Stabilized revenue generating capability under any market conditions 3 / 13
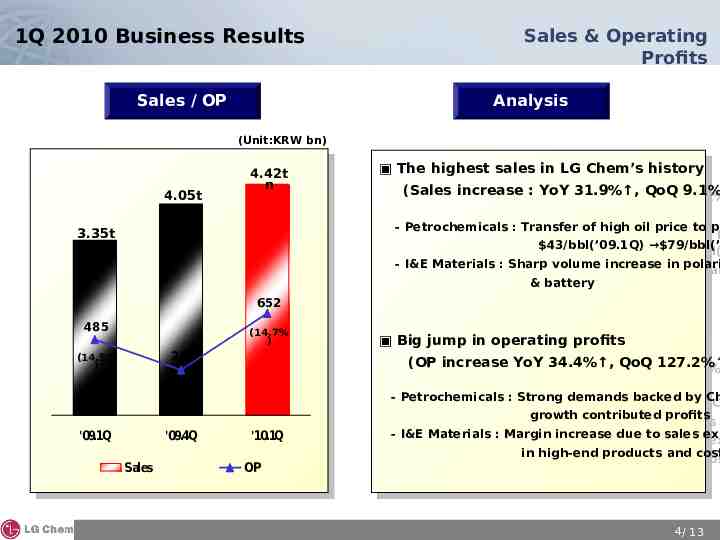
1Q 2010 Business Results Sales / OP Sales & Operating Profits Analysis (Unit:KRW bn) 4.05t n 4.42t n The Thehighest highestsales salesin inLG LGChem’s Chem’shistory history (Sales (Salesincrease increase::YoY YoY31.9% , 31.9% ,QoQ QoQ9.1% 9.1% - -Petrochemicals Petrochemicals: :Transfer Transferof ofhigh highoil oilprice priceto topr p 3.35t n 652 485 (14.7% ) 287 (14.5% ) 43/bbl(’09.1Q) 79/bbl(’ 43/bbl(’09.1Q) 79/bbl( - I&E Materials : Sharp volume increase in polari - I&E Materials : Sharp volume increase in polar &&battery battery Big Bigjump jumpin inoperating operatingprofits profits (OP (OPincrease increaseYoY YoY34.4% , 34.4% ,QoQ QoQ127.2% 127.2% (7.1%) '09.1Q '09.4Q Sales '10.1Q OP - Petrochemicals : Strong demands backed by Ch - Petrochemicals : Strong demands backed by C growth contributed profits growth contributed profits - I&E Materials : Margin increase due to sales exp - I&E Materials : Margin increase due to sales ex in high-end products and cost in high-end products and cos 4/ 13
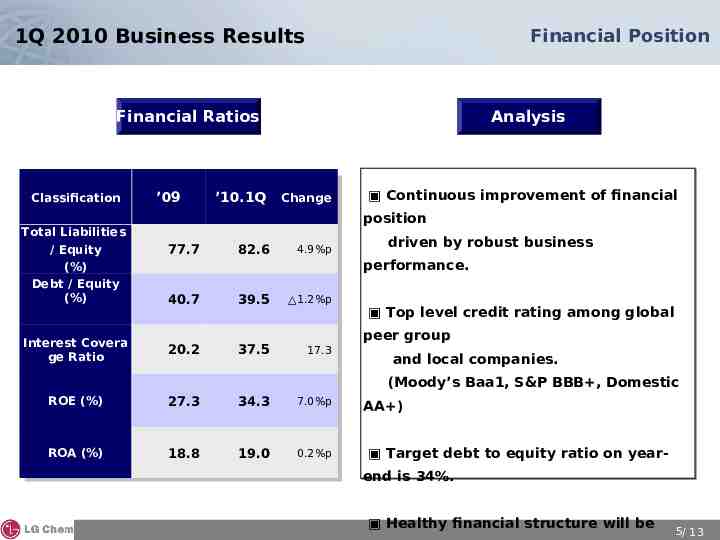
1Q 2010 Business Results Financial Position Financial Ratios Classification Total Liabilities / Equity (%) Debt / Equity (%) Interest Covera ge Ratio ’09 ’10.1Q Analysis Change Continuous improvement of financial position 77.7 82.6 4.9%p 40.7 39.5 1.2%p 20.2 37.5 17.3 driven by robust business performance. Top level credit rating among global peer group and local companies. (Moody’s Baa1, S&P BBB , Domestic ROE (%) 27.3 34.3 7.0%p ROA (%) 18.8 19.0 0.2%p AA ) Target debt to equity ratio on yearend is 34%. Healthy financial structure will be 5/ 13
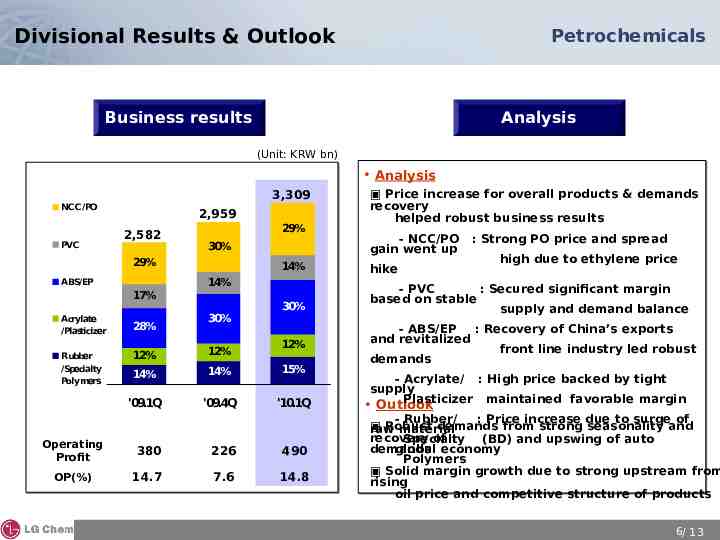
Divisional Results & Outlook Petrochemicals Business results Analysis (Unit: KRW bn) Analysis 3,309 NCC/PO PVC 2,959 2,582 29% 30% 29% 17% Acrylate /Plasticizer Rubber /Specialty Polymers 28% 30% - NCC/PO gain went up : Strong PO price and spread high due to ethylene price 14% hike 30% - PVC : Secured significant margin based on stable supply and demand balance 14% ABS/EP Price increase for overall products & demands recovery helped robust business results 12% 12% 12% 14% 14% 15% '09.1Q '09.4Q '10.1Q Operating Profit 380 226 490 OP(%) 14.7 7.6 14.8 - ABS/EP : Recovery of China’s exports and revitalized front line industry led robust demands - Acrylate/ : High price backed by tight supply Plasticizer maintained favorable margin Outlook - Rubber/ : Price increase due to surge of Robust demands from strong seasonality and raw material recovery of Specialty (BD) and upswing of auto global economy demands Polymers Solid margin growth due to strong upstream from rising oil price and competitive structure of products 6/ 13
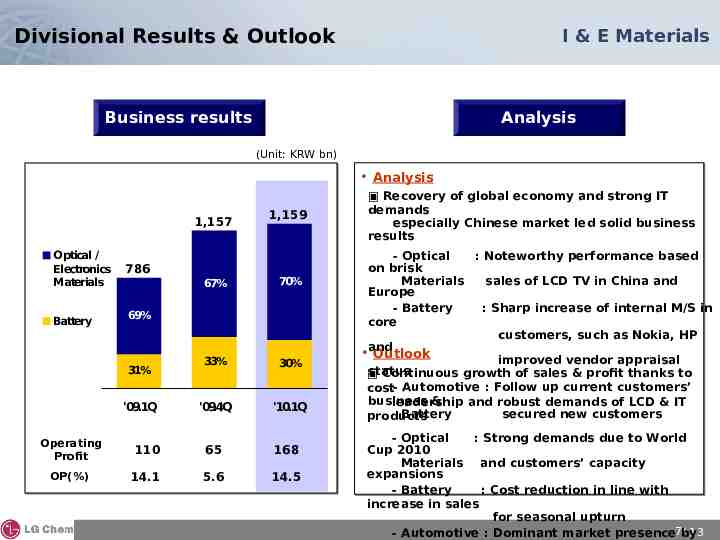
Divisional Results & Outlook I & E Materials Business results Analysis (Unit: KRW bn) Analysis 1,157 Optical / Electronics Materials Battery 786 1,159 67% 70% 33% 30% '09.4Q '10.1Q 69% 31% '09.1Q Operating Profit 110 65 168 OP(%) 14.1 5.6 14.5 Recovery of global economy and strong IT demands especially Chinese market led solid business results - Optical : Noteworthy performance based on brisk Materials sales of LCD TV in China and Europe - Battery : Sharp increase of internal M/S in core customers, such as Nokia, HP and Outlook improved vendor appraisal status Continuous growth of sales & profit thanks to cost- Automotive : Follow up current customers’ business & leadership and robust demands of LCD & IT Battery secured new customers products - Optical : Strong demands due to World Cup 2010 Materials and customers’ capacity expansions - Battery : Cost reduction in line with increase in sales for seasonal upturn / 13 - Automotive : Dominant market presence7by
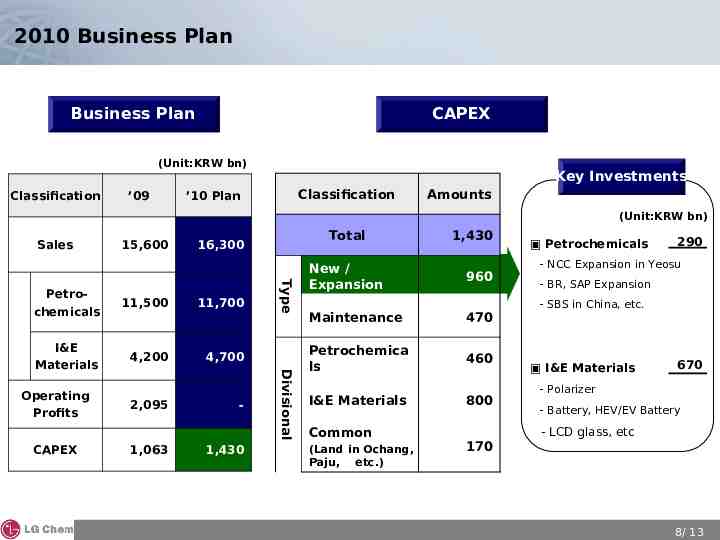
2010 Business Plan Business Plan CAPEX (Unit:KRW bn) Classification ’09 Key Investments Classification ’10 Plan Amounts (Unit:KRW bn) Sales 15,600 11,700 I&E Materials 4,200 4,700 CAPEX 2,095 1,063 - 1,430 Divisional 11,500 Type Petrochemicals Operating Profits Total 16,300 1,430 New / Expansion 960 Maintenance 470 Petrochemica ls 460 I&E Materials 800 Common (Land in Ochang, Paju, etc.) Petrochemicals 290 - NCC Expansion in Yeosu - BR, SAP Expansion - SBS in China, etc. I&E Materials 670 - Polarizer - Battery, HEV/EV Battery - LCD glass, etc 170 8/ 13
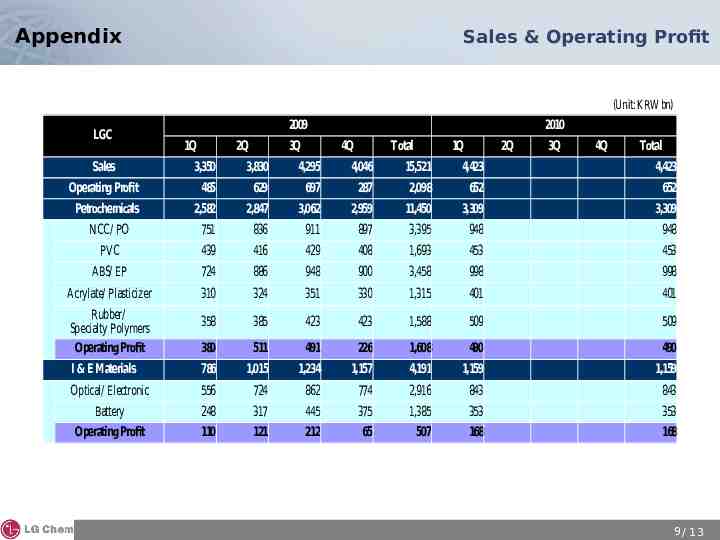
Appendix Sales & Operating Profit (Unit: KRW bn) LGC 2009 1Q 2Q 3Q 2010 4Q Total 1Q 2Q 3Q 4Q Total Sales 3,350 3,830 4,295 4,046 15,521 4,423 4,423 Operating Profit 485 629 697 287 2,098 652 652 Petrochemicals 2,582 2,847 3,062 2,959 11,450 3,309 3,309 NCC/ PO 751 836 911 897 3,395 948 948 PVC 439 416 429 408 1,693 453 453 ABS/ EP 724 886 948 900 3,458 998 998 Acrylate/ Plasticizer 310 324 351 330 1,315 401 401 Rubber/ Specialty Polymers Operating Profit 358 385 423 423 1,588 509 509 380 511 491 226 1,608 490 490 I & E Materials 786 1,015 1,234 1,157 4,191 1,159 1,159 Optical/ Electronic 556 724 862 774 2,916 843 843 Battery Operating Profit 248 110 317 121 445 212 375 65 1,385 507 353 168 353 168 9 / 13
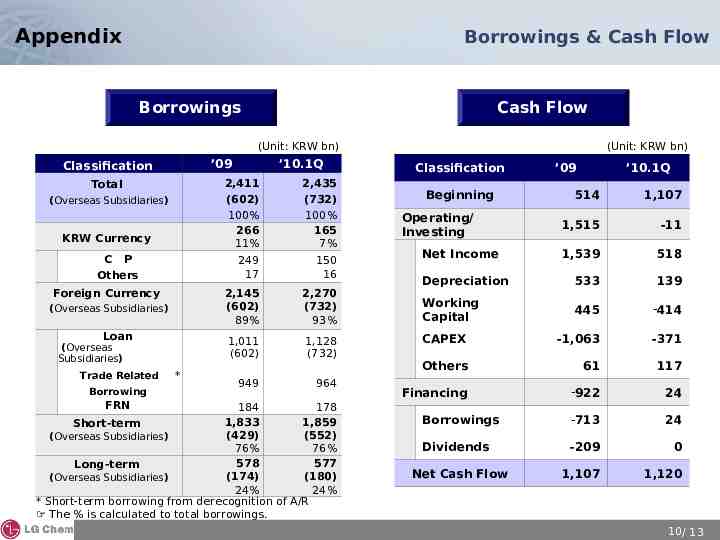
Appendix Borrowings & Cash Flow Borrowings Cash Flow (Unit: KRW bn) (Unit: KRW bn) ’09 Classification Total (Overseas Subsidiaries) KRW Currency C P Others Foreign Currency (Overseas Subsidiaries) Loan (Overseas Subsidiaries) Trade Related Borrowing FRN * ’10.1Q 2,411 (602) 100% 266 11% 2,435 (732) 100% 165 7% 249 17 150 16 2,145 (602) 89% 2,270 (732) 93% 1,011 (602) 1,128 (732) 949 964 184 178 1,833 1,859 Short-term (429) (552) (Overseas Subsidiaries) 76% 76% 578 577 Long-term (174) (180) (Overseas Subsidiaries) 24% 24% * Short-term borrowing from derecognition of A/R The % is calculated to total borrowings. Classification Beginning ’09 ’10.1Q 514 1,107 1,515 -11 1,539 518 Depreciation 533 139 Working Capital 445 -414 CAPEX -1,063 -371 Others 61 117 Financing -922 24 Borrowings -713 24 Dividends -209 0 1,107 1,120 Operating/ Investing Net Income Net Cash Flow 10/ 13
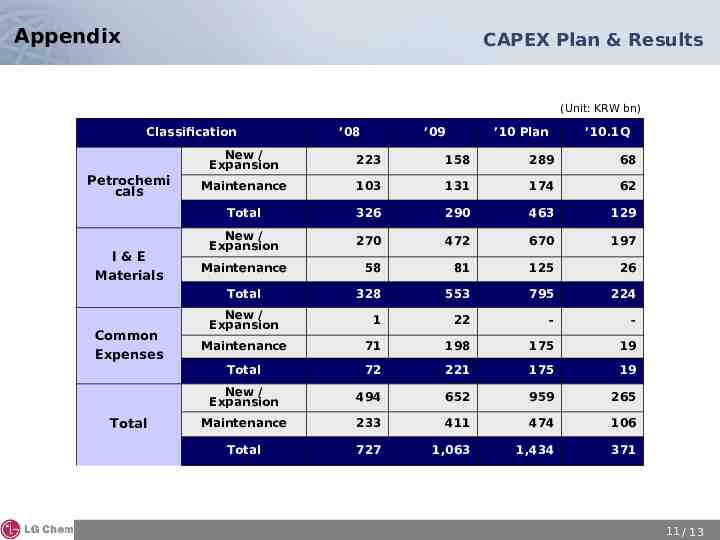
Appendix CAPEX Plan & Results (Unit: KRW bn) Classification Petrochemi cals I&E Materials Total ’09 ’10 Plan ’10.1Q New / Expansion 223 158 289 68 Maintenance 103 131 174 62 Total 326 290 463 129 New / Expansion 270 472 670 197 58 81 125 26 328 553 795 224 1 22 - - Maintenance 71 198 175 19 Total 72 221 175 19 New / Expansion 494 652 959 265 Maintenance 233 411 474 106 Total 727 1,063 1,434 371 Maintenance Total Common Expenses ’08 New / Expansion 11 / 13
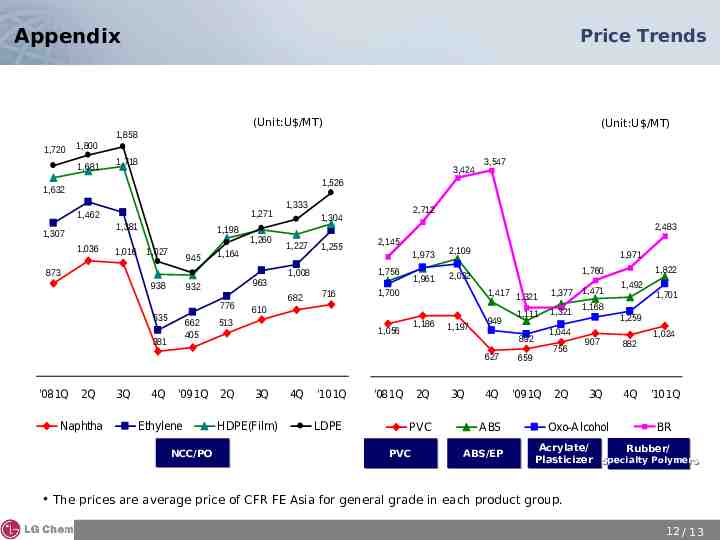
Appendix Price Trends (Unit:U /MT) 1,720 1,800 1,681 1,718 3,424 3,547 1,526 1,632 1,271 1,462 1,381 1,307 1,036 1,198 1,016 1,027 945 938 963 932 776 535 662 405 381 2Q Naphtha 3Q 4Q '09 1Q Ethylene NCC/PO NCC/PO 1,260 1,164 873 '08 1Q (Unit:U /MT) 1,858 1,333 1,227 1,255 682 2,483 2,145 1,756 1,008 716 1,973 2,109 1,961 2,032 1,700 1,971 1,417 1,321 1,186 1,056 3Q HDPE(Film) 4Q '10 1Q LDPE 1,197 949 1,111 2Q PVC PVC 3Q 756 627 659 4Q '09 1Q ABS ABS/EP 1,377 1,471 1,168 1,321 1,044 892 '08 1Q 1,822 1,760 610 513 2Q 2,712 1,304 2Q 1,492 1,259 907 882 3Q 4Q Oxo-Alcohol 1,701 1,024 '10 1Q BR Acrylate/ Rubber/ Plasticizer Specialty Specialty Polymers Polymers The prices are average price of CFR FE Asia for general grade in each product group. 12 / 13
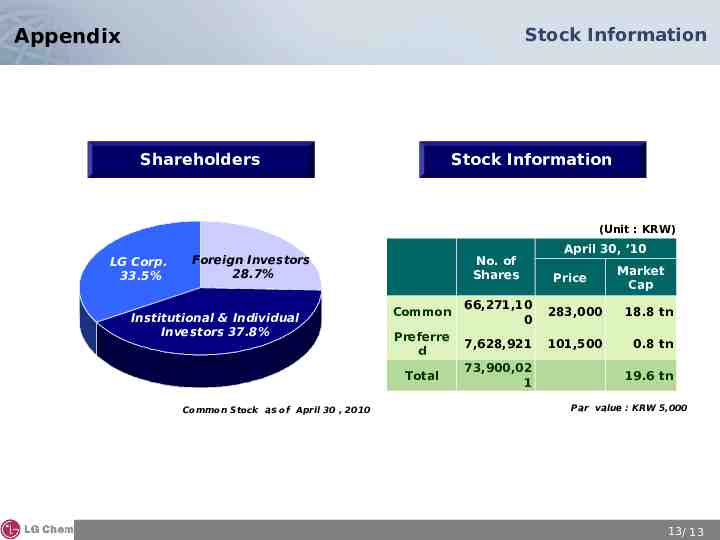
Stock Information Appendix Shareholders Stock Information (Unit : KRW) LG Corp. 33.5% Foreign Investors 28.7% Institutional & Individual Investors 37.8% Common Stock as of April 30 , 2010 No. of Shares April 30, ’10 Price Market Cap Common 66,271,10 0 283,000 18.8 tn Preferre d 7,628,921 101,500 0.8 tn Total 73,900,02 1 19.6 tn Par value : KRW 5,000 13 / 13