ManageEngine® Applications Manager Manage Application Performance
37 Slides5.71 MB
ManageEngine Applications Manager Manage Application Performance in Physical, Virtual and Cloud Environments
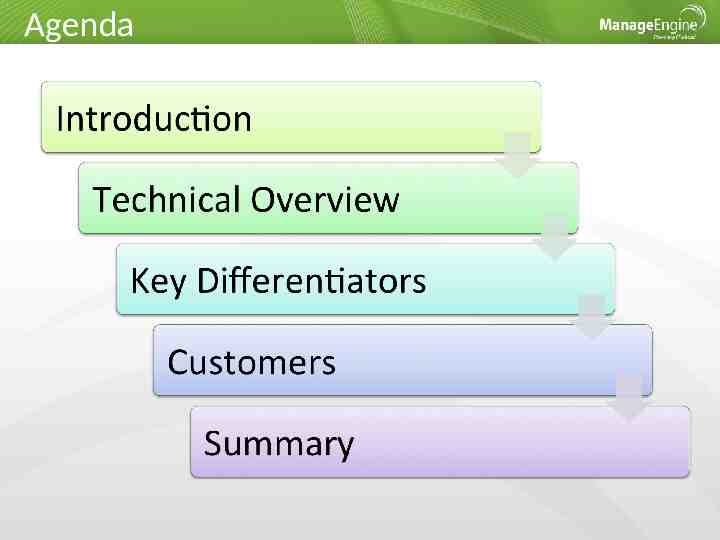
Agenda
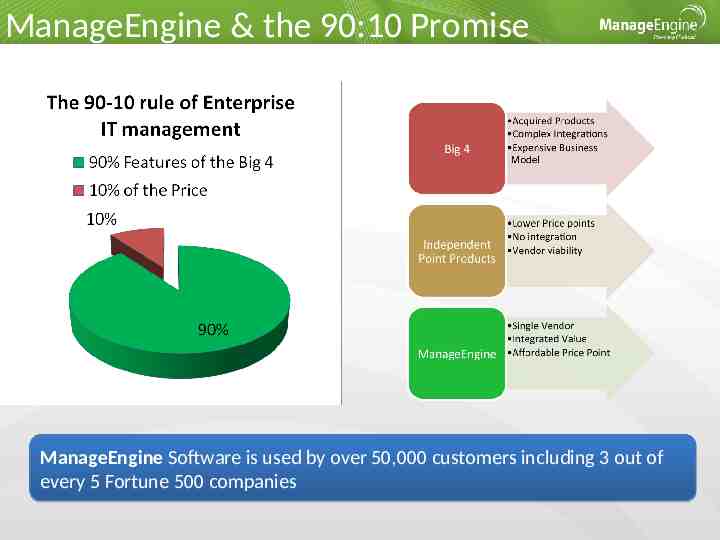
ManageEngine & the 90:10 Promise Vendor Landscape ManageEngine Software is used by over 50,000 customers including 3 out of every 5 Fortune 500 companies
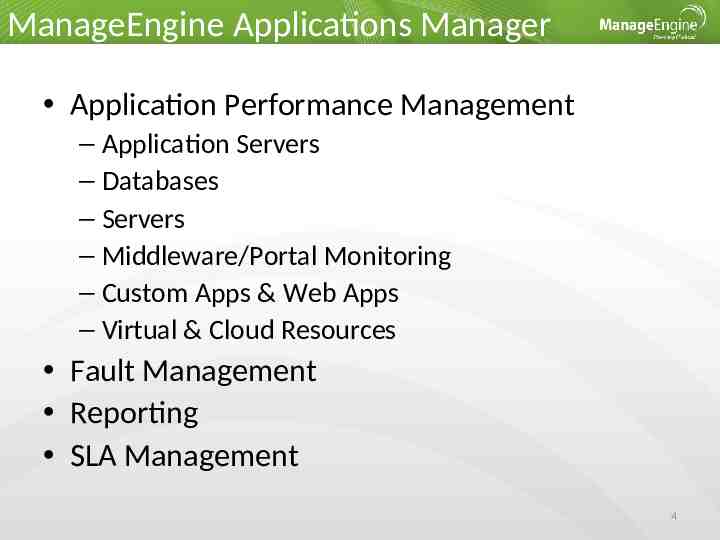
ManageEngine Applications Manager Application Performance Management – Application Servers – Databases – Servers – Middleware/Portal Monitoring – Custom Apps & Web Apps – Virtual & Cloud Resources Fault Management Reporting SLA Management 4
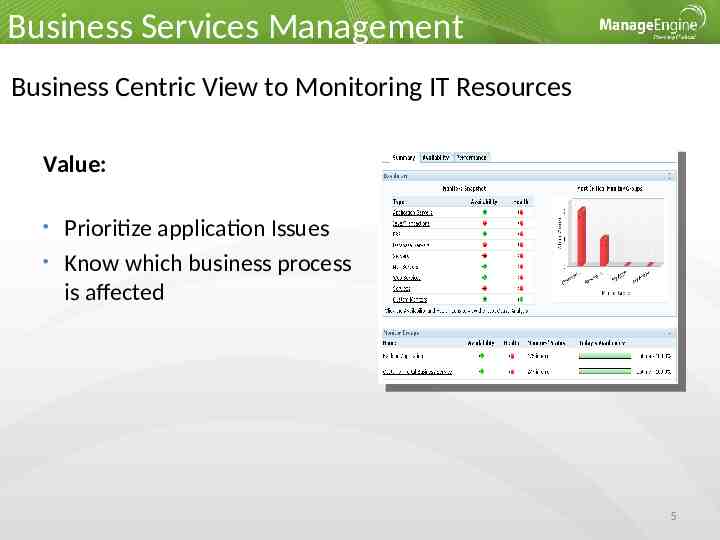
Business Services Management Business Centric View to Monitoring IT Resources Value: Prioritize application Issues Know which business process is affected 5
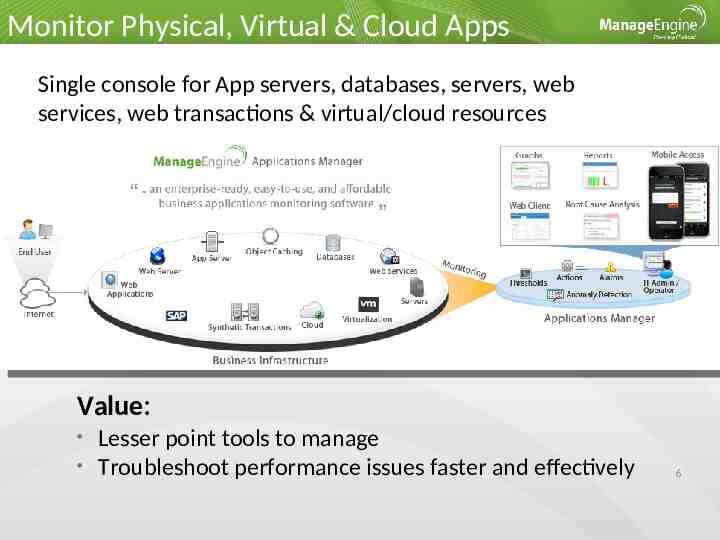
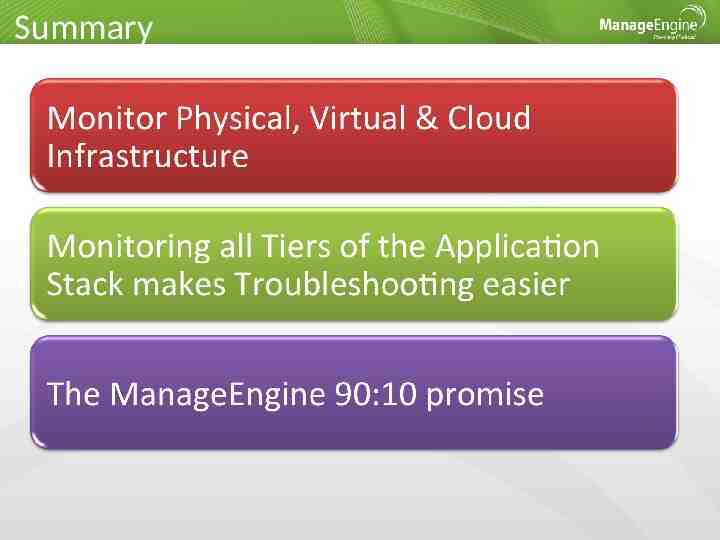
Monitor Physical, Virtual & Cloud Apps Single console for App servers, databases, servers, web services, web transactions & virtual/cloud resources Value: Lesser point tools to manage Troubleshoot performance issues faster and effectively 6
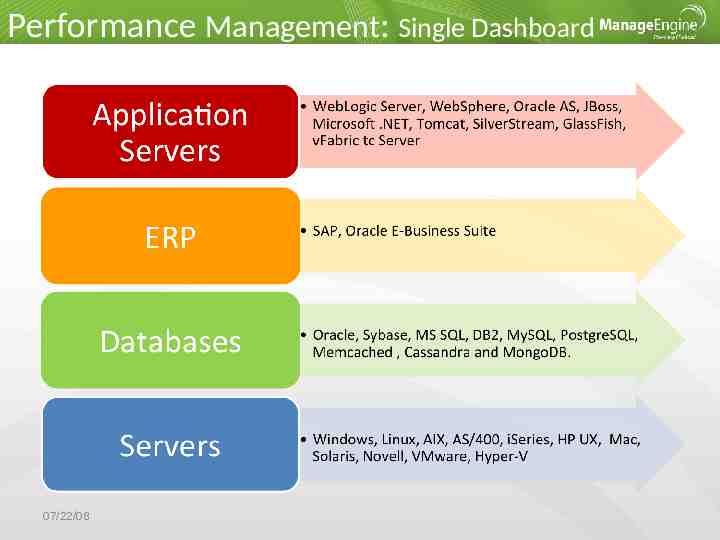
Performance Management: Single Dashboard 07/22/08
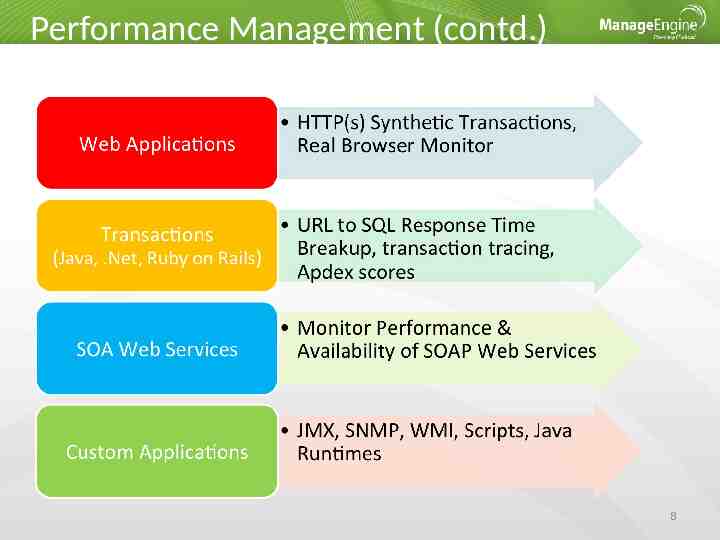
Performance Management (contd.) 8
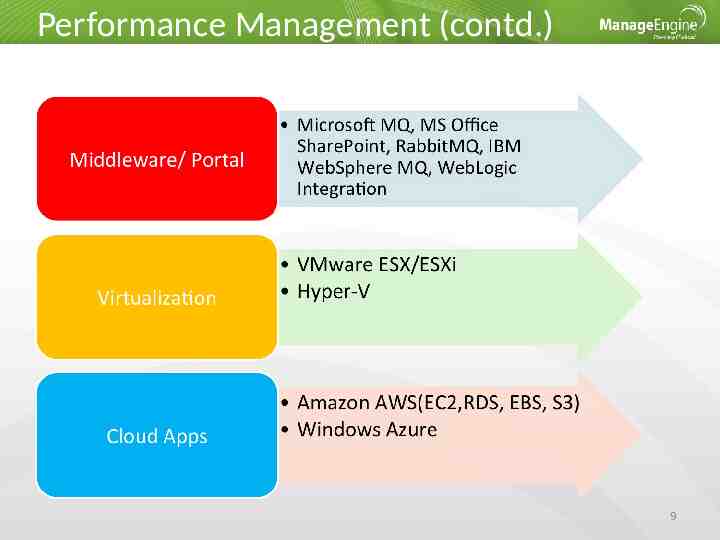
Performance Management (contd.) 9
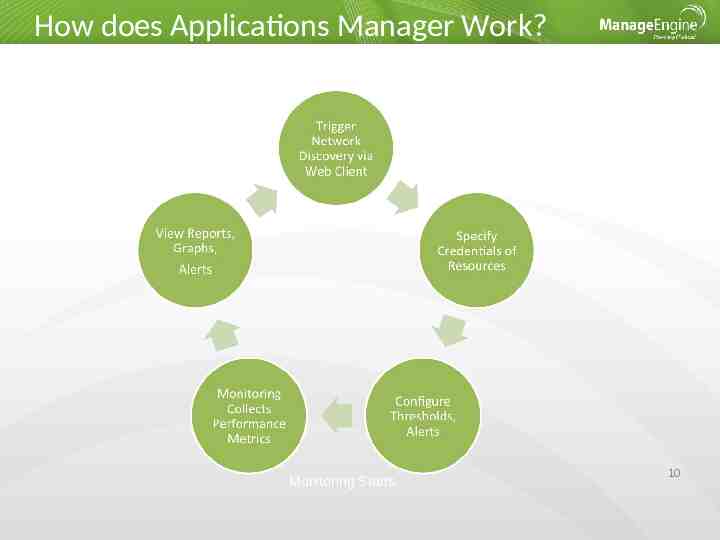
How does Applications Manager Work? Monitoring Starts 10
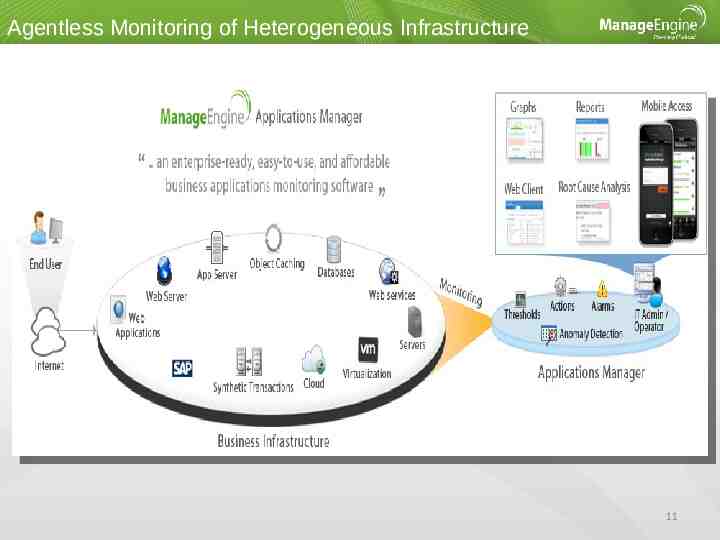
Agentless Monitoring of Heterogeneous Infrastructure 11
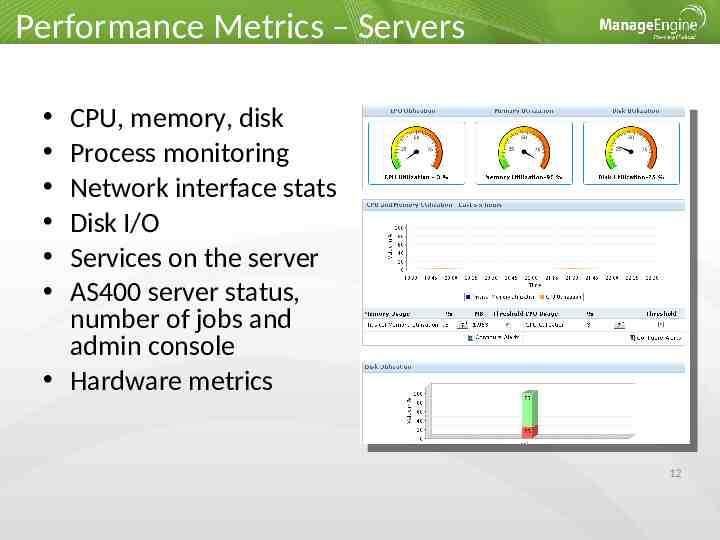
Performance Metrics – Servers CPU, memory, disk Process monitoring Network interface stats Disk I/O Services on the server AS400 server status, number of jobs and admin console Hardware metrics 12
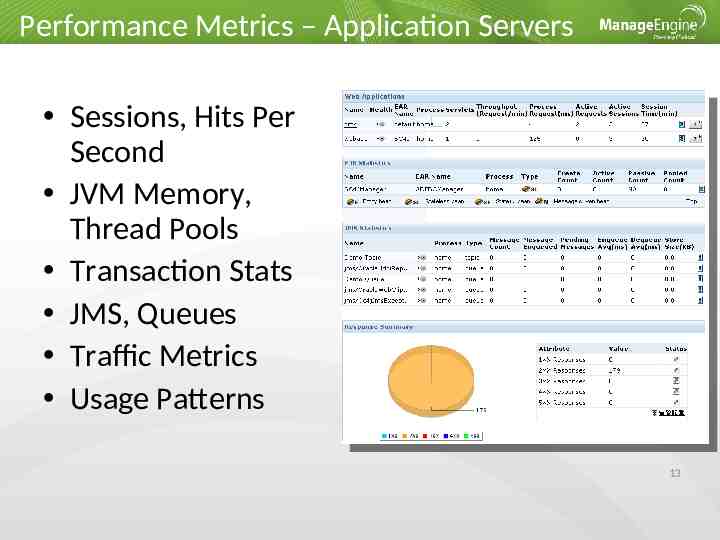
Performance Metrics – Application Servers Sessions, Hits Per Second JVM Memory, Thread Pools Transaction Stats JMS, Queues Traffic Metrics Usage Patterns 13
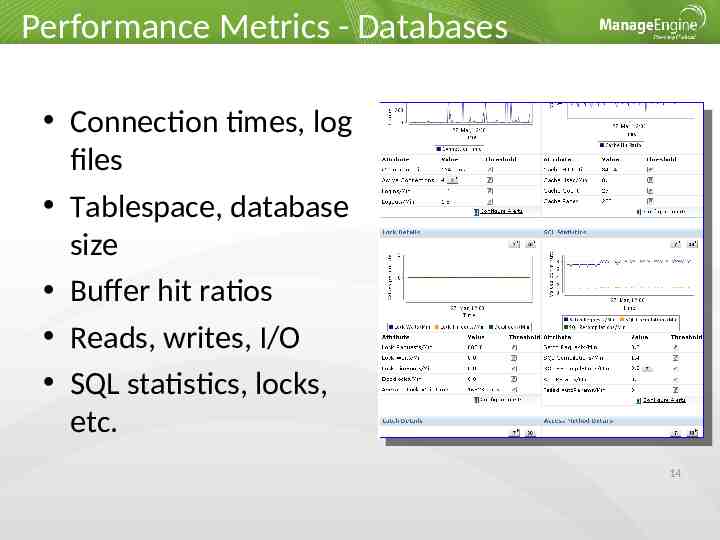
Performance Metrics - Databases Connection times, log files Tablespace, database size Buffer hit ratios Reads, writes, I/O SQL statistics, locks, etc. 14
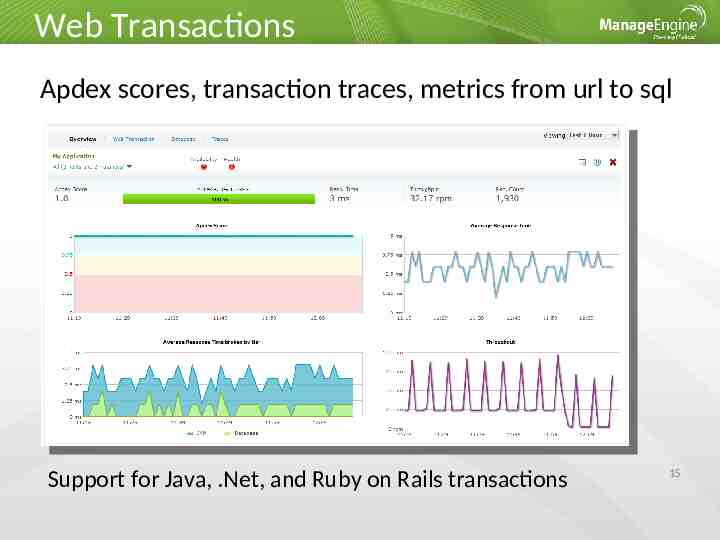
Web Transactions Apdex scores, transaction traces, metrics from url to sql Support for Java, .Net, and Ruby on Rails transactions 15
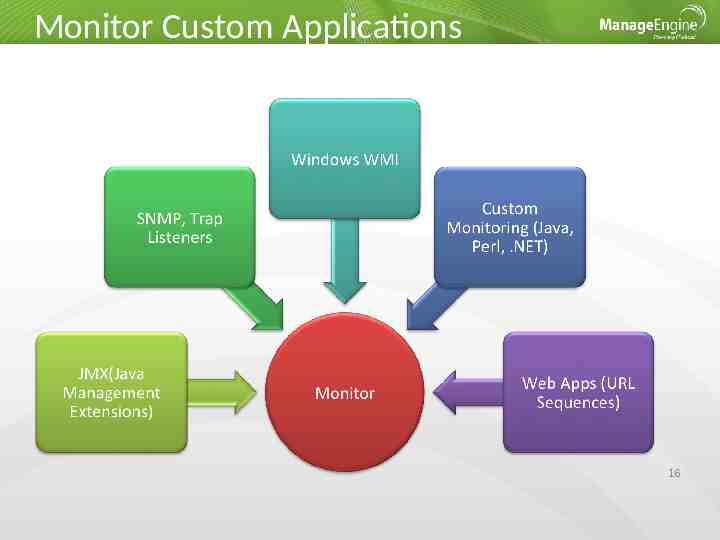
Monitor Custom Applications 16
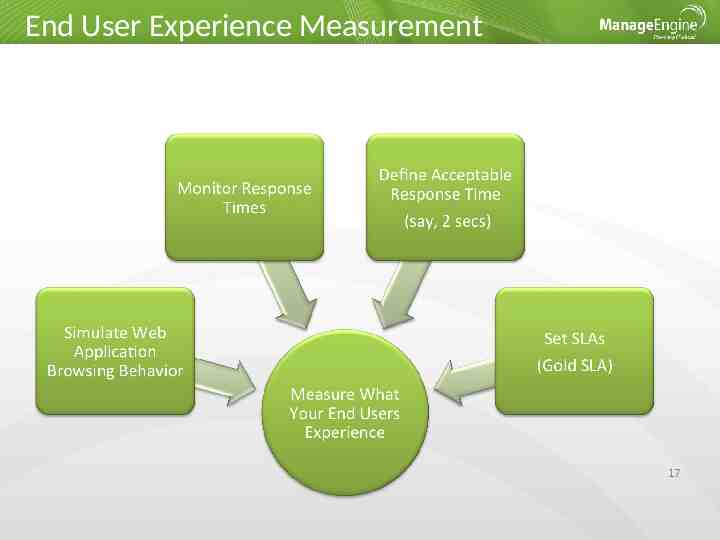
End User Experience Measurement 17
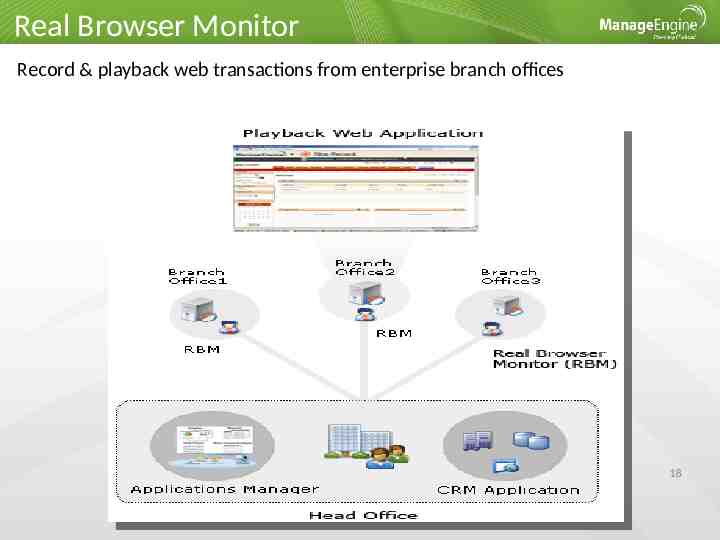
Real Browser Monitor Record & playback web transactions from enterprise branch offices 18
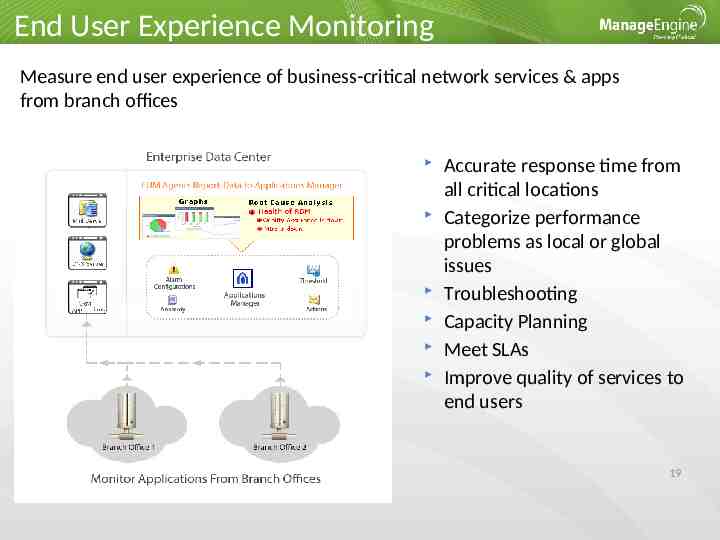
End User Experience Monitoring Measure end user experience of business-critical network services & apps from branch offices Accurate response time from all critical locations Categorize performance problems as local or global issues Troubleshooting Capacity Planning Meet SLAs Improve quality of services to end users 19
Virtualization Monitoring Monitor VMware ESX/ESXi and Microsoft Hyper-V servers and their guest VMs Performance Management for Heterogeneous IT End User Monitoring helps manage the user experience prior and post virtualization Manage performance of both physical and virtual infrastructure Automate Virtual Machine Management 20
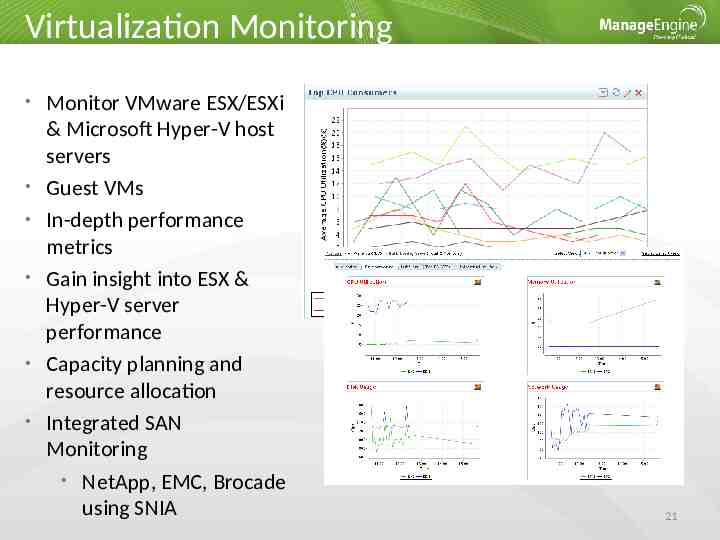
Virtualization Monitoring Monitor VMware ESX/ESXi & Microsoft Hyper-V host servers Guest VMs In-depth performance metrics Gain insight into ESX & Hyper-V server performance Capacity planning and resource allocation Integrated SAN Monitoring NetApp, EMC, Brocade using SNIA 21
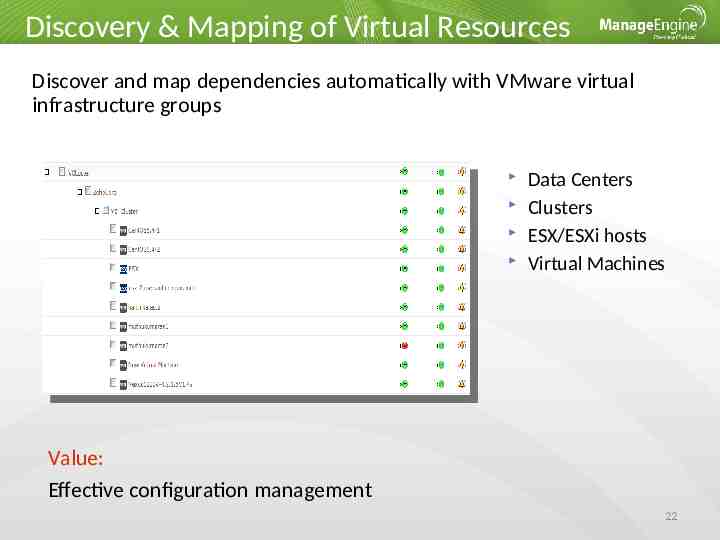
Discovery & Mapping of Virtual Resources Discover and map dependencies automatically with VMware virtual infrastructure groups Data Centers Clusters ESX/ESXi hosts Virtual Machines Value: Effective configuration management 22
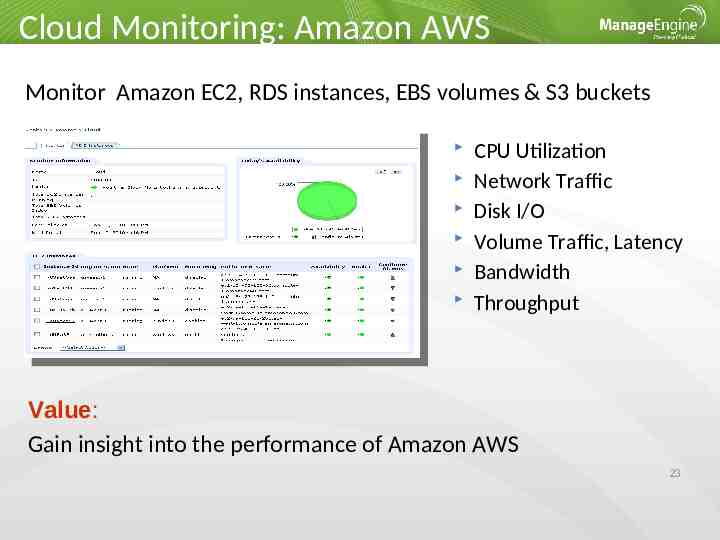
Cloud Monitoring: Amazon AWS Monitor Amazon EC2, RDS instances, EBS volumes & S3 buckets CPU Utilization Network Traffic Disk I/O Volume Traffic, Latency Bandwidth Throughput Value: Gain insight into the performance of Amazon AWS 23
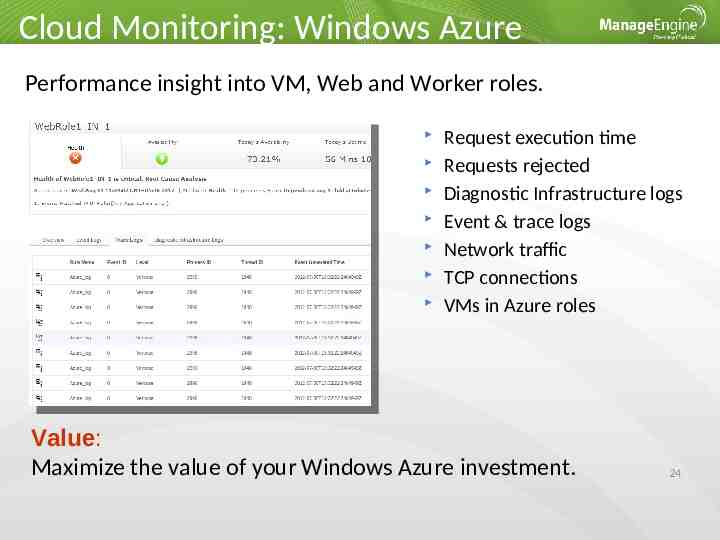
Cloud Monitoring: Windows Azure Performance insight into VM, Web and Worker roles. Request execution time Requests rejected Diagnostic Infrastructure logs Event & trace logs Network traffic TCP connections VMs in Azure roles Value: Maximize the value of your Windows Azure investment. 24
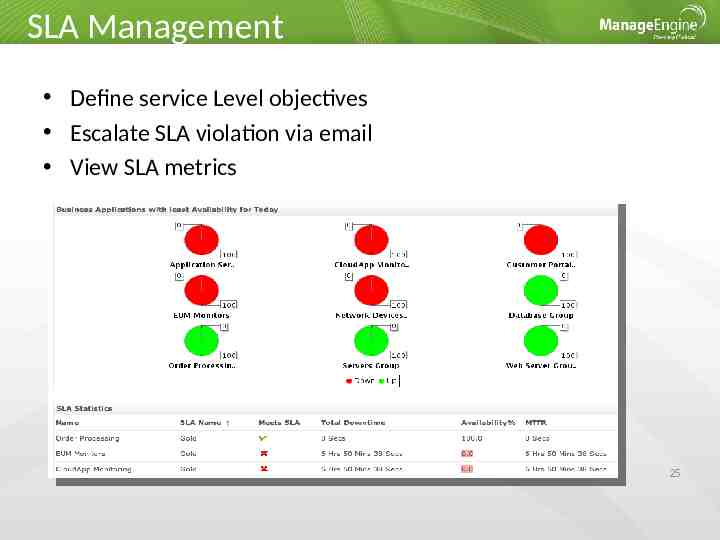
SLA Management Define service Level objectives Escalate SLA violation via email View SLA metrics 25
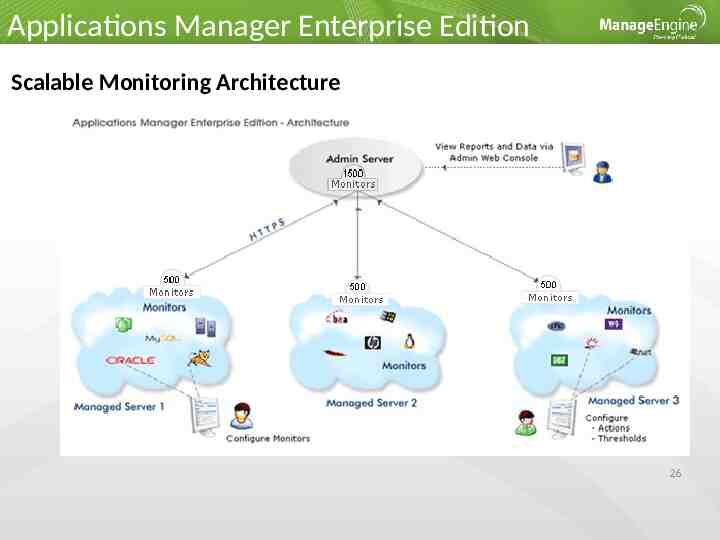
Applications Manager Enterprise Edition Scalable Monitoring Architecture 26
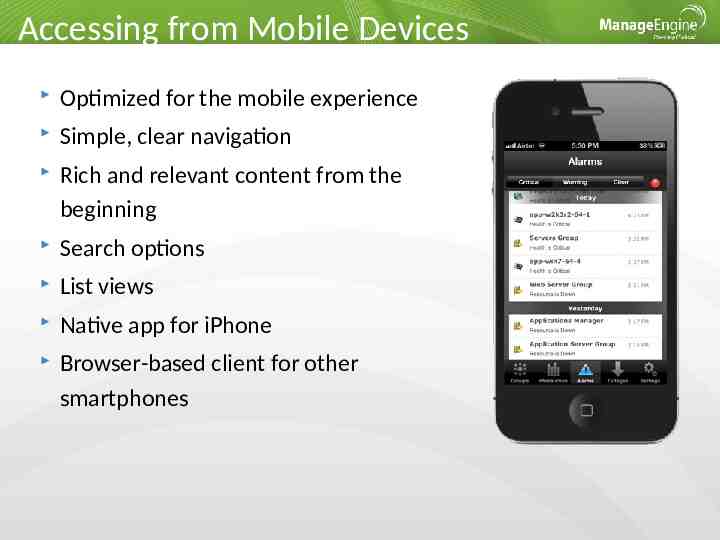
Accessing from Mobile Devices Optimized for the mobile experience Simple, clear navigation Rich and relevant content from the beginning Search options List views Native app for iPhone Browser-based client for other smartphones
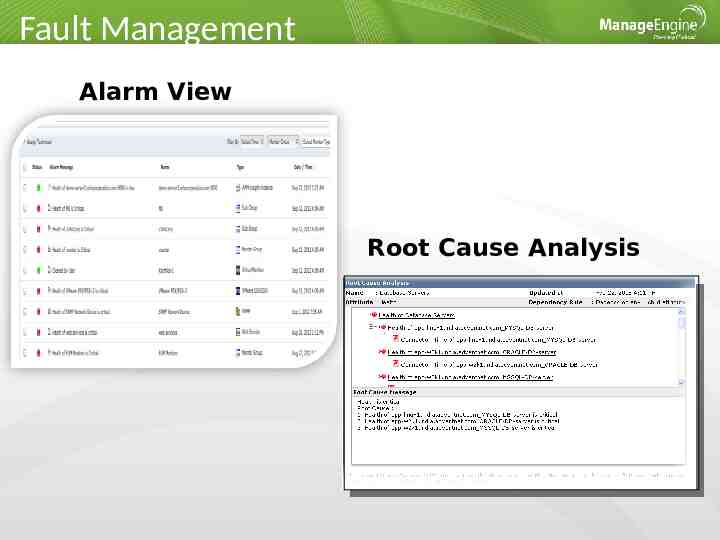
Fault Management Alarm View Root Cause Analysis
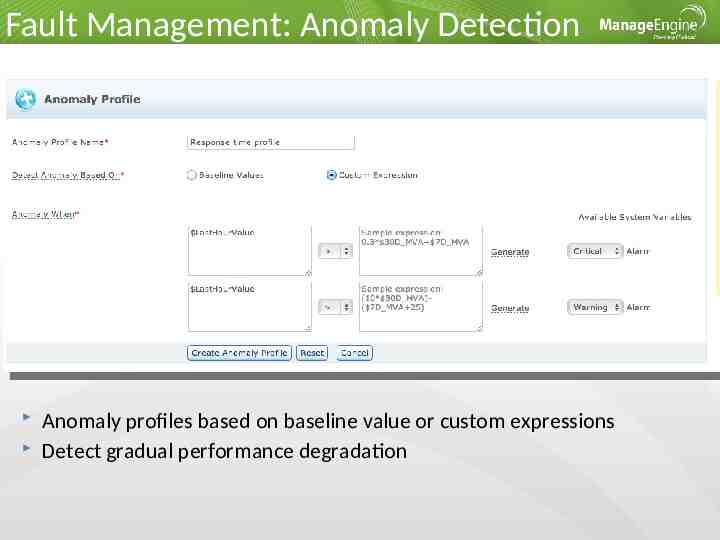
Fault Management: Anomaly Detection Anomaly profiles based on baseline value or custom expressions Detect gradual performance degradation
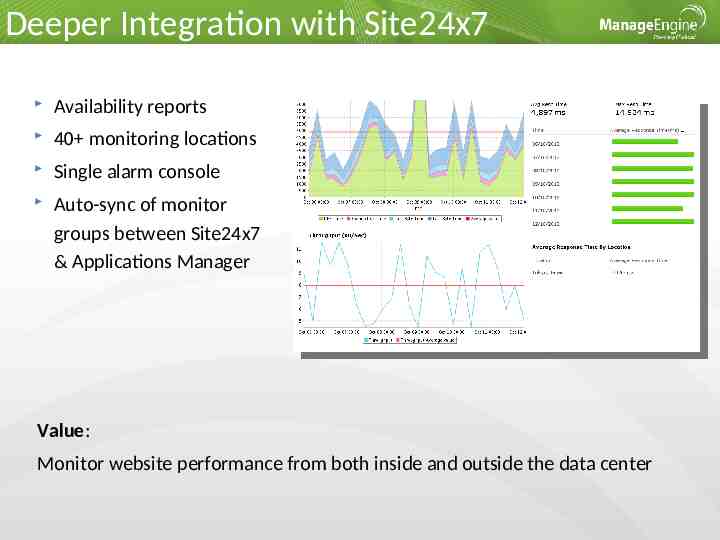
Deeper Integration with Site24x7 Availability reports 40 monitoring locations Single alarm console Auto-sync of monitor groups between Site24x7 & Applications Manager Value: Monitor website performance from both inside and outside the data center
Customer Usage Scenario CRM Application Over 100 users for contact details Monitors servers, databases, log files and application servers Uses APM for troubleshooting and availability monitoring IT operators use APM for availability monitoring Admin: Identify bottlenecks in infrastructure, plan capacity Line of business managers: SLA reports on a quarterly basis 31
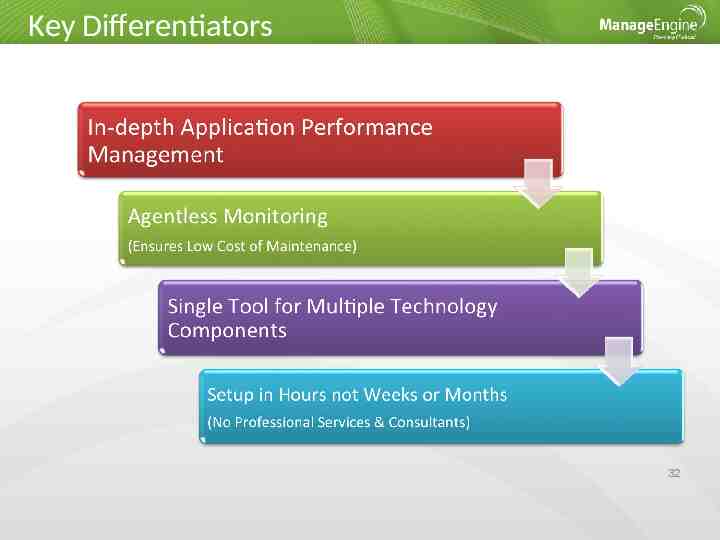
Key Differentiators 32
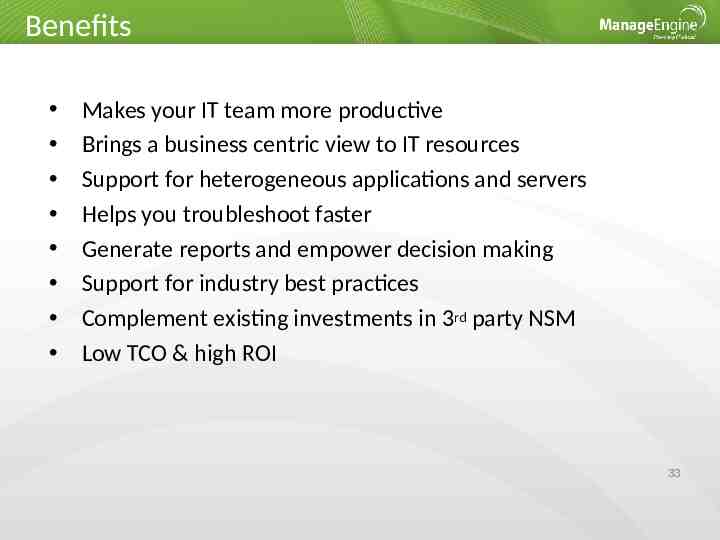
Benefits Makes your IT team more productive Brings a business centric view to IT resources Support for heterogeneous applications and servers Helps you troubleshoot faster Generate reports and empower decision making Support for industry best practices Complement existing investments in 3rd party NSM Low TCO & high ROI 33
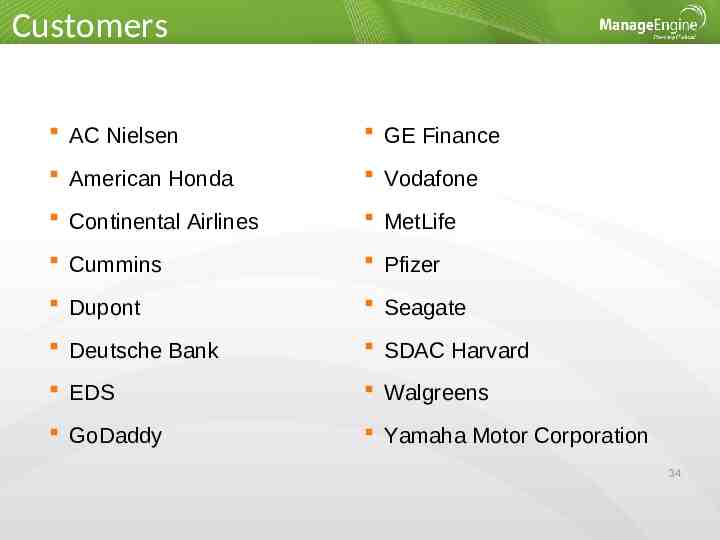
Customers AC Nielsen GE Finance American Honda Vodafone Continental Airlines MetLife Cummins Pfizer Dupont Seagate Deutsche Bank SDAC Harvard EDS Walgreens GoDaddy Yamaha Motor Corporation 34
Customer Quote "We managed to save tens of thousands of dollars by switching from CA's Wily Introscope“ - Bill Bohlen, Hallmark Channel. 35
Summary
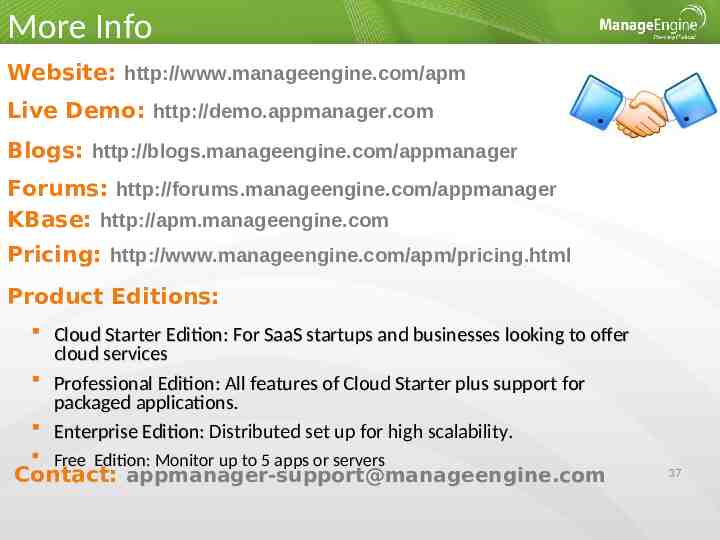
More Info Website: http://www.manageengine.com/apm Live Demo: http://demo.appmanager.com Blogs: http://blogs.manageengine.com/appmanager Forums: http://forums.manageengine.com/appmanager KBase: http://apm.manageengine.com Pricing: http://www.manageengine.com/apm/pricing.html Product Editions: Cloud Starter Edition: For SaaS startups and businesses looking to offer cloud services Professional Edition: All features of Cloud Starter plus support for packaged applications. Enterprise Edition: Distributed set up for high scalability. Free Edition: Edition Monitor up to 5 apps or servers Contact: [email protected] 37