Learning Tableau: Chapter 5 การคำนวณระดับตาราง (Table Calculations)


49 Slides1.00 MB
Learning Tableau: Chapter 5 การคำนวณระดับตาราง (Table Calculations)
Topics Overview Quick table calculations Relative vs Fixed Scope and Direction Addressing and Partitioning Custom table calculations Examples Data densification
1. Overview การคำนวณแบบตาราง เป็นเครื่องมือที่ทรงพลังของ Tableau ใช้จด ั การกับข้อมูลที่ไม่มโี ครงสร้างข้อมูลที่ดี โดยไม่ต้อง รอคนมาแก้ขอ ้ มูลที่ Data source การคำนวณแบบตารางอาจจะง่ายมาก ๆ จนไปถึง ซับ ซ้อนมาก ๆ (เช่น ต้องเข้าใจเรื่องการให้ที่อยู่, การแบ่ง ข้อมูลเป็นส่วน, และ ทำให้ขอ ้ มูลหนาแน่นขึ้น บทนี้จะใช้ Data เดิม เหมือนบทที่แล้ว
Dataset
Overview of Table Calculations Row-level/Aggregate เป็นการคำนวณที่ data source เลย การคำนวณระดับตารางจะเป็นการคำนวณกับตาราง ข้อมูลใน Cache หลังจาก Query
Overview of Table Calculations Aggregation การคำนวณตารางจะคำนวณบนกลุ่มของข้อมูล (Aggregate data) ทุก field ในการคำนวณตารางจะต้องเป็น Aggregate field Filter Filter แบบปกติจะกรองข้อมูลก่อนการคำนวณตาราง สามารถใช้การคำนวณตารางเป็นการกรองข้อมูลได้ เหมือนกัน โดยมีลำดับการคำนวณดังนี้ Row-level / aggregate filter ที่ถก ู ใช้ก่อน จากนัน ้ ค่อยการคำนวณ ตาราง
การสร้างการคำนวณระดับตาราง มีหลายวิธี - เมนู Drop-down ข้าง ๆ field ที่เป็นตัวเลขและเป็นแบบ aggregate ใน view - จากนัน ้ เลือก Quick Table Calculation หรือ - เลือก Add Table Calculation - สร้าง Calculated field และ ใช้ function สำหรับคำนวณ ระดับตารางเพื่อสร้างการคำนวณระดับตารางด้วยตนเอง
Topics Overview Quick table calculations Relative vs Fixed Scope and Direction Addressing and Partitioning Custom table calculations Examples Data densification
Quick table calculations เป็นการคำนวณระดับตารางที่ Tableau เตรียมไว้ให้ สามารถใช้คำนวณกับ field ใด ๆ ที่เป็น measurement ใน view ตัวอย่าง : Running Total, Difference, Percent Different, Moving Average, YTD total, YTD Growth
ลองทำดู Double click เพื่อดูสต ู ร ลากไปที่ Data pane จะกลายเป็น field ที่ใช้ ต่อใน view อื่น
ตัวอย่าง Quick table calculation
Topics Overview Quick table calculations Relative vs Fixed Scope and Direction Addressing and Partitioning Custom table calculations Examples Data densification
Relative vs Fixed computation Relative Fixed การคำนวณสัมพันธ์กับ การคำนวณใช้ data layout ของตาราง อย่างน้อย 1 dimension แม้ layout ของ view จะ เปลี่ยนไป, Scope กับ Direction ก็ยง ั สัมพันธ์ กับตารางแบบเดิม Scope กับ Dimension จะคงที่กับ dimension นัน ้ ๆ ไม่วา่ dimension จะถูกย้ายไปไหน
Topics Overview Quick table calculations Relative vs Fixed Scope and Direction Addressing and Partitioning Custom table calculations Examples Data densification
Scope and direction ใช้อธิบายวิธก ี ารคำนวณระดับตารางว่ามีความสัมพันธ์ กับตารางอย่างไร เมื่อการคำนวณระดับตารางของเราขึ้นกับ layout ของ ตาราง, การเปลี่ยน view จะไม่เปลี่ยน scope และ direction Scope ขอบเขตของข้อมูลในตารางที่ถก ู ใช้สำหรับการ คำนวณ Direction ทิศทางการอ่านข้อมูลภายใน Scope เพื่อ ประมวลผล นิยาม Scope และ direction โดยเลือก drop-down menu ที่ Field ใน View แล้วเลือก “Compute Using”
Table - ข้อมูลทัง ้ หมด Cell - ข้อมูลระดับเล็กที่สด ุ ใน View Pane - ข้อมูลเล็กระดับที่สามใน View (1 pane นิยามโดย Year กับ Region)
Scope & Direction Examples 1. ใส่ field YEAR(Order Date) and QUARTER(Order Date) ที่ Rows 2. ใส่ field Region, and Department ที่ Columns 3. สร้าง calculated field อันใหม่ช่ อ ื Index 4. ใส่ Function Index() ให้ field ข้อ 3 (Function นี้จะเริม ่ จาก 1 และเพิม ่ ทีละ 1 เมื่อมันเคลื่อนที่ไปเรื่อย ๆ) 5. ในตัวอย่างนี้เราจะใส่ field Index ใน shelf Text (แทนที่จะใส่ Sale เหมือนตัวอย่างใน Slide ที่แล้ว) 6. ใช้ drop-down ที่ field index “Compute Using” แล้วลอง เลือกหลาย ๆ แบบ พร้อมดูผลลัพธ์
Table (across)
Table (down)
Table (across then down)
Pane (across)
Pane (down)
Pane (across then down)
Scope and Direction ใช้ scope & direction ได้กับทุก ๆ การคำนวณระดับ ตาราง ลองนึกดูวา่ หากเราจะหา percent ความแตกต่างระหว่าง cell, การเลือก scope และ direction จะให้ค่าต่างกัน อย่างไร ? Scope & direction จะทำงานสัมพันธ์กับ layout ของ ตาราง หากเราจัดลำดับ Field ของเราใหม่, การคำนวณ ยังคำเป็น Scope กับ Direction เดิมอยู่ เช่น หากเราลองสลับ Year of Order Date กับ Department การคำนวณ index ก็ยง ั เป็นไปตาม scope และ direction ที่เรานิยามไว้ตัง ้ แต่ต้น
Topics Overview Quick table calculations Relative vs Fixed Scope and Direction Addressing and Partitioning Custom table calculations Examples Data densification
Addressing & Partitioning คล้าย scope กับ direction ใช้เมื่อเราจะคำนวณระดับตารางโดยอ้างอิงไปที่ขอ ้ มูลใน cell เฉพาะ cell ใด cell หนึ่ง เราระบุ addressing โดยเลือก dimension ใน view, dimension ที่เหลือคือ partitioning การคำนวณระดับตารางจะไม่สม ั พันธ์กับ layout ของ ตาราง ดังนัน ้ Address กับ Partition จะช่วยให้รวม ควบคุมข้อมูลสำหรับการคำนวณได้ดีกว่า
Example ใช้ View จากตัวอย่างที่แล้ว เลือก Edit Table Calculation จาก drop-down menu ของ field Index ที่อยูใ่ น Text Check Department ใต้ Specific Dimension
Example จากตัวอย่าง คือ เราเลือก Department สำหรับ Addressing (การให้ที่อยู)่ Dimension อื่น ๆ คือ Partitioning (การแบ่งส่วนที่ Address จะถูกเริม ่ นับใหม่) แม้ผลลัพธ์จะดูคล้าย Pane (across) แต่ความแตกต่าง คือ ตอนจัดเรียง dimension ของ view ใหม่ หาก Pane (across), ไม่วา่ จะจัดเรียง dimension ใหม่อย่างไร การคำนวณก็ยง ั เป็นแบบ Pane (across) แต่หากใข้ dimension เป็น addressing, การคำนวณจะไม่ เหมือน Pane (across แล้ว), Index ก็จะเพิม ่ ตาม Department อย่างเดิม
ผลการสลับ Row กับ Columns ที่ Toolbar
Advanced addressing & partitioning ให้ swap rows กับ columns กลับไปอย่างเดิม เลือก Quarter of Order Date สำหรับ Addressing ด้วย สังเกต Highlight สีเหลืองที่ Partition
Advanced addressing & partitioning แต่ถ้าเลือก Department กับ Year of Order Date เป็นAddressing สังเกต Highlight สีเหลืองที่ Partition
Topics Overview Quick table calculations Relative vs Fixed Scope and Direction Addressing and Partitioning Custom table calculations Examples Data densification
Custom table calculations เราสามารถคำนวณระดับตารางของเราเองได้ แทน quick table calculation ในแต่ละตัวอย่างในหัวข้อ Custom table calculations นี้ เราจะเลือก Compute Using Category Department จะเป็น partition แทนการเป็น address แล้ว ประเภทของ function สำหรับคำนวณระดับตาราง Meta table functions, Lookup and Previous Value, Running functions, Window functions, Rank functions, R Script functions, Total
Meta Table Functions เป็น function ที่ให้ขอ ้ มูลเกี่ยวกับ partitioning / addressing เช่น Index, First, Last, Size
Lookup and Previous Value Lookup() ใช้ตอนเราอ้างอิงไปยัง Cell อื่น เช่น Lookup(ATTR([Category]), -1) Previous Value() ใช้ทดค่าจากคราวที่แล้วไปเรื่อย ๆ เช่น Previous Value(“”) “,” ATTR([Category])
Running functions Running Avg Running Count Running Sum Running Min Running Max
Window functions Functions แบบ Window function จะคำนวณทุก ๆ แถวใน partition นัน ้ Window sum, Window Avg, Window Max, Window Min
Rank functions
Other functions R Script Functions ทำให้เรารวม R กับ Tableau ได้ Total ไม่ได้ทำงานกับข้อมูลใน cache จะ Query ข้อมูลใหม่ แล้วค่อยรวมค่าใน partition หนึ่ง Total(SUM([Sales])) จะให้ค่าเดียวกับ Window Sum(SUM([Sales]))
Topics Overview Quick table calculations Relative vs Fixed Scope and Direction Addressing and Partitioning Custom table calculations Examples Data densification
Year – over – Year growth เป็น Option หนึ่งใน Quick Table Calculation field Sum(Sales) field ที่สอง ใส่ Year-over-Year growth และ เปลี่ยนชนิดของ mark เป็น Bar
Ranking within higher levels
Ranking within higher levels สังเกตว่า ตัวอย่างที่แล้ว แม้เราจะ Sort Department ตาม Sum of Sale แต่ Technology ดันมาก่อนทุกที เพราะ Tableau sort Sale ในทุก ๆ level (ผลรวมของทุก ๆ Technology จะมากกว่าใครหากรวมทุก Region) หากต้องการให้ Sort เฉพาะ region นัน ้ ๆ 1. สร้าง Adhoc calculated field (เปลี่ยนให้เป็น discrete ด้วย) 2. ย้าย field ในข้อที่หนึ่งไปทางซ้ายของ Department
คราวนี้จะได้รูปด้านล่าง เพราะ Tableau จะ Sort ตาม Header จากซ้ายไปขวา (Region - RANK - Department) ซ่อน RANK header โดย drop-down list uncheck Show Row Headers
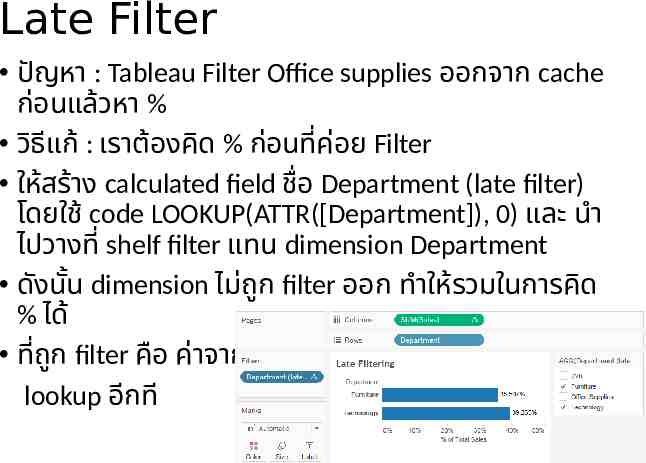
Late filtering รูปนี้เรา file เอา department Office supplies ออก ดังนัน ้ การคิด % มันจะคิดแค่ Furniture กับ Technology เท่านัน ้ แต่จริง ๆ แล้วเราอยากคิด % โดยรวมของ Office Supplies ด้วย (แต่ยง ั คง Filter Office Supplies ออก เหมือนเดิม)
Late Filter ปัญหา : Tableau Filter Office supplies ออกจาก cache ก่อนแล้วหา % วิธแ ี ก้ : เราต้องคิด % ก่อนที่ค่อย Filter ให้สร้าง calculated field ชื่อ Department (late filter) โดยใช้ code LOOKUP(ATTR([Department]), 0) และ นำ ไปวางที่ shelf filter แทน dimension Department ดังนัน ู filter ออก ทำให้รวมในการคิด ้ dimension ไม่ถก % ได้ ที่ถก ู filter คือ ค่าจากการ lookup อีกที