LEAD SCORING CASE STUDY To Build a Logistic Regression Model To
17 Slides397.69 KB
LEAD SCORING CASE STUDY To Build a Logistic Regression Model To predict whether a lead for online courses for an X education company would be successfully converted or not By- 1. Pratibha Chougule 2. Bhagyashree Dhole
Problem Statement X Education cells online courses to industry professionals X Education gets a lot of leads, its lead conversion rate is very poor. For example, if, say, they acquire 100 leads in a day, only about 30 of them are converted. To make this process more efficient, the company wishes to identify the most potential leads, also known as ‘Hot Leads’ If they successfully identify this set of leads, the lead conversion rate should go up as the sales team will now be focusing more on communicating with the potential leads rather than making calls to everyone.
Business Objective To help X Education to select the most promising leads(Hot Leads), i.e. the leads that are most likely to convert into paying customers. To build a logistic regression model to assign a lead score value between 0 and 100 to each of the leads which can be used by the company to target potential leads.
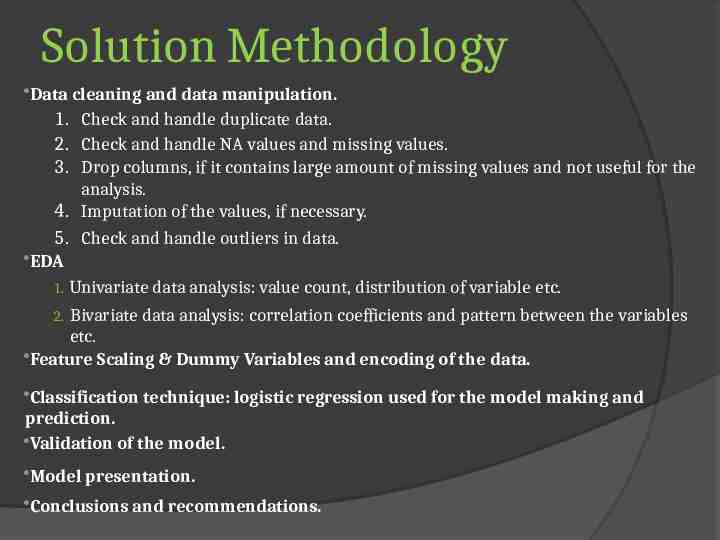
Solution Methodology Data cleaning and data 1. 2. 3. 4. 5. manipulation. Check and handle duplicate data. Check and handle NA values and missing values. Drop columns, if it contains large amount of missing values and not useful for the analysis. Imputation of the values, if necessary. Check and handle outliers in data. EDA 1. Univariate data analysis: value count, distribution of variable etc. Bivariate data analysis: correlation coefficients and pattern between the variables etc. Feature Scaling & Dummy Variables and encoding of the data. 2. Classification technique: logistic regression used for the model making and prediction. Validation of the model. Model presentation. Conclusions and recommendations.
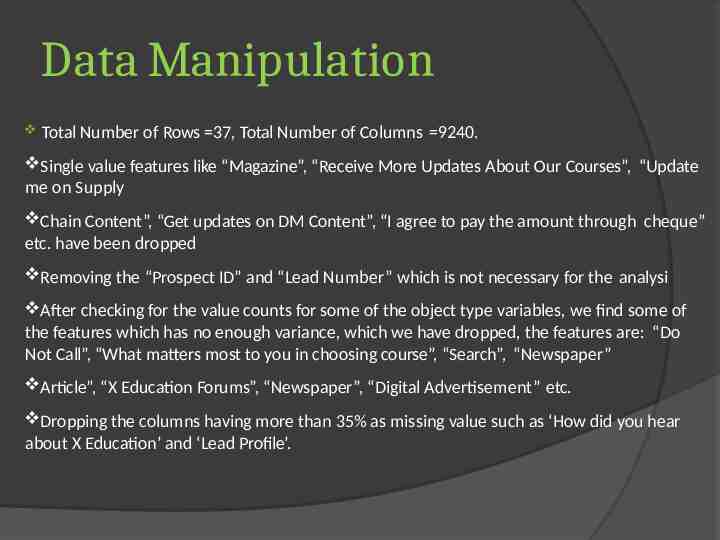
Data Manipulation Total Number of Rows 37, Total Number of Columns 9240. Single value features like “Magazine”, “Receive More Updates About Our Courses”, “Update me on Supply Chain Content”, “Get updates on DM Content”, “I agree to pay the amount through cheque” etc. have been dropped Removing the “Prospect ID” and “Lead Number” which is not necessary for the analysi After checking for the value counts for some of the object type variables, we find some of the features which has no enough variance, which we have dropped, the features are: “Do Not Call”, “What matters most to you in choosing course”, “Search”, “Newspaper” Article”, “X Education Forums”, “Newspaper”, “Digital Advertisement” etc. Dropping the columns having more than 35% as missing value such as ‘How did you hear about X Education’ and ‘Lead Profile’.
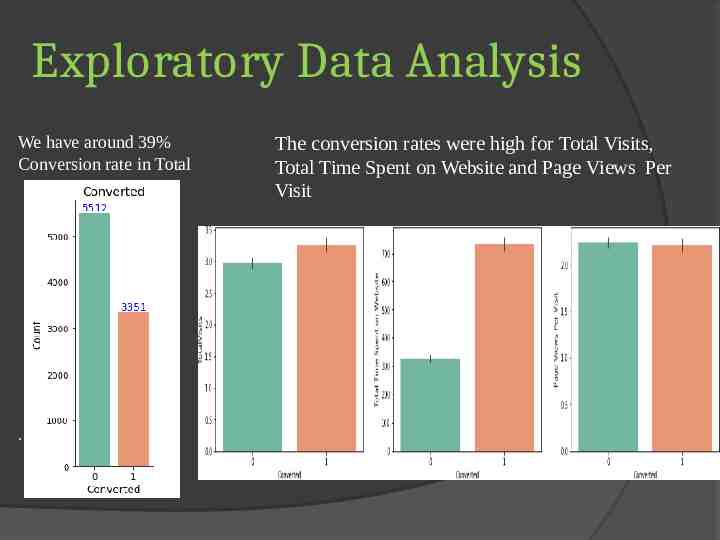
Exploratory Data Analysis We have around 39% Conversion rate in Total . The conversion rates were high for Total Visits, Total Time Spent on Website and Page Views Per Visit
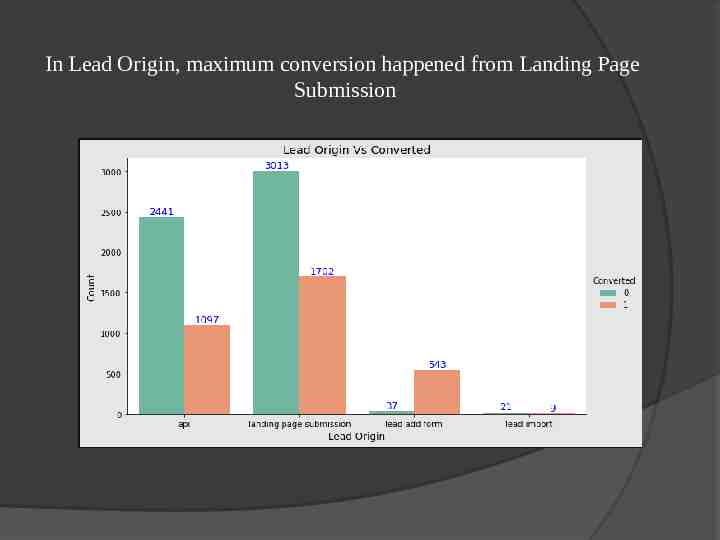
In Lead Origin, maximum conversion happened from Landing Page Submission
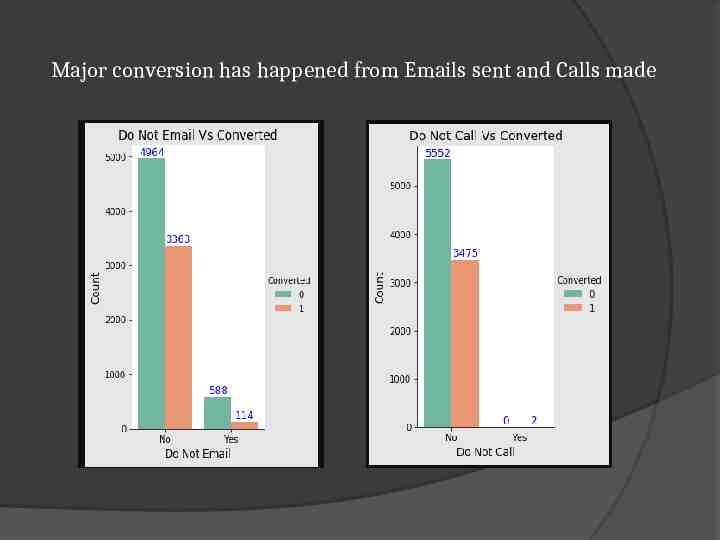
Major conversion has happened from Emails sent and Calls made
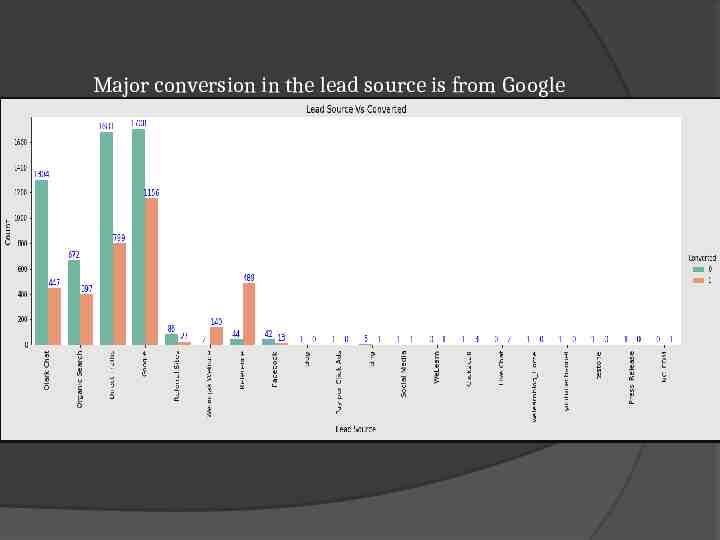
Major conversion in the lead source is from Google
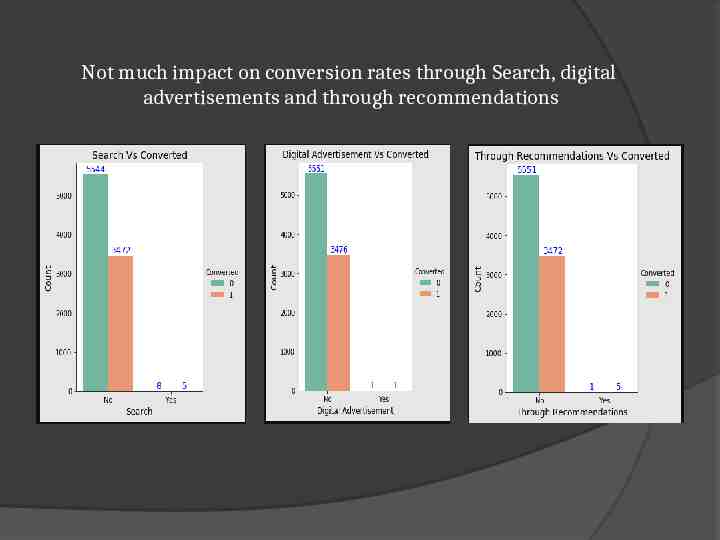
Not much impact on conversion rates through Search, digital advertisements and through recommendations
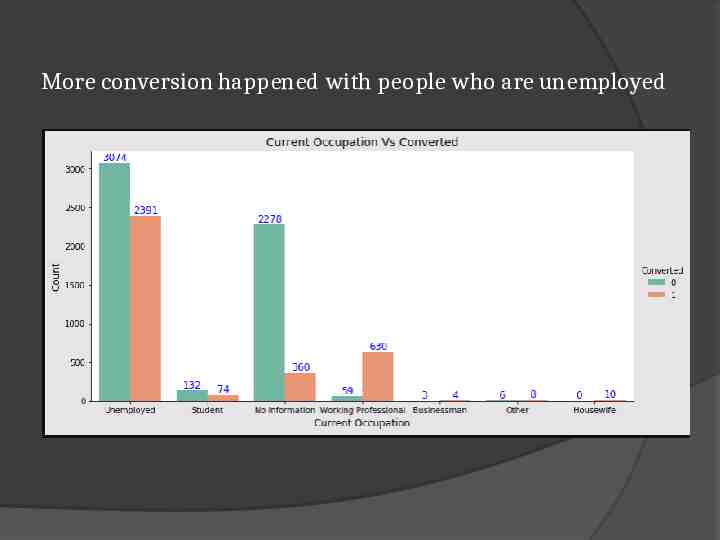
More conversion happened with people who are unemployed
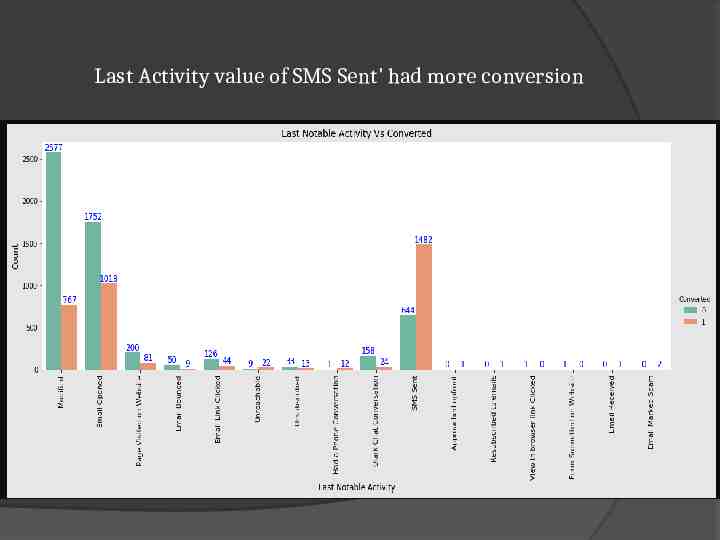
Last Activity value of SMS Sent' had more conversion
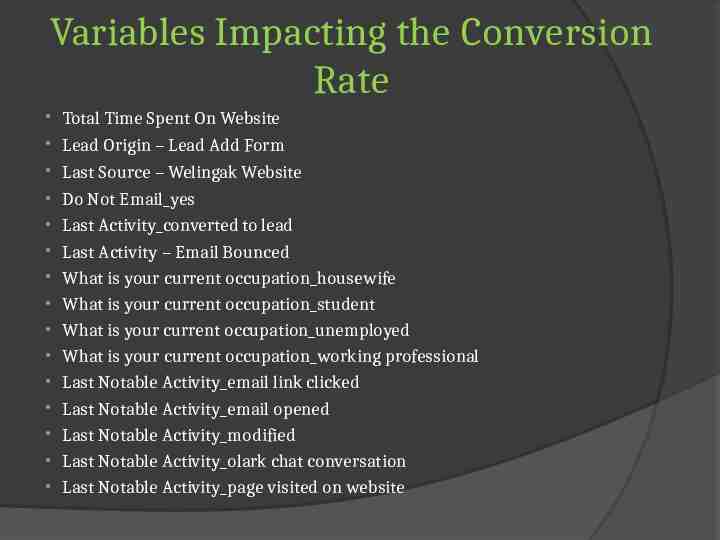
Variables Impacting the Conversion Rate Total Time Spent On Website Lead Origin – Lead Add Form Last Source – Welingak Website Do Not Email yes Last Activity converted to lead Last Activity – Email Bounced What is your current occupation housewife What is your current occupation student What is your current occupation unemployed What is your current occupation working professional Last Notable Activity email link clicked Last Notable Activity email opened Last Notable Activity modified Last Notable Activity olark chat conversation Last Notable Activity page visited on website
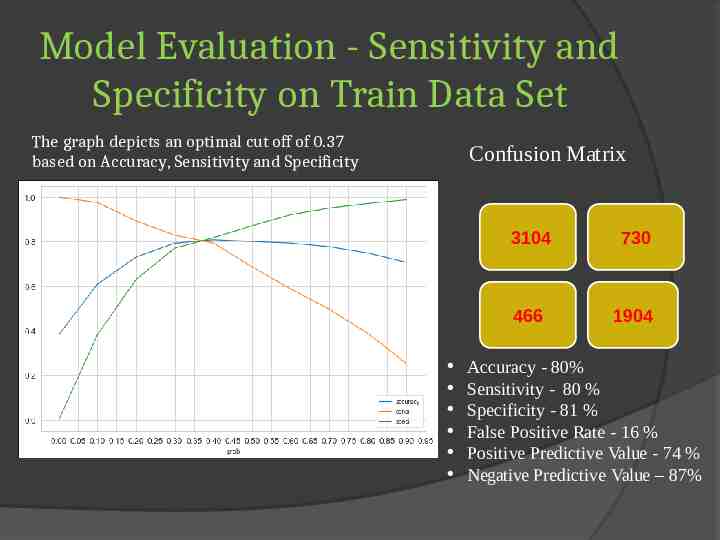
Model Evaluation - Sensitivity and Specificity on Train Data Set The graph depicts an optimal cut off of 0.37 based on Accuracy, Sensitivity and Specificity Confusion Matrix 3104 730 466 1904 Accuracy - 80% Sensitivity - 80 % Specificity - 81 % False Positive Rate - 16 % Positive Predictive Value - 74 % Negative Predictive Value – 87%
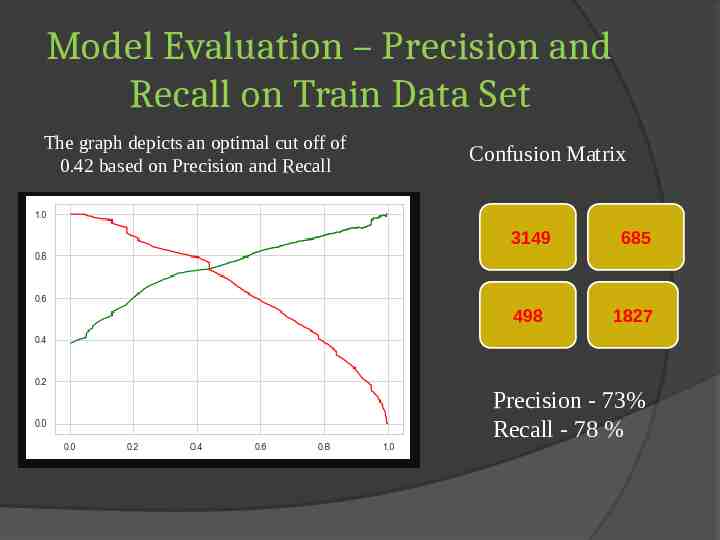
Model Evaluation – Precision and Recall on Train Data Set The graph depicts an optimal cut off of 0.42 based on Precision and Recall Confusion Matrix 3149 685 498 1827 Precision - 73% Recall - 78 %
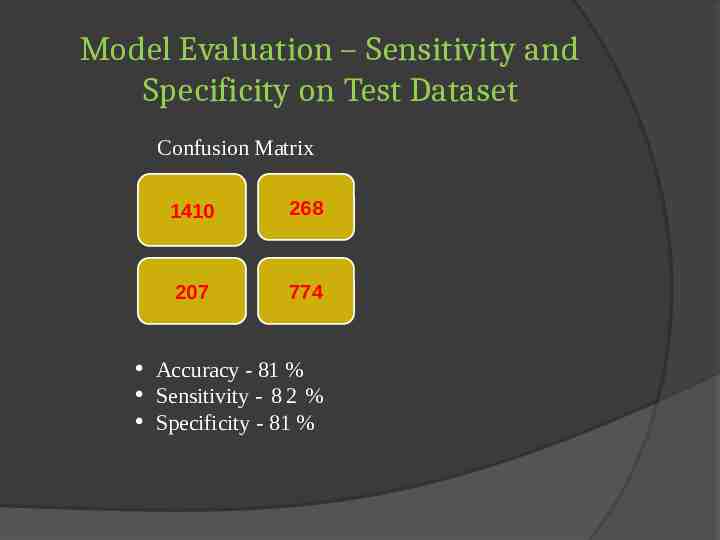
Model Evaluation – Sensitivity and Specificity on Test Dataset Confusion Matrix 1410 268 207 774 Accuracy - 81 % Sensitivity - 8 2 % Specificity - 81 %
Conclusion While we have checked both Sensitivity-Specificity as well as Precision and Recall Metrics, we have considered the optimal cut off based on Sensitivity and Specificity for calculating the final prediction. – Accuracy, Sensitivity and Specificity values of test set are around 81%, 82% and 81% which are approximately closer to the respective values calculated using trained set. Also the lead score calculated shows the conversion rate on the final predicted model is around 79% (in train set) and 78% in test set The top 3 variables that contribute for lead getting converted in the model are Total Time Spent on Website Lead Add Form (from Lead Origin) What is your current occupation working professional Hence overall this model seems to be good.