2016 UTAH NURSING EDUCATION P R E PA R E D BY C L A R K R U T T I N
17 Slides2.97 MB
2016 UTAH NURSING EDUCATION P R E PA R E D BY C L A R K R U T T I N G E R , M PA , M B A C S E N I O R I N S T I T U T I O N A L R E S E A R C H A N A LY S T
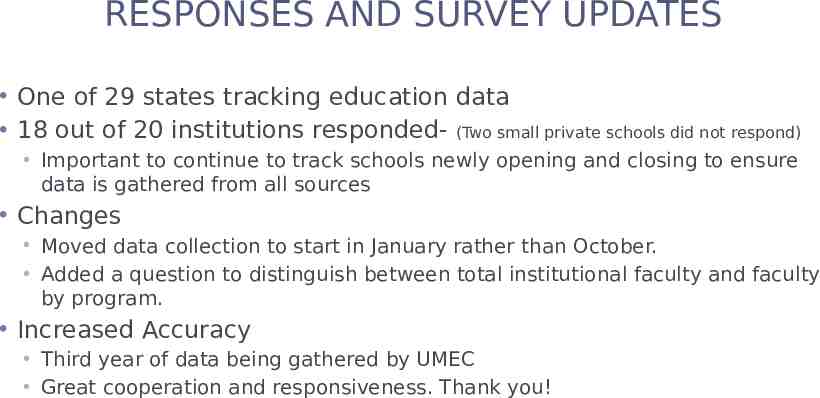
RESPONSES AND SURVEY UPDATES One of 29 states tracking education data 18 out of 20 institutions responded- (Two small private schools did not respond) Important to continue to track schools newly opening and closing to ensure data is gathered from all sources Changes Moved data collection to start in January rather than October. Added a question to distinguish between total institutional faculty and faculty by program. Increased Accuracy Third year of data being gathered by UMEC Great cooperation and responsiveness. Thank you!
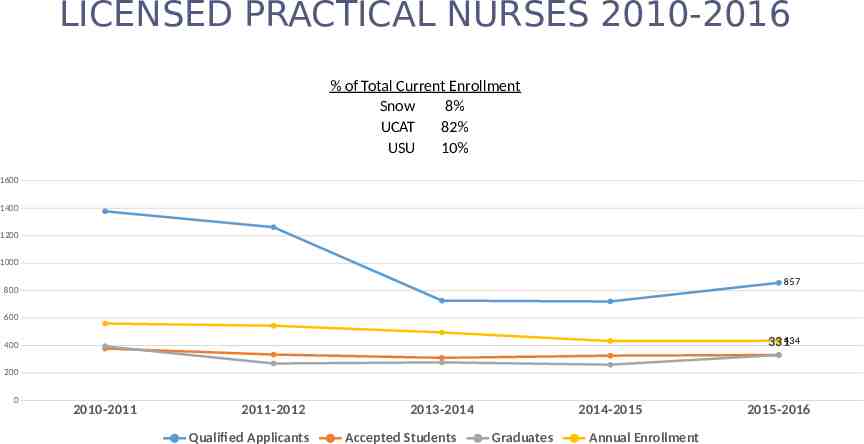
LICENSED PRACTICAL NURSES 2010-2016 % of Total Current Enrollment Snow 8% UCAT 82% USU 10% 1600 1400 1200 1000 857 800 600 331434 400 200 0 2010-2011 2011-2012 Qualified Applicants 2013-2014 Accepted Students 2014-2015 Graduates Annual Enrollment 2015-2016
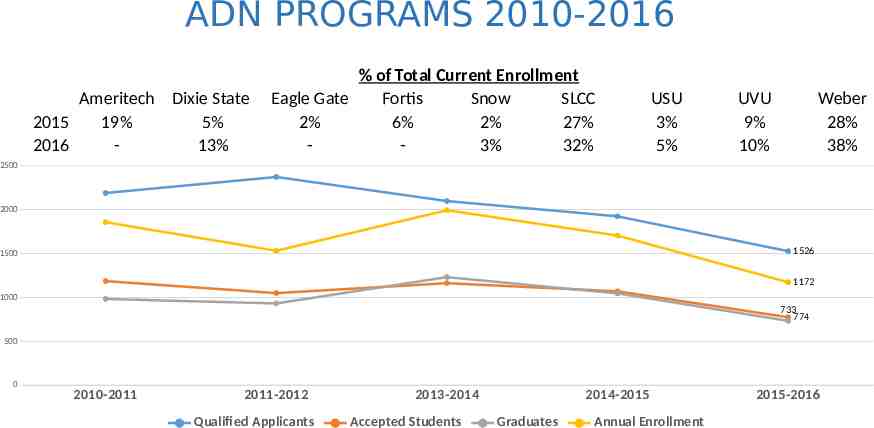
ADN PROGRAMS 2010-2016 Ameritech Dixie State 2015 19% 5% 2016 13% % of Total Current Enrollment Eagle Gate Fortis Snow SLCC 2% 6% 2% 27% 3% 32% USU 3% 5% UVU 9% 10% Weber 28% 38% 2500 2000 1526 1500 1172 1000 733 774 500 0 2010-2011 2011-2012 Qualified Applicants 2013-2014 Accepted Students 2014-2015 Graduates Annual Enrollment 2015-2016
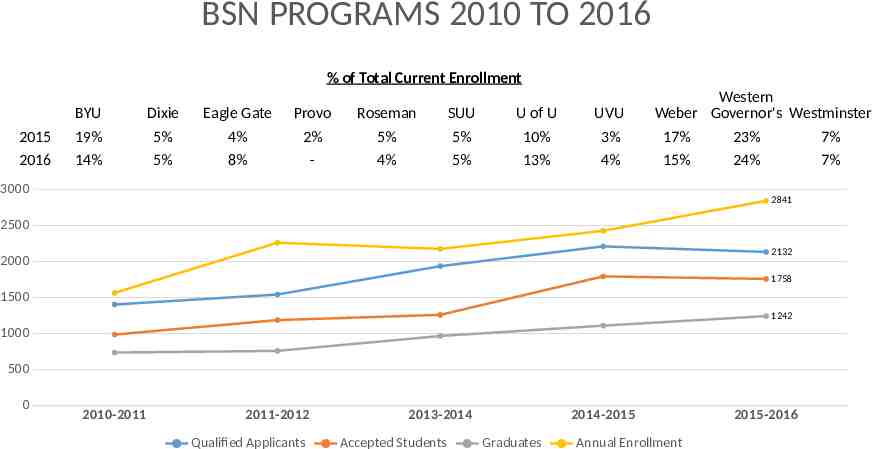
BSN PROGRAMS 2010 TO 2016 % of Total Current Enrollment 2015 2016 BYU 19% 14% Dixie 5% 5% Eagle Gate 4% 8% Provo 2% - Roseman 5% 4% SUU 5% 5% U of U 10% 13% UVU 3% 4% Western Weber Governor's Westminster 17% 23% 7% 15% 24% 7% 3000 2841 2500 2132 2000 1758 1500 1242 1000 500 0 2010-2011 2011-2012 Qualified Applicants 2013-2014 Accepted Students 2014-2015 Graduates Annual Enrollment 2015-2016
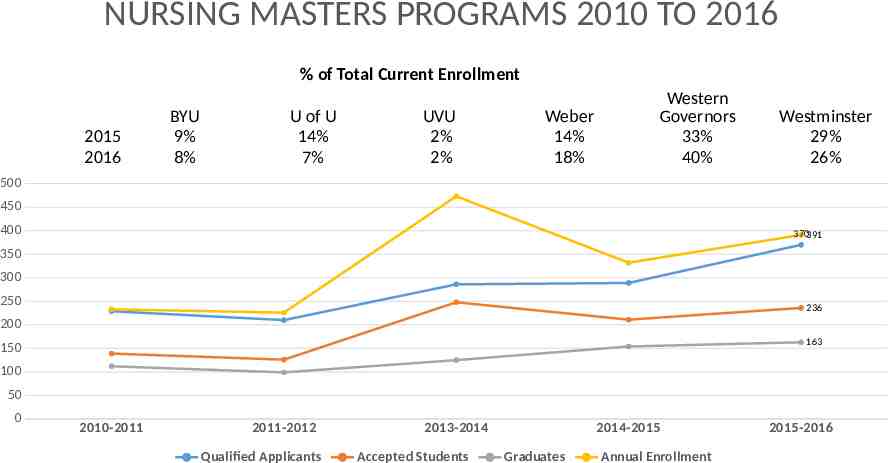
NURSING MASTERS PROGRAMS 2010 TO 2016 % of Total Current Enrollment 2015 2016 BYU 9% 8% U of U 14% 7% UVU 2% 2% Weber 14% 18% Western Governors 33% 40% Westminster 29% 26% 500 450 400 370391 350 300 250 236 200 163 150 100 50 0 2010-2011 2011-2012 Qualified Applicants 2013-2014 Accepted Students 2014-2015 Graduates Annual Enrollment 2015-2016
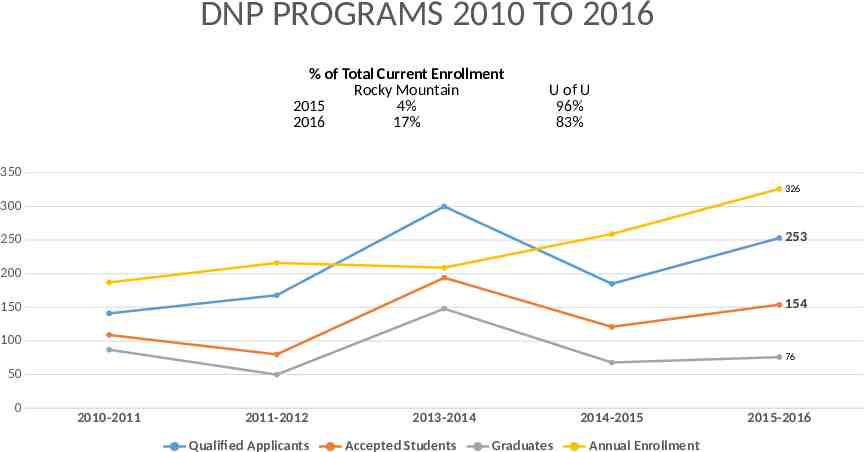
DNP PROGRAMS 2010 TO 2016 % of Total Current Enrollment Rocky Mountain 2015 4% 2016 17% U of U 96% 83% 350 326 300 253 250 200 154 150 100 76 50 0 2010-2011 2011-2012 Qualified Applicants 2013-2014 Accepted Students 2014-2015 Graduates Annual Enrollment 2015-2016
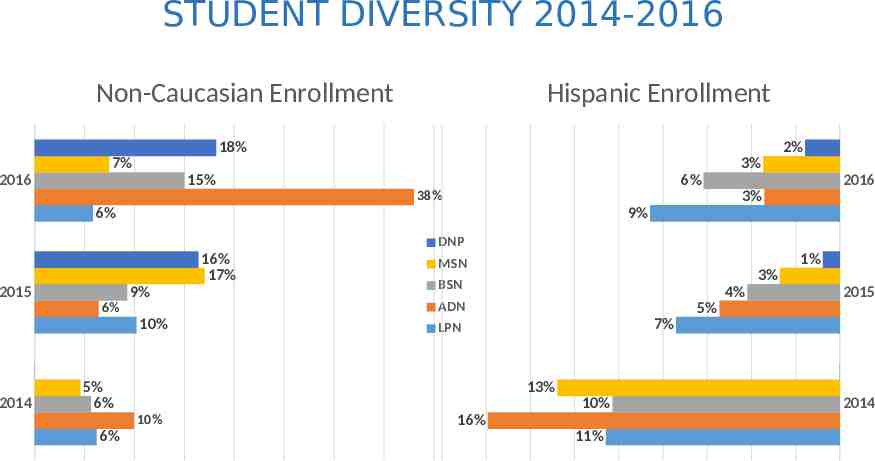
STUDENT DIVERSITY 2014-2016 Non-Caucasian Enrollment Hispanic Enrollment 18% 2% 7% 3% 2016 15% 6% 2016 3% 38% 6% 9% DNP 16% 17% 2015 9% 6% 10% 2014 3% BSN 4% ADN 2015 5% 7% LPN 5% 6% 13% 10% 10% 6% 1% MSN 16% 11% 2014
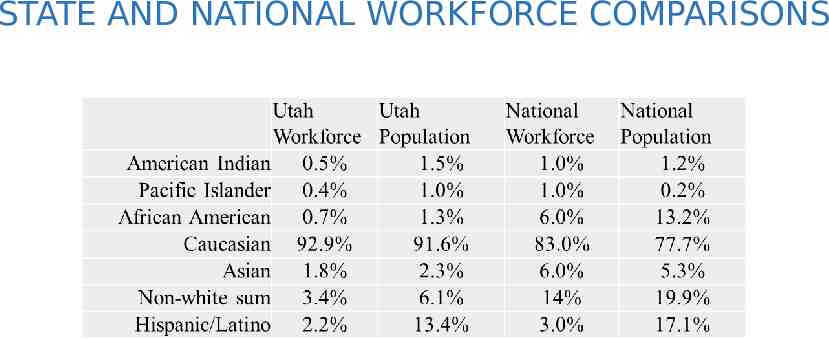
STATE AND NATIONAL WORKFORCE COMPARISONS
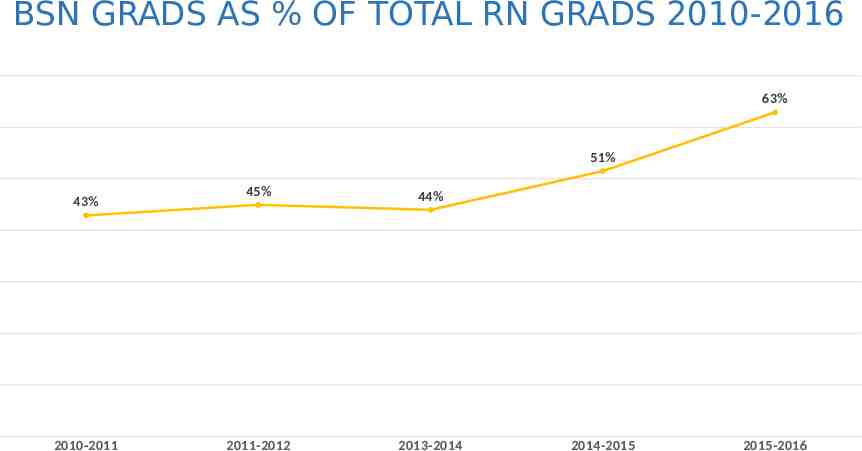
BSN GRADS AS % OF TOTAL RN GRADS 2010-2016 63% 51% 43% 2010-2011 45% 44% 2011-2012 2013-2014 2014-2015 2015-2016
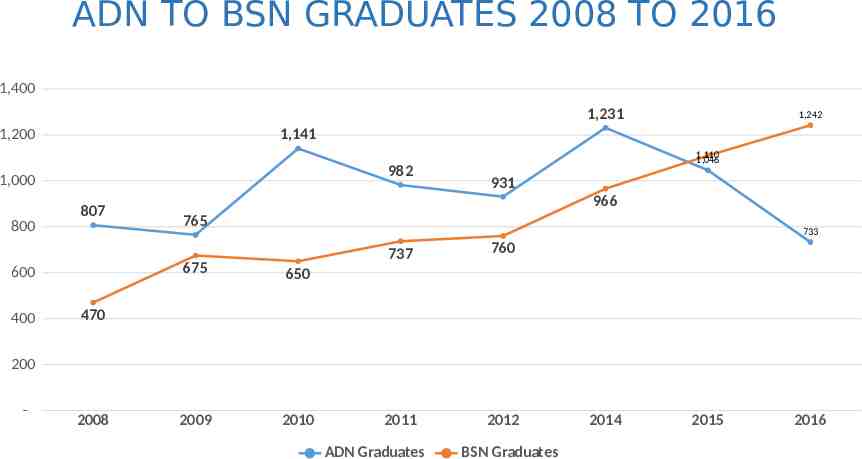
ADN TO BSN GRADUATES 2008 TO 2016 1,400 1,231 1,200 1,141 982 1,000 800 807 600 400 1,242 1,110 1,046 931 966 765 733 675 650 2009 2010 737 760 2011 2012 470 200 - 2008 ADN Graduates BSN Graduates 2014 2015 2016
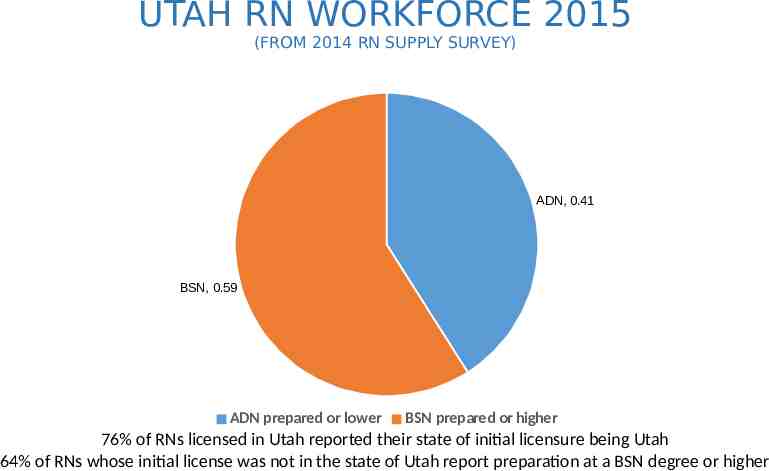
UTAH RN WORKFORCE 2015 (FROM 2014 RN SUPPLY SURVEY) ADN, 0.41 BSN, 0.59 ADN prepared or lower BSN prepared or higher 76% of RNs licensed in Utah reported their state of initial licensure being Utah 64% of RNs whose initial license was not in the state of Utah report preparation at a BSN degree or higher
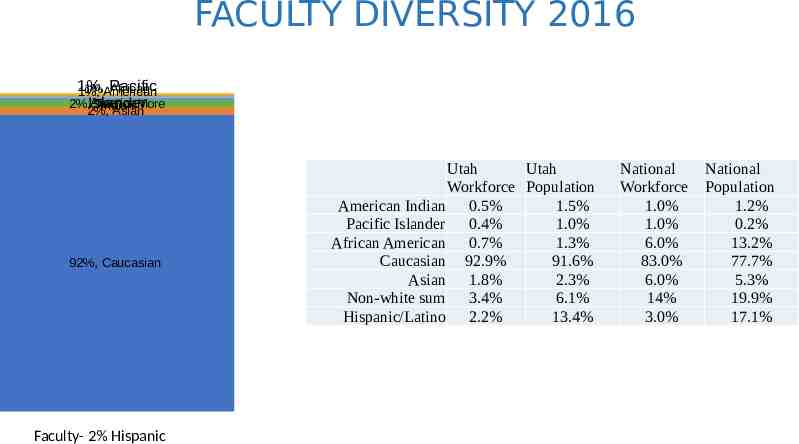
FACULTY DIVERSITY 2016 1%, Pacific 1%,American African 1%, American 2%,Islander Two or More Indian 2%, Asian 92%, Caucasian Faculty- 2% Hispanic Utah Utah Workforce Population American Indian 0.5% 1.5% Pacific Islander 0.4% 1.0% African American 0.7% 1.3% Caucasian 92.9% 91.6% Asian 1.8% 2.3% Non-white sum 3.4% 6.1% Hispanic/Latino 2.2% 13.4% National Workforce 1.0% 1.0% 6.0% 83.0% 6.0% 14% 3.0% National Population 1.2% 0.2% 13.2% 77.7% 5.3% 19.9% 17.1%
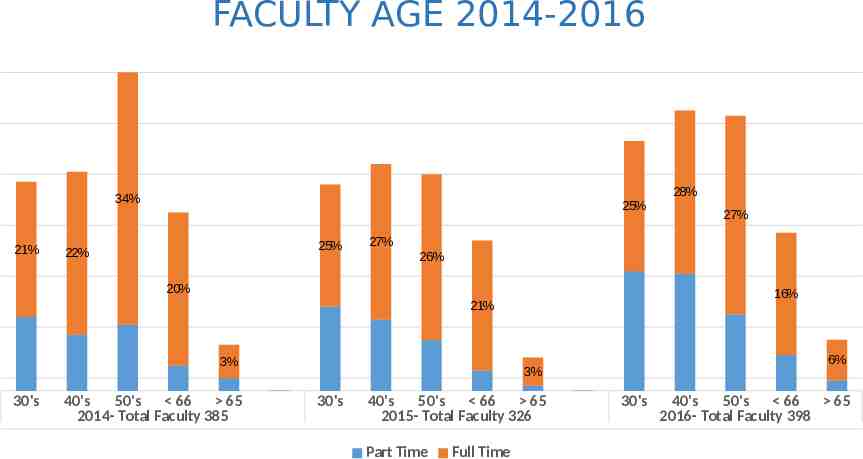
FACULTY AGE 2014-2016 34% 21% 25% 25% 22% 26% 16% 21% 3% 40's 50's 66 65 2014- Total Faculty 385 6% 3% 30's 27% 27% 20% 30's 28% 40's 50's 66 65 2015- Total Faculty 326 Part Time Full Time 30's 40's 50's 66 65 2016- Total Faculty 398
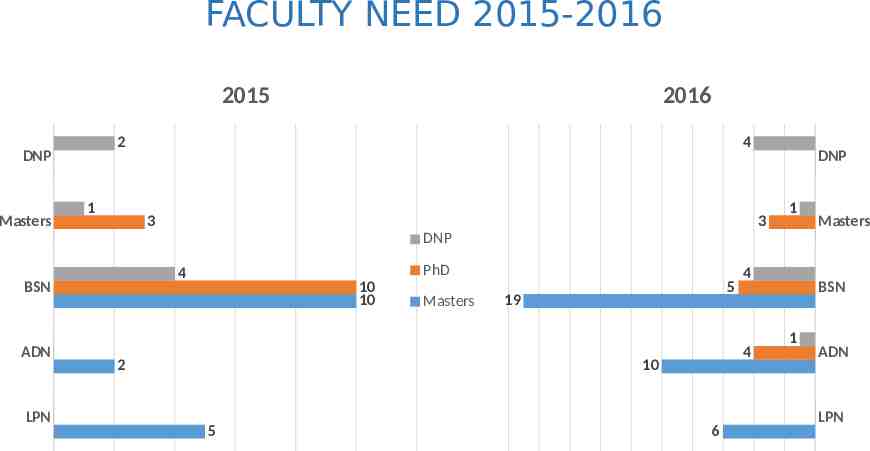
FACULTY NEED 2015-2016 2015 2 DNP Masters 2016 1 4 3 DNP 3 1 Masters DNP BSN ADN LPN PhD 4 10 10 2 Masters 5 19 4 10 5 4 6 BSN 1 ADN LPN
RECOMMENDATIONS Develop common goals for nursing workforce production at every level for the state, based on population needs. Continue monitoring: Diversity Faculty age/need 80% BSN by 2020 goal Development of self service data analysis
QUESTIONS? Ad Hoc analysis of any of the data is available. Raw data is available on any or all questions. Contact Information Clark Ruttinger MPA, MBAc Senior Institutional Research Analyst Utah Medical Education Council Utah Nursing Workforce Information Center [email protected] 801-526-4564