Investments: Analysis and Behavior Chapter 15- Bond Valuation
25 Slides720.50 KB
Investments: Analysis and Behavior Chapter 15- Bond Valuation 2008 McGraw-Hill/Irwin
Learning Objectives Calculate the value of a bond Compute the yield offered by various bonds Measure the interest rate risk of bonds using duration and convexity Learn the characteristics of convertible bonds Implement bond investment strategy 15-2
Characteristics of Bonds Bonds: debt securities that pay a rate of interest based upon the face amount or par value of the bond. Price changes as market interest changes Interest payments are commonly semiannual Bond investors receive full face amount when bonds mature Zero coupon bonds – no periodic payment (no interest reinvestment rate) Originally sold at a discount 15-3
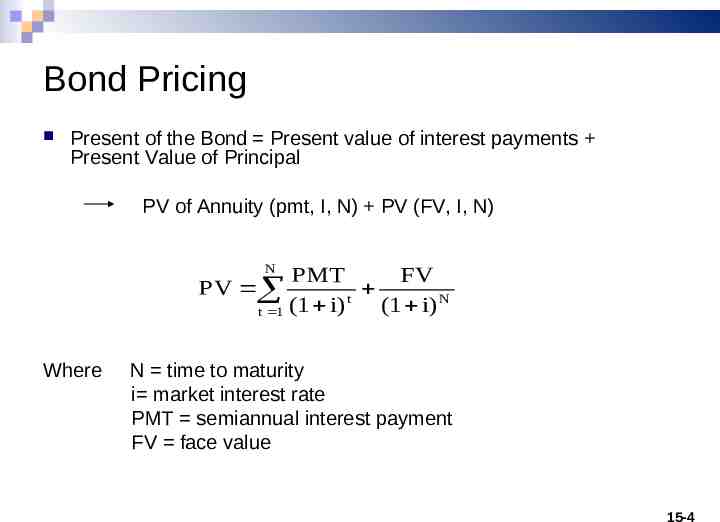
Bond Pricing Present of the Bond Present value of interest payments Present Value of Principal PV of Annuity (pmt, I, N) PV (FV, I, N) N PMT FV t N (1 i) (1 i) t 1 PV Where N time to maturity i market interest rate PMT semiannual interest payment FV face value 15-4
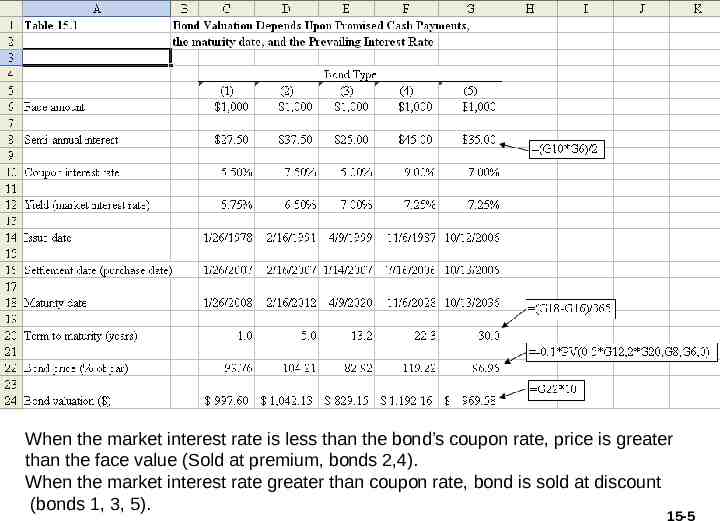
When the market interest rate is less than the bond’s coupon rate, price is greater than the face value (Sold at premium, bonds 2,4). When the market interest rate greater than coupon rate, bond is sold at discount (bonds 1, 3, 5). 15-5
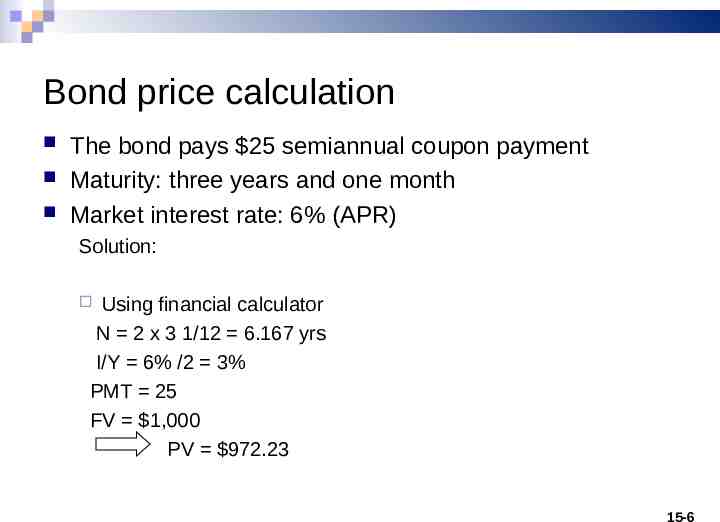
Bond price calculation The bond pays 25 semiannual coupon payment Maturity: three years and one month Market interest rate: 6% (APR) Solution: Using financial calculator N 2 x 3 1/12 6.167 yrs I/Y 6% /2 3% PMT 25 FV 1,000 PV 972.23 15-6
Callable Bonds Call provision allows the issuer to repay the investors’ principal early. Issuers call the bond when they want to refinance their debt at the lower interest rate Call price is commonly the face value plus one year of interest payments. Call protection: amount of the time before the bond becomes callable. 15-7
Expected yield Calculation Yield to maturity (or yield to call): expected total rate of return if investor were to buy and hold the bond until maturity or until call date. Internal rate of return of the bond that equates the present value of the cash flow with the price of the bond. Solve for I in Bond price PV of Annuity (pmt, I, N) PV (FV , I, N) 15-8
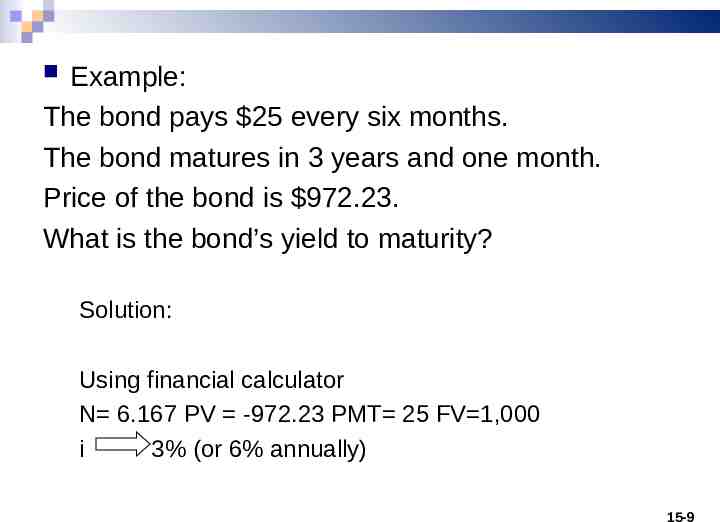
Example: The bond pays 25 every six months. The bond matures in 3 years and one month. Price of the bond is 972.23. What is the bond’s yield to maturity? Solution: Using financial calculator N 6.167 PV -972.23 PMT 25 FV 1,000 i 3% (or 6% annually) 15-9
Interest rate risk Bond prices are sensitive to the market interest rate If interest rates rise, the market value of bonds fall in order to compete with newly issued bonds with higher coupon rates. Sensitivity to the interest rate chance become more severe for longer term bonds Percentage rise in price is not symmetric with percentage decline. 15-10
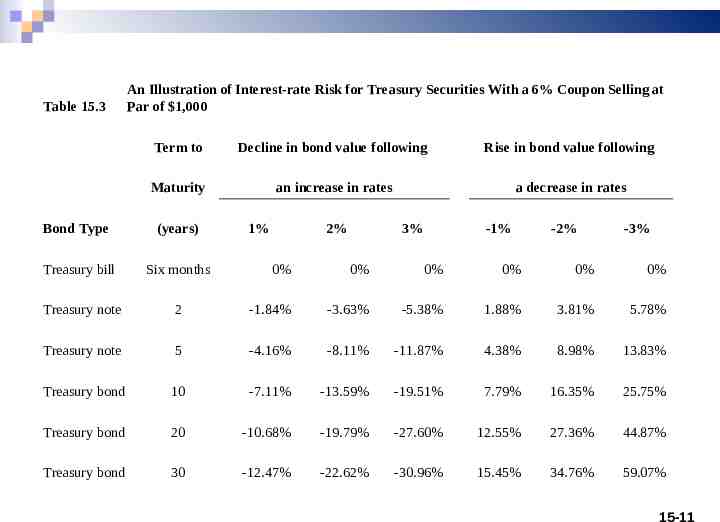
Table 15.3 An Illustration of Interest-rate Risk for Treasury Securities With a 6% Coupon Selling at Par of 1,000 Term to Decline in bond value following Rise in bond value following Maturity an increase in rates a decrease in rates Bond Type (years) Treasury bill Six months Treasury note 1% 2% 3% -1% -2% -3% 0% 0% 0% 0% 0% 0% 2 -1.84% -3.63% -5.38% 1.88% 3.81% 5.78% Treasury note 5 -4.16% -8.11% -11.87% 4.38% 8.98% 13.83% Treasury bond 10 -7.11% -13.59% -19.51% 7.79% 16.35% 25.75% Treasury bond 20 -10.68% -19.79% -27.60% 12.55% 27.36% 44.87% Treasury bond 30 -12.47% -22.62% -30.96% 15.45% 34.76% 59.07% 15-11
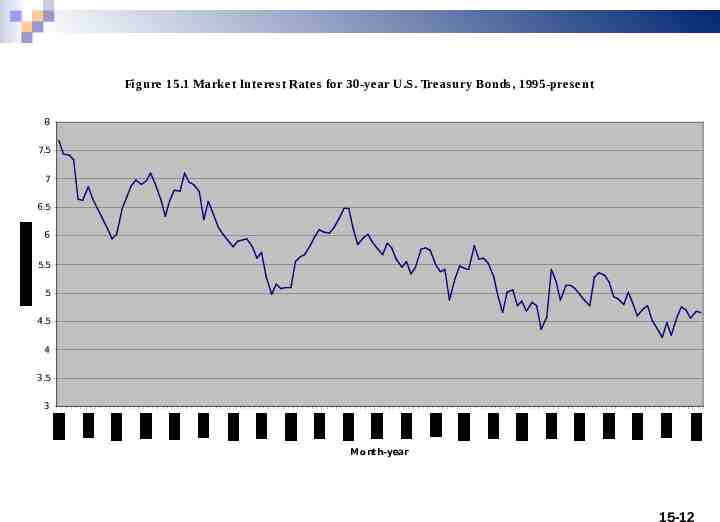
Figure 15.1 Marke t Interest Rates for 30-year U.S. Treasury Bonds, 1995-present 8 7.5 7 6.5 6 5.5 5 4.5 4 3.5 3 M onth-year 15-12
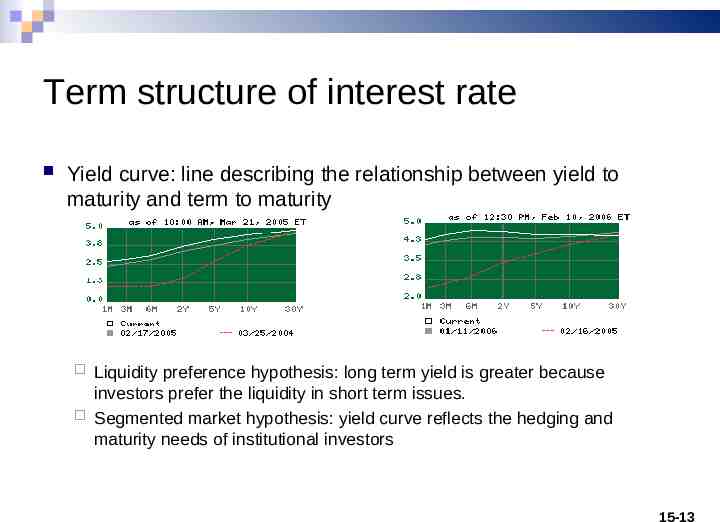
Term structure of interest rate Yield curve: line describing the relationship between yield to maturity and term to maturity Liquidity preference hypothesis: long term yield is greater because investors prefer the liquidity in short term issues. Segmented market hypothesis: yield curve reflects the hedging and maturity needs of institutional investors 15-13
Duration Term to maturity is an imperfect measure of bond risk because it ignores the valuation effects of differences in coupon rate and principal payment schedule Duration: an estimate of economic life of a bond measured by the weighted average time to receipt of cash flows The shorter the duration, the less sensitive is a bond’s price to fluctuations 15-14
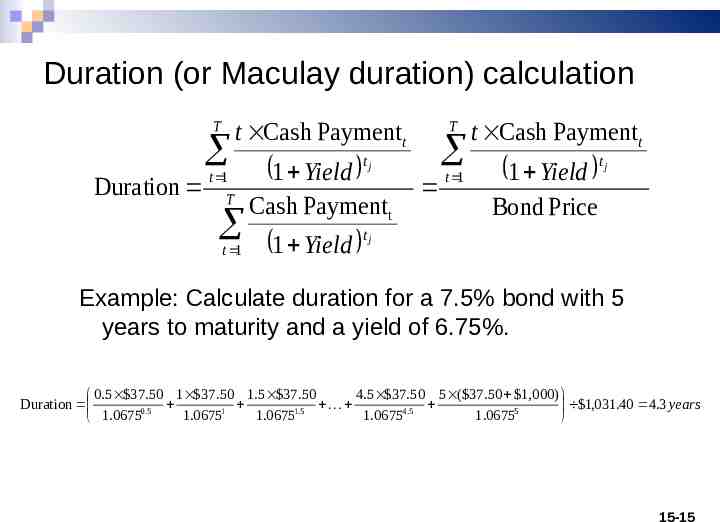
Duration (or Maculay duration) calculation t Cash Paymentt T 1 Yield Duration Cash Payment 1 Yield t 1 tj T t 1 T t Cash Paymentt 1 Yield t 1 t tj Bond Price tj Example: Calculate duration for a 7.5% bond with 5 years to maturity and a yield of 6.75%. 4.5 37.50 5 ( 37.50 1,000) 0.5 37.50 1 37.50 1.5 37.50 Duration 1,031.40 4.3 years 0.5 1.06751 1.06751.5 1.06754.5 1.06755 1.0675 15-15
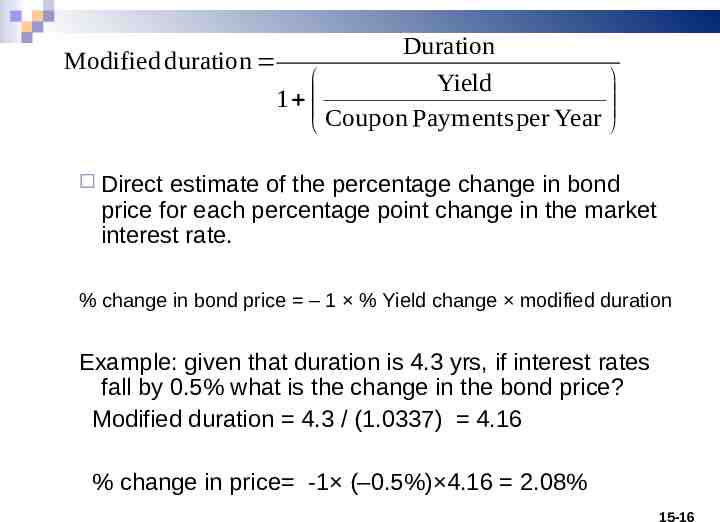
Duration Modified duration Yield 1 Coupon Payments per Year Direct estimate of the percentage change in bond price for each percentage point change in the market interest rate. % change in bond price – 1 % Yield change modified duration Example: given that duration is 4.3 yrs, if interest rates fall by 0.5% what is the change in the bond price? Modified duration 4.3 / (1.0337) 4.16 % change in price -1 (–0.5%) 4.16 2.08% 15-16
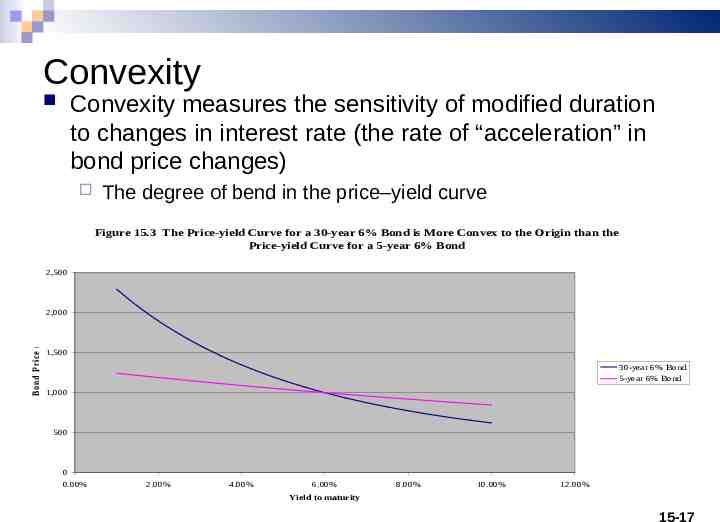
Convexity Convexity measures the sensitivity of modified duration to changes in interest rate (the rate of “acceleration” in bond price changes) The degree of bend in the price–yield curve Figure 15.3 The Price-yield Curve for a 30-year 6% Bond is More Convex to the Origin than the Price-yield Curve for a 5-year 6% Bond 2,500 B on d P rice ( ) 2,000 1,500 30-year 6% Bond 5-year 6% Bond 1,000 500 0 0.00% 2.00% 4.00% 6.00% 8.00% 10.00% 12.00% Yield to maturity 15-17
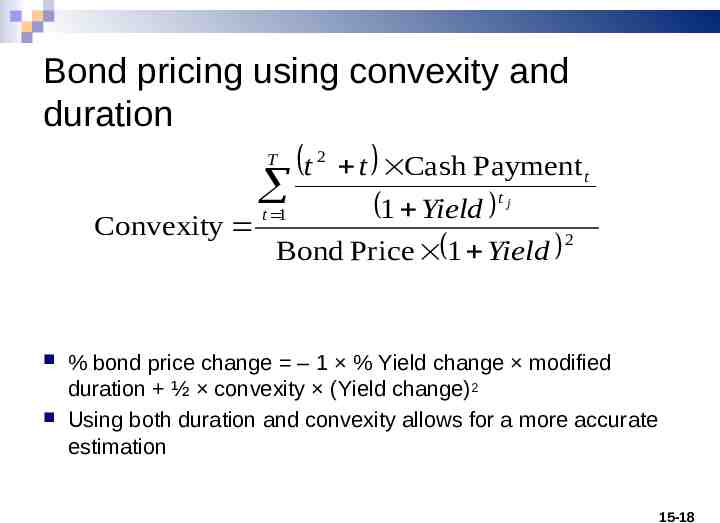
Bond pricing using convexity and duration T Convexity t 2 t Cash Payment t tj 1 Yield 2 Bond Price 1 Yield t 1 % bond price change – 1 % Yield change modified duration ½ convexity (Yield change)2 Using both duration and convexity allows for a more accurate estimation 15-18
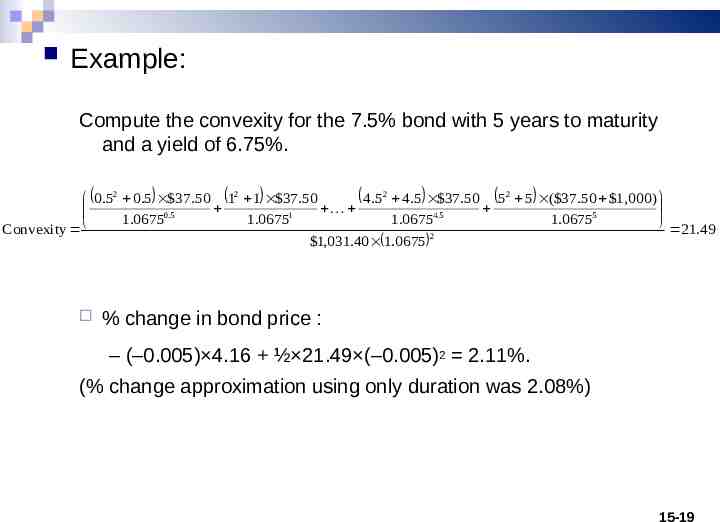
Example: Compute the convexity for the 7.5% bond with 5 years to maturity and a yield of 6.75%. 0.52 0.5 37.50 12 1 37.50 4.52 4.5 37.50 52 5 ( 37.50 1,000) 0.5 1 4.5 5 1.0675 1.0675 1.0675 1.0675 21.49 Convexity 2 1,031.40 1.0675 % change in bond price : – (–0.005) 4.16 ½ 21.49 (–0.005)2 2.11%. (% change approximation using only duration was 2.08%) 15-19
Convertible bonds A special type of bond that can be exchanged into some more junior grade of securities (usually into common stock) Conversion value # of equivalent common shares multiplied by the current share price Premium to conversion % over conversion value at which the convertible trades Break even time # of years needed to recover the conversion premium with the convertible’s higher income 15-20
Example: A common stock pays a 35 dividend and has a price of 55/share. The company also has 6% convertible bond selling at 118% of the par value, convertible into common at 50/share. What is the conversion ratio, conversion value, and premium to convert? Solution: The conversion ratio is 1,000/ 50 20:1. The conversion value is 20 55 1,100. The premium to convert is 1,180 - 1,100 80. Interest from convertible bond: 60 Dividend from stocks when converted: 7 Therefore, holding convertible yields higher income. 15-21
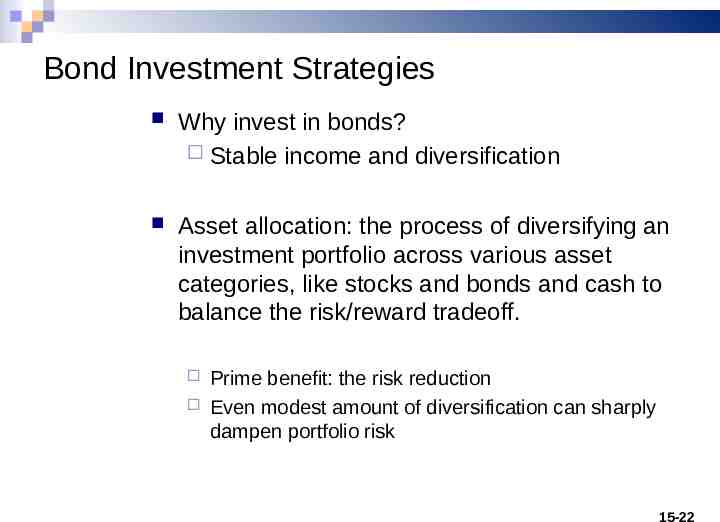
Bond Investment Strategies Why invest in bonds? Stable income and diversification Asset allocation: the process of diversifying an investment portfolio across various asset categories, like stocks and bonds and cash to balance the risk/reward tradeoff. Prime benefit: the risk reduction Even modest amount of diversification can sharply dampen portfolio risk 15-22
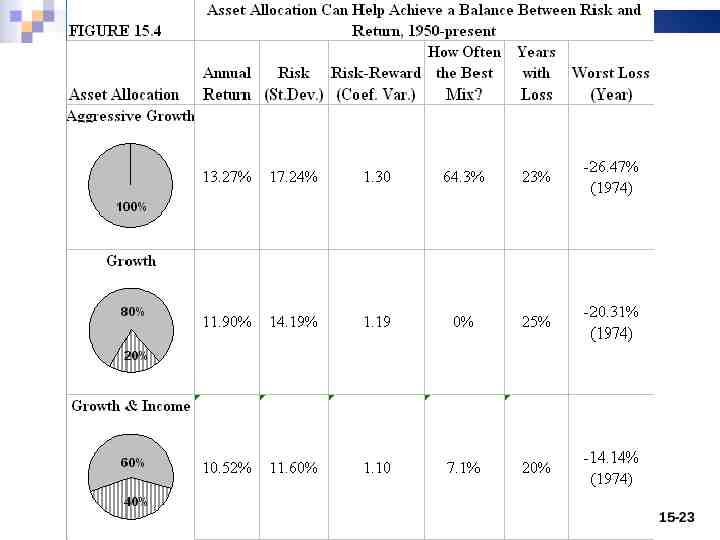
15-23
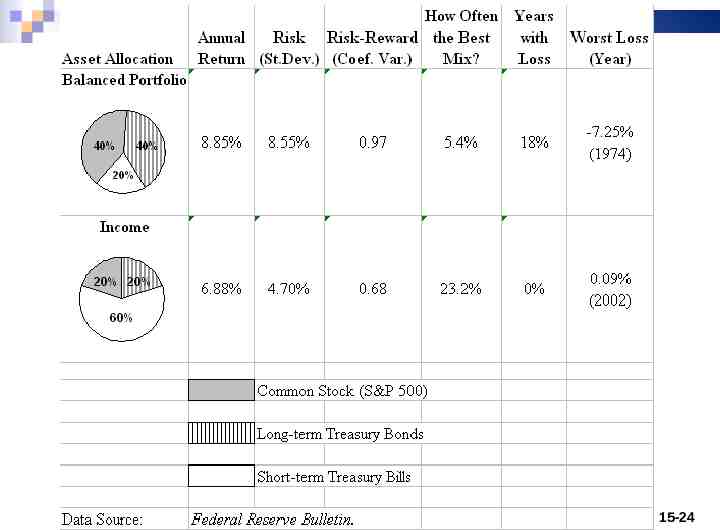
15-24
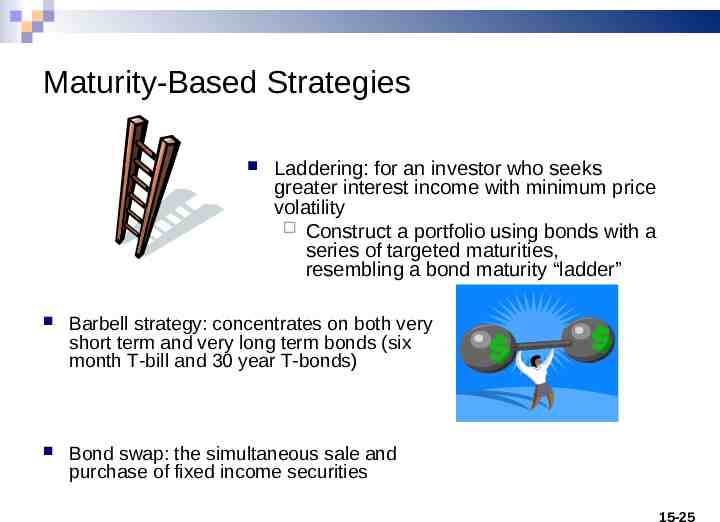
Maturity-Based Strategies Laddering: for an investor who seeks greater interest income with minimum price volatility Construct a portfolio using bonds with a series of targeted maturities, resembling a bond maturity “ladder” Barbell strategy: concentrates on both very short term and very long term bonds (six month T-bill and 30 year T-bonds) Bond swap: the simultaneous sale and purchase of fixed income securities 15-25