IME692: ADVANCED STATISTICAL METHODS FOR BUSINESS ANALYTICS (Part 07)

49 Slides1.58 MB
IME692: ADVANCED STATISTICAL METHODS FOR BUSINESS ANALYTICS (Part 07) Raghu Nandan Sengupta Department of Management Studies (DoMS) Indian Institute of Technology Kanpur, INDIA IME602: Advanced Statistical Methods for Business Analytics (Part # 07) RNSengupta,DoMS.,IIT Kanpur,INDIA 1
Canonical Correlation Coefficient Hotelling (1935, 1936) may be credited for developing the technique of Canonical Correlation Analysis (CCA), where the author studied how arithmetic speed and arithmetic power are related to reading speed and reading power IME602: Advanced Statistical Methods for Business Analytics (Part # 07) RNSengupta,DoMS.,IIT Kanpur,INDIA 2
Canonical Correlation Coefficient (contd.) IME602: Advanced Statistical Methods for Business Analytics (Part # 07) RNSengupta,DoMS.,IIT Kanpur,INDIA 3
Canonical Correlation Coefficient (contd.) IME602: Advanced Statistical Methods for Business Analytics (Part # 07) RNSengupta,DoMS.,IIT Kanpur,INDIA 4
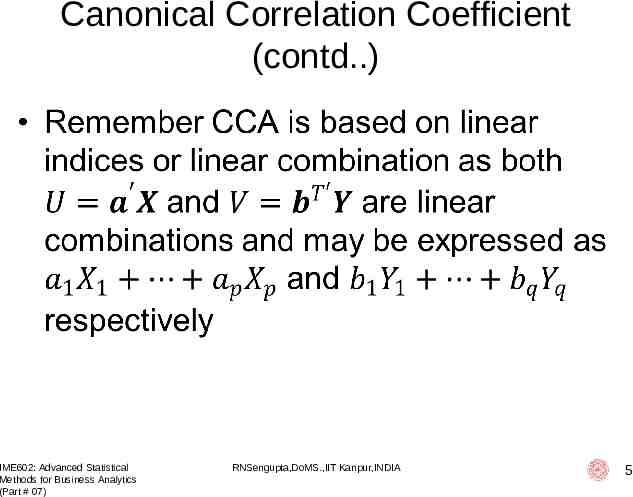
Canonical Correlation Coefficient (contd.) IME602: Advanced Statistical Methods for Business Analytics (Part # 07) RNSengupta,DoMS.,IIT Kanpur,INDIA 5
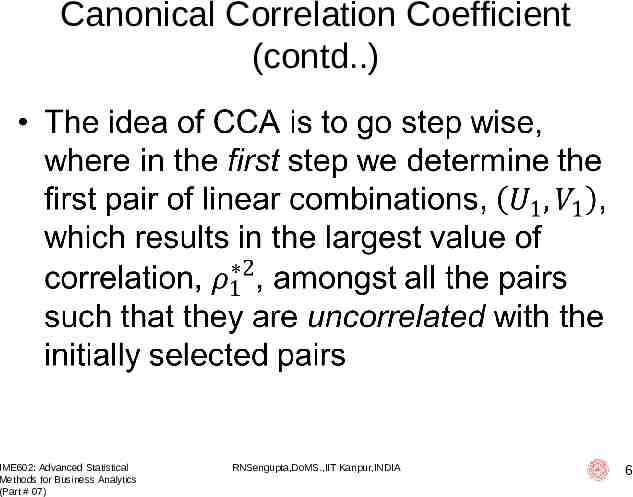
Canonical Correlation Coefficient (contd.) IME602: Advanced Statistical Methods for Business Analytics (Part # 07) RNSengupta,DoMS.,IIT Kanpur,INDIA 6
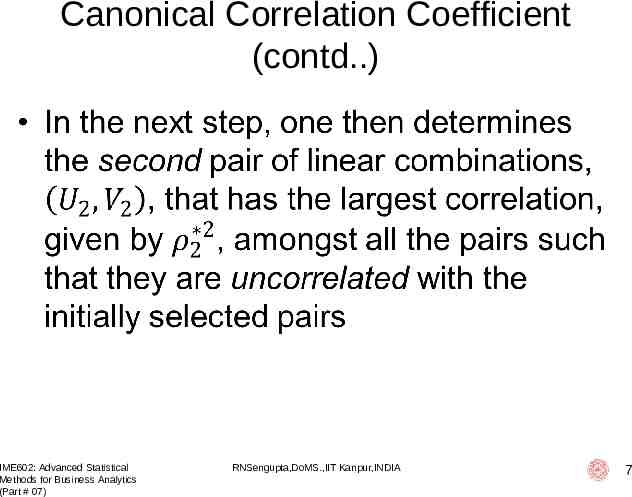
Canonical Correlation Coefficient (contd.) IME602: Advanced Statistical Methods for Business Analytics (Part # 07) RNSengupta,DoMS.,IIT Kanpur,INDIA 7
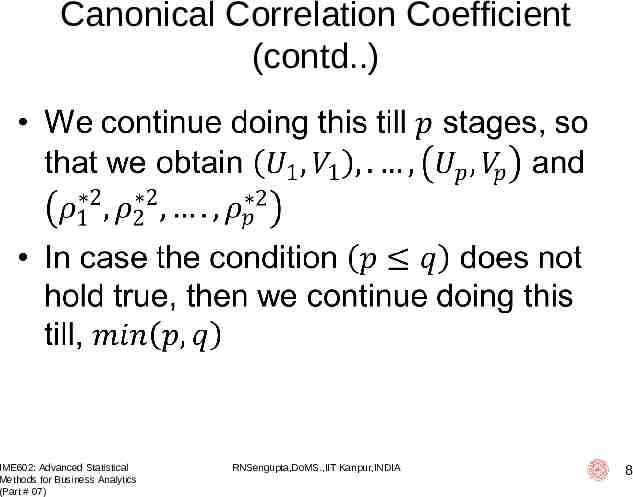
Canonical Correlation Coefficient (contd.) IME602: Advanced Statistical Methods for Business Analytics (Part # 07) RNSengupta,DoMS.,IIT Kanpur,INDIA 8
Canonical Correlation Coefficient (contd.) CCA is a simple and useful method to describe the correlation structure between two sets of variables It is a generalization of the concept of multiple correlation and successively maximizes the correlation between appropriate pairs of linear combinations of the variables of the two sets IME602: Advanced Statistical Methods for Business Analytics (Part # 07) RNSengupta,DoMS.,IIT Kanpur,INDIA 9
Canonical Correlation Coefficient (contd.) The method can be viewed as a dimension reduction technique in that it represents the correlation structure between two sets of variables in terms of a smaller number of canonical correlations IME602: Advanced Statistical Methods for Business Analytics (Part # 07) RNSengupta,DoMS.,IIT Kanpur,INDIA 10
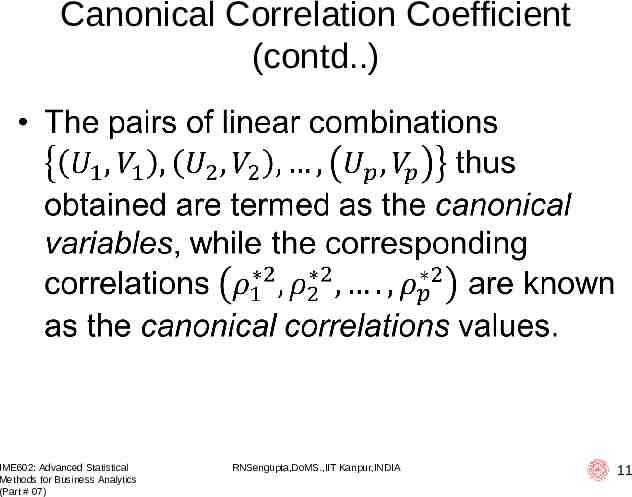
Canonical Correlation Coefficient (contd.) IME602: Advanced Statistical Methods for Business Analytics (Part # 07) RNSengupta,DoMS.,IIT Kanpur,INDIA 11
Discriminant Analysis: Motivation Example # 01: Consider a pediatrician has with her the data of height, age, sex, and age of children (in the age group of 2–5 years) from the past. Based on this information, a child is categorized as being obese, normal, or malnourished. When a new patient (in this case, a child) visits the pediatrician, then she, that is, the pediatrician, has to categorize the child as being in any one of the abovementioned three categories, such that she can suggest medical care for the child as deemed appropriate IME602: Advanced Statistical Methods for Business Analytics (Part # 07) RNSengupta,DoMS.,IIT Kanpur,INDIA 12
Discriminant Analysis: Motivation (contd .) Example # 02: A musicologist is studying the composition written by composers between 1750 and 1820 AD (which is termed as the classical period of Western music). The musicologist is aware that a classification of the composer in that period may be made depending on the melody, rhythm, dynamics, mood, timbre, etc. When the musicologist is given a new piece or an unknown piece, then, depending on the characteristics of the musical piece, he/she may classify the musical piece as that belonging to Joseph Hayden, Wolfgang Amadeus Mozart, Ludwing van Beethoven, etc IME602: Advanced Statistical Methods for Business Analytics (Part # 07) RNSengupta,DoMS.,IIT Kanpur,INDIA 13
Discriminant Analysis: Motivation (contd .) Example # 03: A geologist classifies rock as igneous, sedimentary, or metamorphic, depending on its chemical composition, physical properties, texture of its constituent particles, and permeability. Suppose the geologist is given a new sample of rock, and is told to classify the given sample, then he/she may do so as desired using MDCA IME602: Advanced Statistical Methods for Business Analytics (Part # 07) RNSengupta,DoMS.,IIT Kanpur,INDIA 14
Discriminant Analysis: Motivation (contd .) Example # 04: You as a credit risk analyst are first interested to discriminate a company as good, average, or bankrupt, depending on price to earning ratio, amount of liability, and price of stock. After having done that, you study the credentials of different new companies and classify them as belonging to any one of the categories as already decided IME602: Advanced Statistical Methods for Business Analytics (Part # 07) RNSengupta,DoMS.,IIT Kanpur,INDIA 15
Discriminant Analysis: Steps Step # 1 (Separation/discrimination rule): In this step/rule, describe an algebraic or graphical rule such that one is able to differentiate observations/objects into different classes, depending on different characteristics/features, which are inherent in the observations/objects Step # 2 (Allocation/classification rule): Once the first step is over, our next job is to sort out the new observations/objects into one of these classes depending on some logic/rule IME602: Advanced Statistical Methods for Business Analytics (Part # 07) RNSengupta,DoMS.,IIT Kanpur,INDIA 16
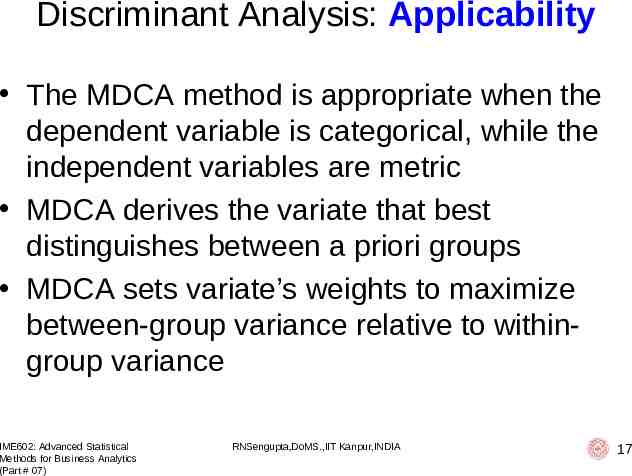
Discriminant Analysis: Applicability The MDCA method is appropriate when the dependent variable is categorical, while the independent variables are metric MDCA derives the variate that best distinguishes between a priori groups MDCA sets variate’s weights to maximize between-group variance relative to withingroup variance IME602: Advanced Statistical Methods for Business Analytics (Part # 07) RNSengupta,DoMS.,IIT Kanpur,INDIA 17
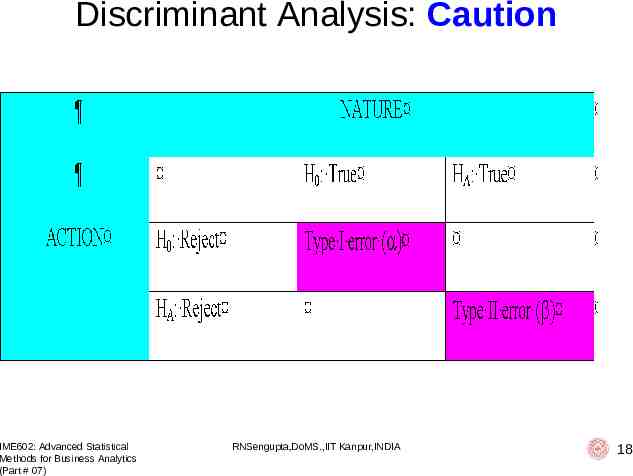
Discriminant Analysis: Caution IME602: Advanced Statistical Methods for Business Analytics (Part # 07) RNSengupta,DoMS.,IIT Kanpur,INDIA 18
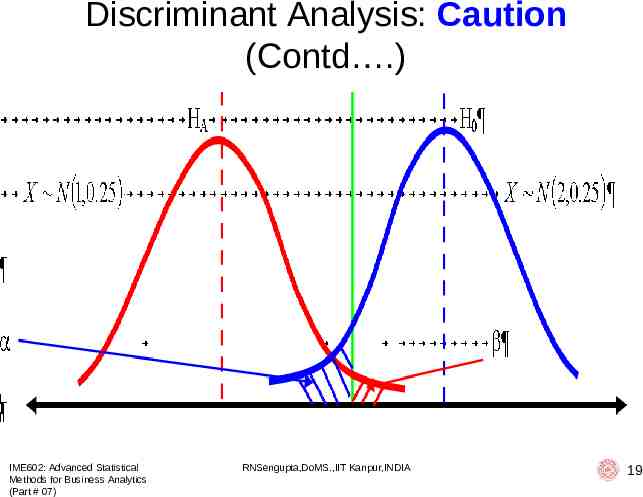
Discriminant Analysis: Caution (Contd .) IME602: Advanced Statistical Methods for Business Analytics (Part # 07) RNSengupta,DoMS.,IIT Kanpur,INDIA 19
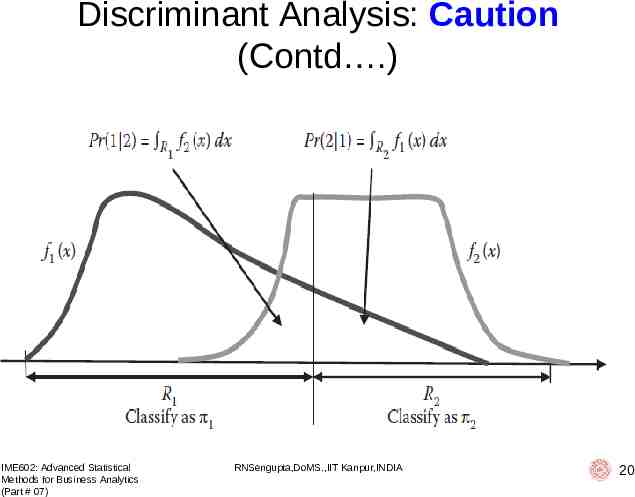
Discriminant Analysis: Caution (Contd .) IME602: Advanced Statistical Methods for Business Analytics (Part # 07) RNSengupta,DoMS.,IIT Kanpur,INDIA 20
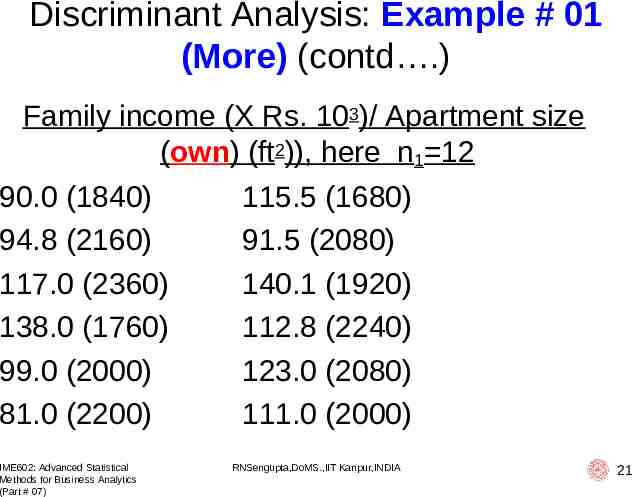
Discriminant Analysis: Example # 01 (More) (contd .) Family income (X Rs. 103)/ Apartment size (own) (ft2)), here n1 12 90.0 (1840) 94.8 (2160) 117.0 (2360) 138.0 (1760) 99.0 (2000) 81.0 (2200) IME602: Advanced Statistical Methods for Business Analytics (Part # 07) 115.5 (1680) 91.5 (2080) 140.1 (1920) 112.8 (2240) 123.0 (2080) 111.0 (2000) RNSengupta,DoMS.,IIT Kanpur,INDIA 21
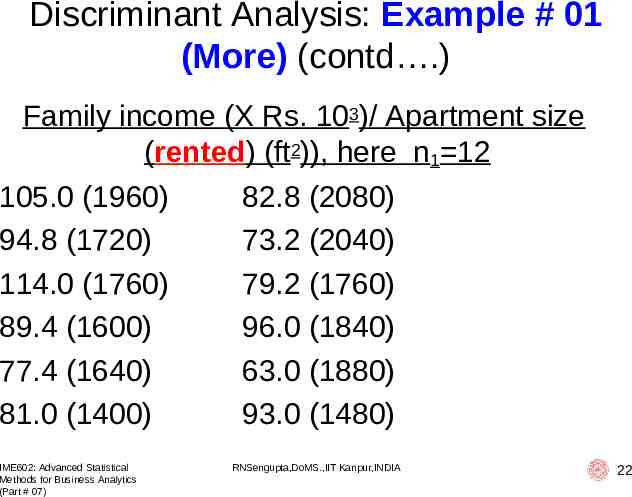
Discriminant Analysis: Example # 01 (More) (contd .) Family income (X Rs. 103)/ Apartment size (rented) (ft2)), here n1 12 105.0 (1960) 94.8 (1720) 114.0 (1760) 89.4 (1600) 77.4 (1640) 81.0 (1400) IME602: Advanced Statistical Methods for Business Analytics (Part # 07) 82.8 (2080) 73.2 (2040) 79.2 (1760) 96.0 (1840) 63.0 (1880) 93.0 (1480) RNSengupta,DoMS.,IIT Kanpur,INDIA 22
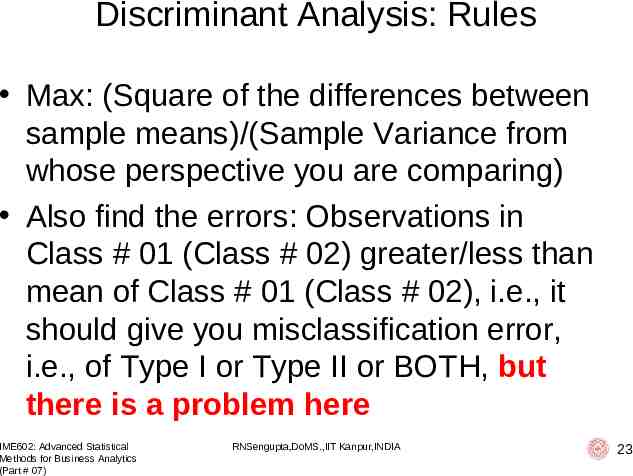
Discriminant Analysis: Rules Max: (Square of the differences between sample means)/(Sample Variance from whose perspective you are comparing) Also find the errors: Observations in Class # 01 (Class # 02) greater/less than mean of Class # 01 (Class # 02), i.e., it should give you misclassification error, i.e., of Type I or Type II or BOTH, but there is a problem here IME602: Advanced Statistical Methods for Business Analytics (Part # 07) RNSengupta,DoMS.,IIT Kanpur,INDIA 23
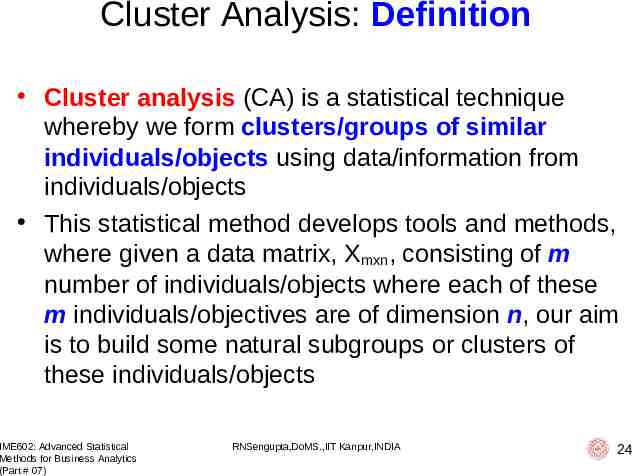
Cluster Analysis: Definition Cluster analysis (CA) is a statistical technique whereby we form clusters/groups of similar individuals/objects using data/information from individuals/objects This statistical method develops tools and methods, where given a data matrix, Xmxn, consisting of m number of individuals/objects where each of these m individuals/objectives are of dimension n, our aim is to build some natural subgroups or clusters of these individuals/objects IME602: Advanced Statistical Methods for Business Analytics (Part # 07) RNSengupta,DoMS.,IIT Kanpur,INDIA 24
Cluster Analysis: Background Using CA, we try to find some similarity or patterns in the data, for example, classification of plants/animals using taxonomy, diseases using epidemiology, etc From a historical perspective, the origin of CA may be traced back to the work of Driver and Kroeber (1932) in anthropology, and later on, it was used in psychology (Cattell, 1943, Tryon, 1939, Zubin, 1938) IME602: Advanced Statistical Methods for Business Analytics (Part # 07) RNSengupta,DoMS.,IIT Kanpur,INDIA 25
Cluster Analysis: Background (contd ) Cluster analysis has been used in a variety of fields ranging from anthropology, agriculture, economics, psychology, geophysics, psychiatry, sociology, marketing, finance, behavioral sciences, different fields of engineering, etc Good references with interesting applications can be found in Gordon (1981) and Hartigan (1975), Anderberg (1973), Duda et al. (2001), Duran and Odell (1974), Everitt and Dunn (2001), Gordon (1981), Hartigan (1975), Jain and Dubes (1988), Kaufman and Rousseeuw (2005), Späth (1980), Xu and Wunsch (2008) Some other mathematical technique methods similar to cluster analysis are pattern recognition, numerical taxonomy, morphometrics, etc IME602: Advanced Statistical Methods for Business Analytics (Part # 07) RNSengupta,DoMS.,IIT Kanpur,INDIA 26
Cluster Analysis: Idea CA is a set of tools for building groups (clusters) from multivariate data objects CA aims to construct groups with homogeneous properties out of heterogeneous large samples The groups or clusters should be as homogeneous as possible and the differences among the various groups as large as possible IME602: Advanced Statistical Methods for Business Analytics (Part # 07) RNSengupta,DoMS.,IIT Kanpur,INDIA 27
Cluster Analysis: Fundamental Steps Cluster analysis can be divided into two fundamental steps. Choice of a proximity measure: One checks each pair of observations (objects) for the similarity of their values. A similarity (proximity) measure is defined to measure the “closeness” of the objects. The “closer” they are, the more homogeneous they are Choice of group-building algorithm: On the basis of the proximity measures the objects assigned to groups so that differences between groups become large and observations in a group become as close as possible IME602: Advanced Statistical Methods for Business Analytics (Part # 07) RNSengupta,DoMS.,IIT Kanpur,INDIA 28
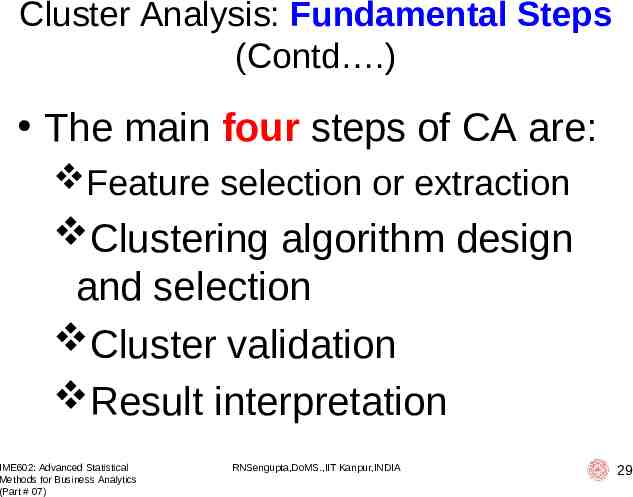
Cluster Analysis: Fundamental Steps (Contd .) The main four steps of CA are: Feature selection or extraction Clustering algorithm design and selection Cluster validation Result interpretation IME602: Advanced Statistical Methods for Business Analytics (Part # 07) RNSengupta,DoMS.,IIT Kanpur,INDIA 29
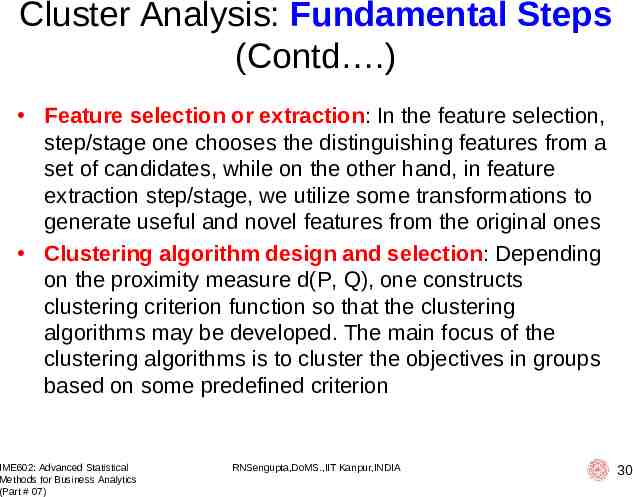
Cluster Analysis: Fundamental Steps (Contd .) Feature selection or extraction: In the feature selection, step/stage one chooses the distinguishing features from a set of candidates, while on the other hand, in feature extraction step/stage, we utilize some transformations to generate useful and novel features from the original ones Clustering algorithm design and selection: Depending on the proximity measure d(P, Q), one constructs clustering criterion function so that the clustering algorithms may be developed. The main focus of the clustering algorithms is to cluster the objectives in groups based on some predefined criterion IME602: Advanced Statistical Methods for Business Analytics (Part # 07) RNSengupta,DoMS.,IIT Kanpur,INDIA 30
Cluster Analysis: Fundamental Steps (Contd .) Cluster validation: Effective validation standards and criteria are important to provide the degree of confidence for the clustering results derived from the used algorithms. This is what is done in the third stage step, which is the clustering validation step/stage Result interpretation: The ultimate goal of clustering analysis step/stage is to provide the user with meaningful insights from the original data, so that they can effectively IME602: Advanced Statistical Methods for Business Analytics (Part # 07) RNSengupta,DoMS.,IIT Kanpur,INDIA 31
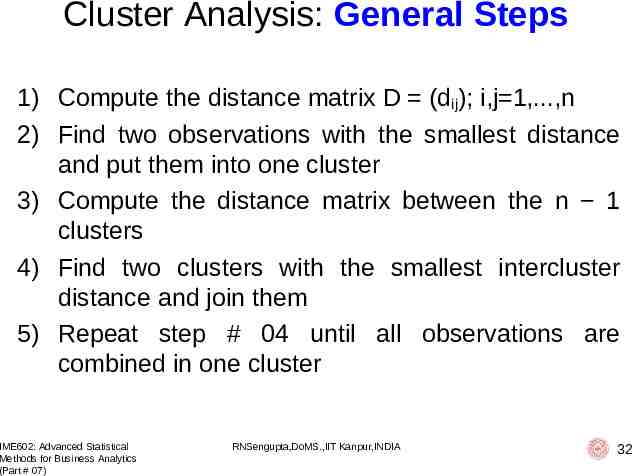
Cluster Analysis: General Steps 1) Compute the distance matrix D (dij); i,j 1,.,n 2) Find two observations with the smallest distance and put them into one cluster 3) Compute the distance matrix between the n 1 clusters 4) Find two clusters with the smallest intercluster distance and join them 5) Repeat step # 04 until all observations are combined in one cluster IME602: Advanced Statistical Methods for Business Analytics (Part # 07) RNSengupta,DoMS.,IIT Kanpur,INDIA 32
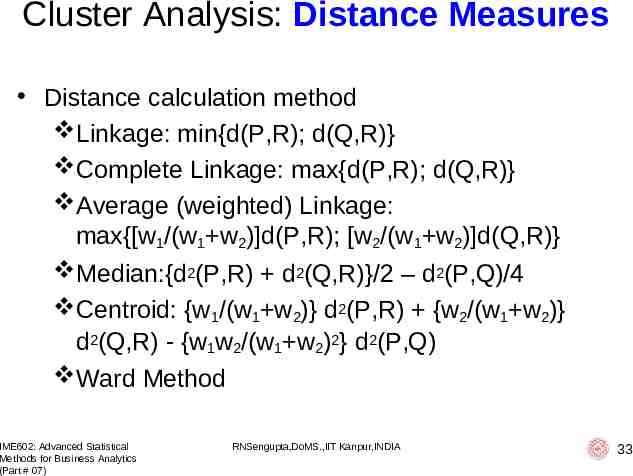
Cluster Analysis: Distance Measures Distance calculation method Linkage: min{d(P,R); d(Q,R)} Complete Linkage: max{d(P,R); d(Q,R)} Average (weighted) Linkage: max{[w1/(w1 w2)]d(P,R); [w2/(w1 w2)]d(Q,R)} Median:{d2(P,R) d2(Q,R)}/2 – d2(P,Q)/4 Centroid: {w1/(w1 w2)} d2(P,R) {w2/(w1 w2)} d2(Q,R) - {w1w2/(w1 w2)2} d2(P,Q) Ward Method IME602: Advanced Statistical Methods for Business Analytics (Part # 07) RNSengupta,DoMS.,IIT Kanpur,INDIA 33
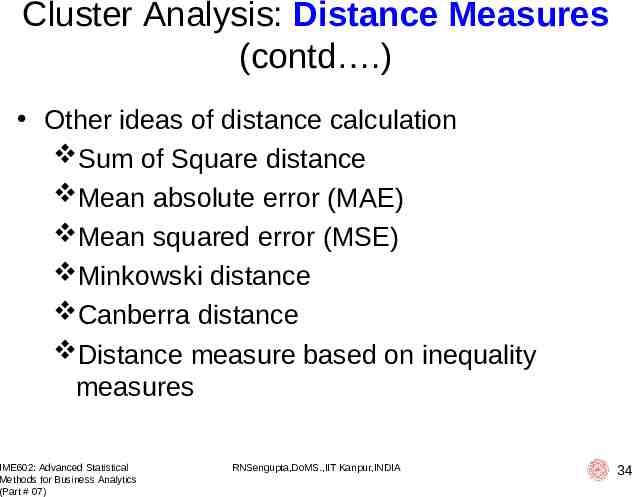
Cluster Analysis: Distance Measures (contd .) Other ideas of distance calculation Sum of Square distance Mean absolute error (MAE) Mean squared error (MSE) Minkowski distance Canberra distance Distance measure based on inequality measures IME602: Advanced Statistical Methods for Business Analytics (Part # 07) RNSengupta,DoMS.,IIT Kanpur,INDIA 34
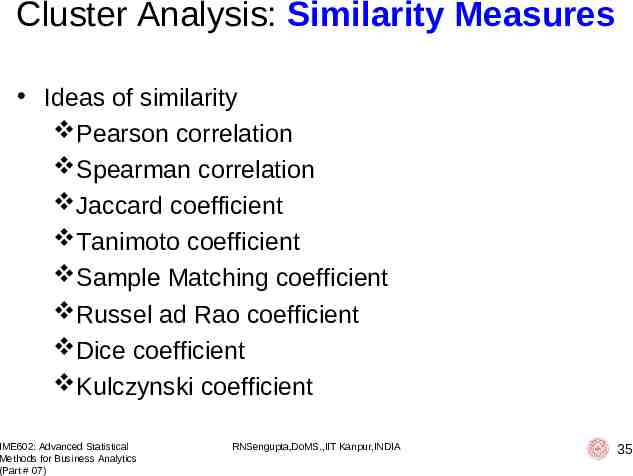
Cluster Analysis: Similarity Measures Ideas of similarity Pearson correlation Spearman correlation Jaccard coefficient Tanimoto coefficient Sample Matching coefficient Russel ad Rao coefficient Dice coefficient Kulczynski coefficient IME602: Advanced Statistical Methods for Business Analytics (Part # 07) RNSengupta,DoMS.,IIT Kanpur,INDIA 35
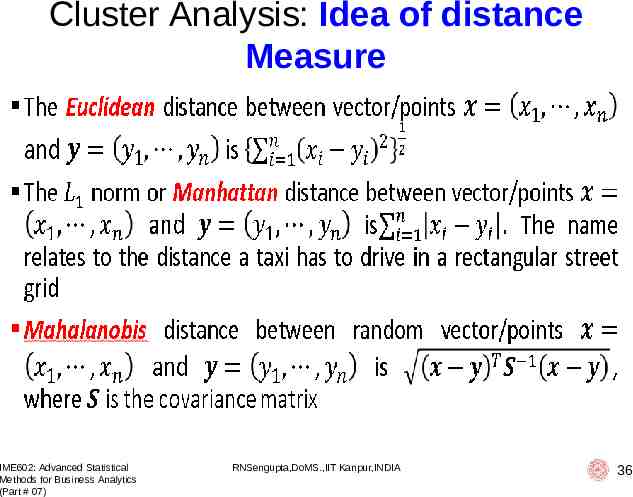
Cluster Analysis: Idea of distance Measure IME602: Advanced Statistical Methods for Business Analytics (Part # 07) RNSengupta,DoMS.,IIT Kanpur,INDIA 36
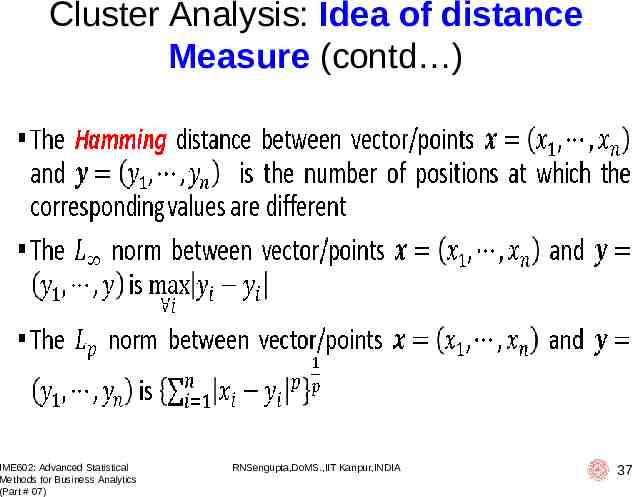
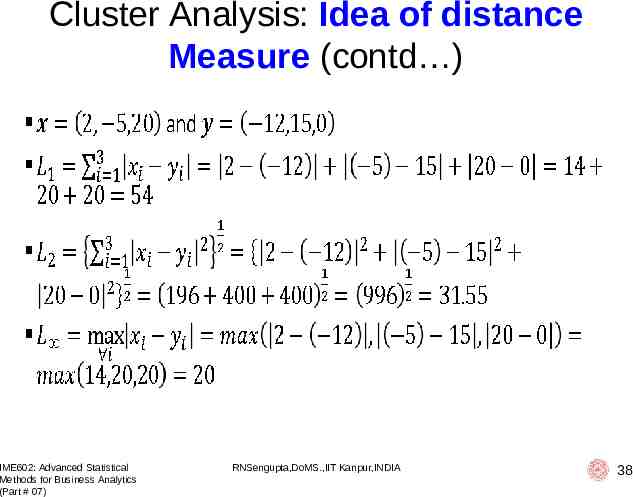
Cluster Analysis: Idea of distance Measure (contd ) IME602: Advanced Statistical Methods for Business Analytics (Part # 07) RNSengupta,DoMS.,IIT Kanpur,INDIA 37
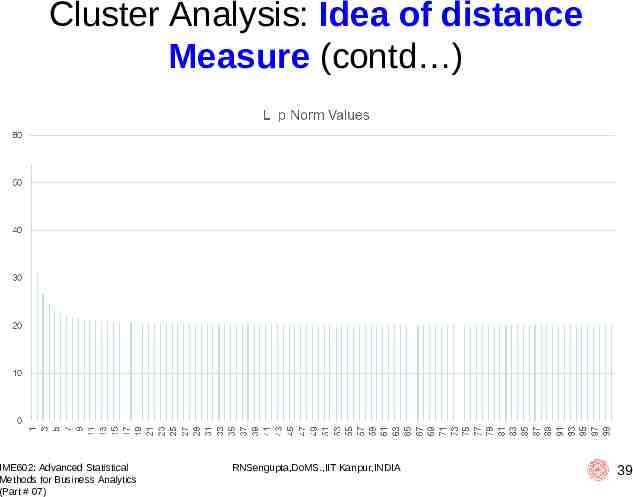
Cluster Analysis: Idea of distance Measure (contd ) IME602: Advanced Statistical Methods for Business Analytics (Part # 07) RNSengupta,DoMS.,IIT Kanpur,INDIA 38
Cluster Analysis: Idea of distance Measure (contd ) IME602: Advanced Statistical Methods for Business Analytics (Part # 07) RNSengupta,DoMS.,IIT Kanpur,INDIA 39
Cluster Analysis: Idea of distance Measure (contd ) IME602: Advanced Statistical Methods for Business Analytics (Part # 07) RNSengupta,DoMS.,IIT Kanpur,INDIA 40
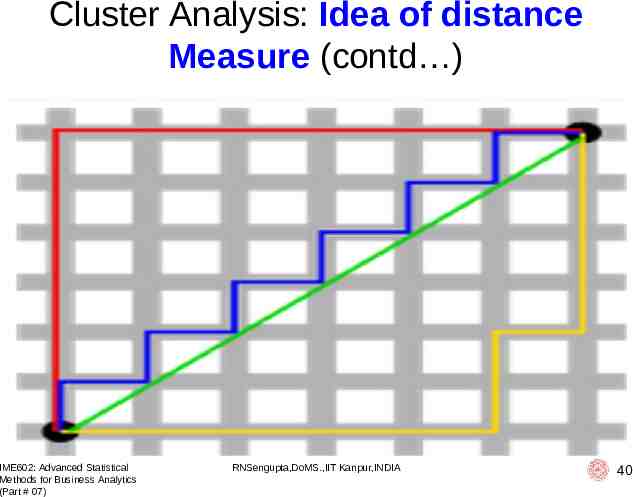
Cluster Analysis: Idea of distance Measure (contd ) The green line (L2-norm) is the unique shortest path, while the red, blue, yellow (L1norm) are all same length ( 12) for the same route This is why L2-norm has unique solution while L1-norm does not have any unique solution One can generalize this to n-dimension case IME602: Advanced Statistical Methods for Business Analytics (Part # 07) RNSengupta,DoMS.,IIT Kanpur,INDIA 41
Cluster Analysis: First Algorithm (Idea) Basic K-mean algorithm: The Kmean clustering algorithm works on the premise that centroids of a group of objects best depict the characteristics of that group/cluster IME602: Advanced Statistical Methods for Business Analytics (Part # 07) RNSengupta,DoMS.,IIT Kanpur,INDIA 42
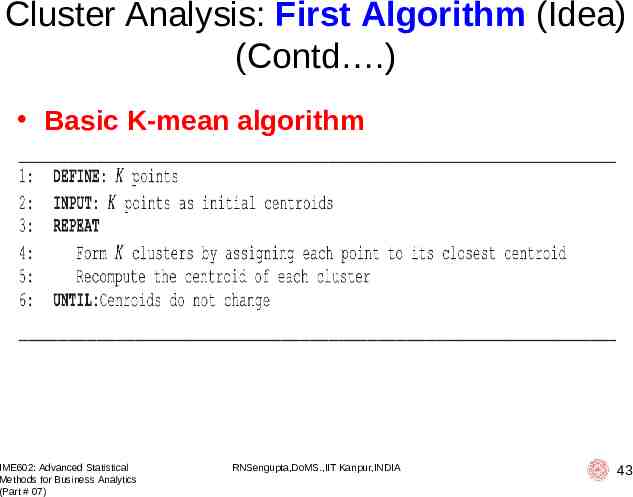
Cluster Analysis: First Algorithm (Idea) (Contd .) Basic K-mean algorithm IME602: Advanced Statistical Methods for Business Analytics (Part # 07) RNSengupta,DoMS.,IIT Kanpur,INDIA 43
Cluster Analysis: Second Algorithm (Idea) Bisecting K-mean algorithm: The bisecting Kmean algorithm is a simple extension of the basis K-mean algorithm. The idea is to obtain K clusters and split the set of points into two clusters and then select one of them to split it again. We continue doing this until K clusters are obtained IME602: Advanced Statistical Methods for Business Analytics (Part # 07) RNSengupta,DoMS.,IIT Kanpur,INDIA 44
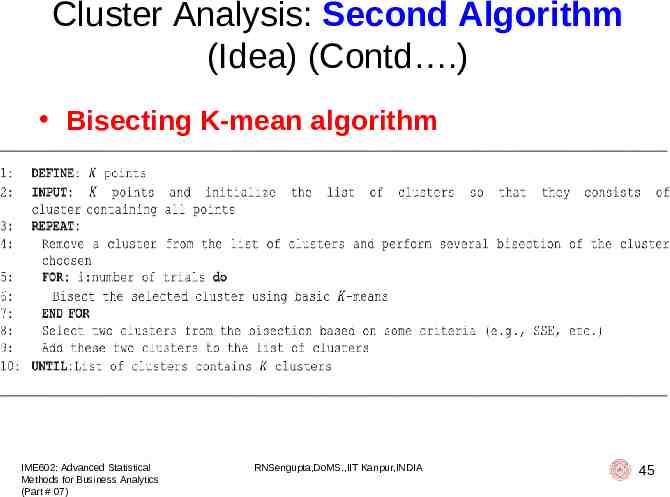
Cluster Analysis: Second Algorithm (Idea) (Contd .) Bisecting K-mean algorithm IME602: Advanced Statistical Methods for Business Analytics (Part # 07) RNSengupta,DoMS.,IIT Kanpur,INDIA 45
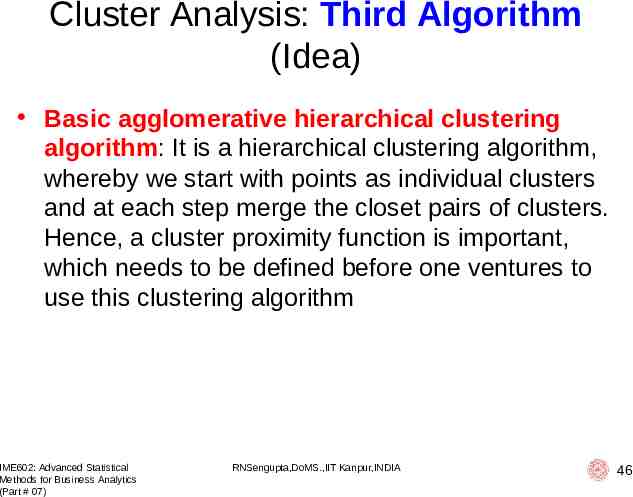
Cluster Analysis: Third Algorithm (Idea) Basic agglomerative hierarchical clustering algorithm: It is a hierarchical clustering algorithm, whereby we start with points as individual clusters and at each step merge the closet pairs of clusters. Hence, a cluster proximity function is important, which needs to be defined before one ventures to use this clustering algorithm IME602: Advanced Statistical Methods for Business Analytics (Part # 07) RNSengupta,DoMS.,IIT Kanpur,INDIA 46
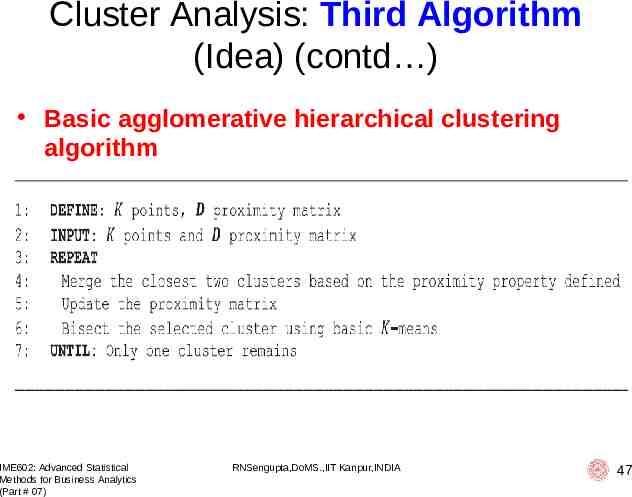
Cluster Analysis: Third Algorithm (Idea) (contd ) Basic agglomerative hierarchical clustering algorithm IME602: Advanced Statistical Methods for Business Analytics (Part # 07) RNSengupta,DoMS.,IIT Kanpur,INDIA 47
Cluster Analysis: Dendogram Representing a tree and is frequently used in different contexts: (i) hierarchical clustering; (ii) computational biology; (iii) phylogenetics Derives from the two ancient Greek words (déndron), meaning "tree", and (grámma), meaning "drawing, mathematical figure" IME602: Advanced Statistical Methods for Business Analytics (Part # 07) RNSengupta,DoMS.,IIT Kanpur,INDIA 48
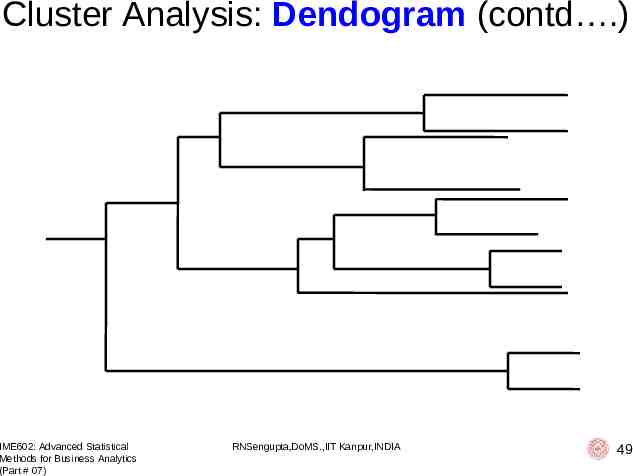
Cluster Analysis: Dendogram (contd .) IME602: Advanced Statistical Methods for Business Analytics (Part # 07) RNSengupta,DoMS.,IIT Kanpur,INDIA 49