Global Classroom Lecture Poverty Alleviation and Economic Growth in
36 Slides742.50 KB
Global Classroom Lecture Poverty Alleviation and Economic Growth in China By Geng XIAO [email protected] [email protected]
China’s Legacy and Reform Strategy 2
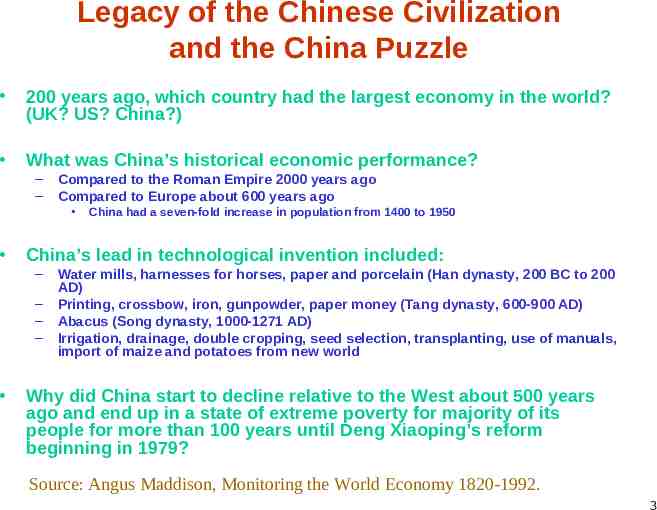
Legacy of the Chinese Civilization and the China Puzzle 200 years ago, which country had the largest economy in the world? (UK? US? China?) What was China’s historical economic performance? – – Compared to the Roman Empire 2000 years ago Compared to Europe about 600 years ago China’s lead in technological invention included: – – – – China had a seven-fold increase in population from 1400 to 1950 Water mills, harnesses for horses, paper and porcelain (Han dynasty, 200 BC to 200 AD) Printing, crossbow, iron, gunpowder, paper money (Tang dynasty, 600-900 AD) Abacus (Song dynasty, 1000-1271 AD) Irrigation, drainage, double cropping, seed selection, transplanting, use of manuals, import of maize and potatoes from new world Why did China start to decline relative to the West about 500 years ago and end up in a state of extreme poverty for majority of its people for more than 100 years until Deng Xiaoping’s reform beginning in 1979? Source: Angus Maddison, Monitoring the World Economy 1820-1992. 3
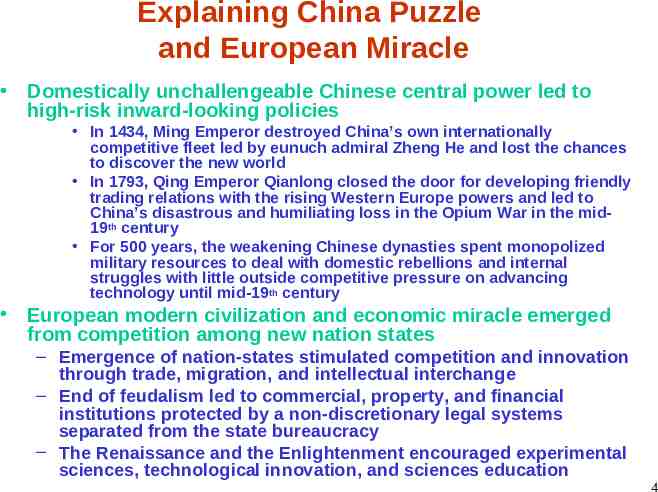
Explaining China Puzzle and European Miracle Domestically unchallengeable Chinese central power led to high-risk inward-looking policies In 1434, Ming Emperor destroyed China’s own internationally competitive fleet led by eunuch admiral Zheng He and lost the chances to discover the new world In 1793, Qing Emperor Qianlong closed the door for developing friendly trading relations with the rising Western Europe powers and led to China’s disastrous and humiliating loss in the Opium War in the mid19th century For 500 years, the weakening Chinese dynasties spent monopolized military resources to deal with domestic rebellions and internal struggles with little outside competitive pressure on advancing technology until mid-19th century European modern civilization and economic miracle emerged from competition among new nation states – Emergence of nation-states stimulated competition and innovation through trade, migration, and intellectual interchange – End of feudalism led to commercial, property, and financial institutions protected by a non-discretionary legal systems separated from the state bureaucracy – The Renaissance and the Enlightenment encouraged experimental sciences, technological innovation, and sciences education 4
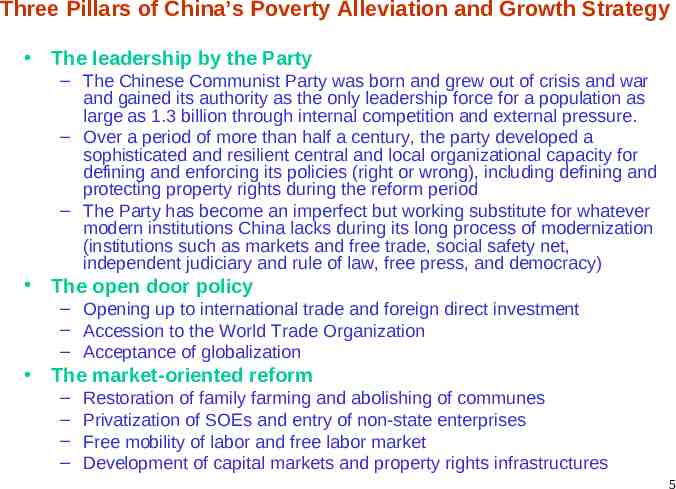
Three Pillars of China’s Poverty Alleviation and Growth Strategy The leadership by the Party – The Chinese Communist Party was born and grew out of crisis and war and gained its authority as the only leadership force for a population as large as 1.3 billion through internal competition and external pressure. – Over a period of more than half a century, the party developed a sophisticated and resilient central and local organizational capacity for defining and enforcing its policies (right or wrong), including defining and protecting property rights during the reform period – The Party has become an imperfect but working substitute for whatever modern institutions China lacks during its long process of modernization (institutions such as markets and free trade, social safety net, independent judiciary and rule of law, free press, and democracy) The open door policy – Opening up to international trade and foreign direct investment – Accession to the World Trade Organization – Acceptance of globalization The market-oriented reform – – – – Restoration of family farming and abolishing of communes Privatization of SOEs and entry of non-state enterprises Free mobility of labor and free labor market Development of capital markets and property rights infrastructures 5
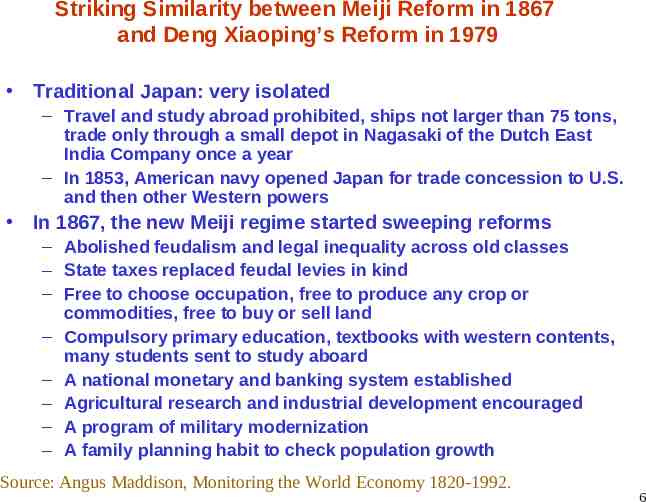
Striking Similarity between Meiji Reform in 1867 and Deng Xiaoping’s Reform in 1979 Traditional Japan: very isolated – Travel and study abroad prohibited, ships not larger than 75 tons, trade only through a small depot in Nagasaki of the Dutch East India Company once a year – In 1853, American navy opened Japan for trade concession to U.S. and then other Western powers In 1867, the new Meiji regime started sweeping reforms – Abolished feudalism and legal inequality across old classes – State taxes replaced feudal levies in kind – Free to choose occupation, free to produce any crop or commodities, free to buy or sell land – Compulsory primary education, textbooks with western contents, many students sent to study aboard – A national monetary and banking system established – Agricultural research and industrial development encouraged – A program of military modernization – A family planning habit to check population growth Source: Angus Maddison, Monitoring the World Economy 1820-1992. 6
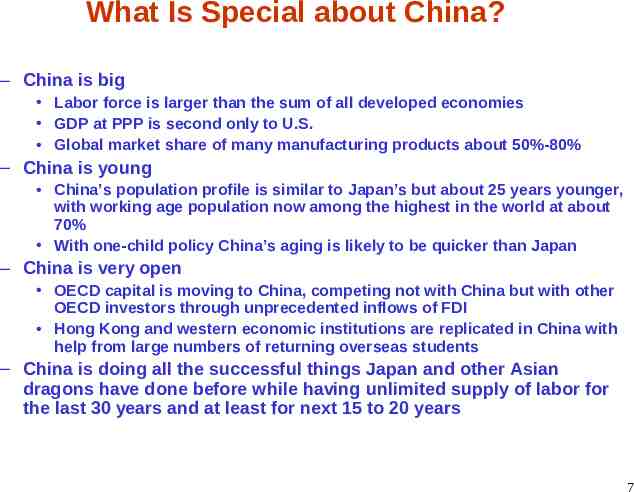
What Is Special about China? – China is big Labor force is larger than the sum of all developed economies GDP at PPP is second only to U.S. Global market share of many manufacturing products about 50%-80% – China is young China’s population profile is similar to Japan’s but about 25 years younger, with working age population now among the highest in the world at about 70% With one-child policy China’s aging is likely to be quicker than Japan – China is very open OECD capital is moving to China, competing not with China but with other OECD investors through unprecedented inflows of FDI Hong Kong and western economic institutions are replicated in China with help from large numbers of returning overseas students – China is doing all the successful things Japan and other Asian dragons have done before while having unlimited supply of labor for the last 30 years and at least for next 15 to 20 years 7
China’s Achievements in Poverty Alleviation and Growth 8
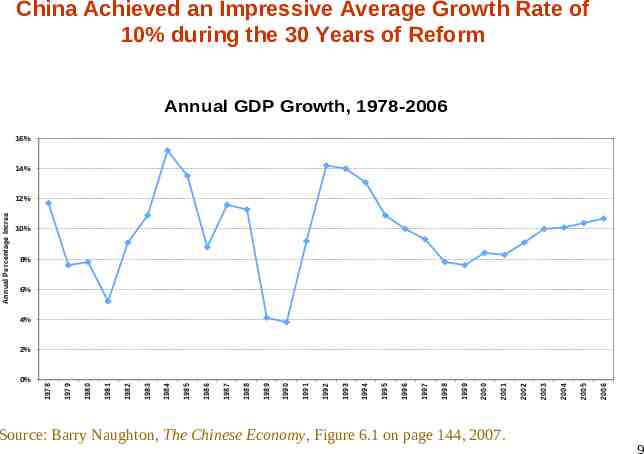
China Achieved an Impressive Average Growth Rate of 10% during the 30 Years of Reform Annual GDP Growth, 1978-2006 16% 14% Annual Percentage Increase 12% 10% 8% 6% 4% Source: Barry Naughton, The Chinese Economy, Figure 6.1 on page 144, 2007. 2006 2005 2004 2003 2002 2001 2000 1999 1998 1997 1996 1995 1994 1993 1992 1991 1990 1989 1988 1987 1986 1985 1984 1983 1982 1981 1980 1979 0% 1978 2% 9
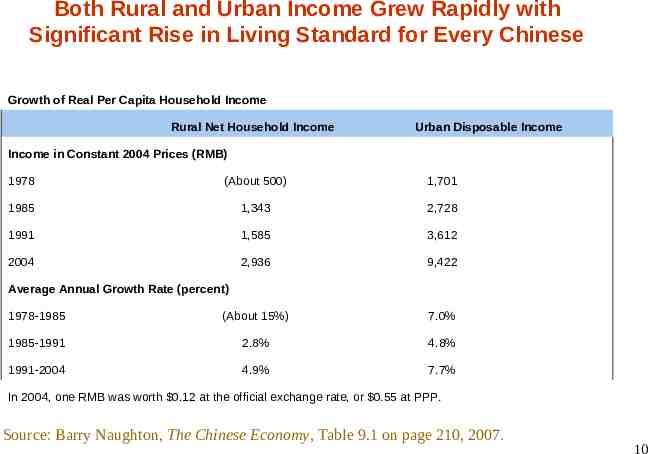
Both Rural and Urban Income Grew Rapidly with Significant Rise in Living Standard for Every Chinese Growth of Real Per Capita Household Income Rural Net Household Income Urban Disposable Income Income in Constant 2004 Prices (RMB) 1978 (About 500) 1,701 1985 1,343 2,728 1991 1,585 3,612 2004 2,936 9,422 1978-1985 (About 15%) 7.0% 1985-1991 2.8% 4.8% 1991-2004 4.9% 7.7% Average Annual Growth Rate (percent) In 2004, one RMB was worth 0.12 at the official exchange rate, or 0.55 at PPP. Source: Barry Naughton, The Chinese Economy, Table 9.1 on page 210, 2007. 10
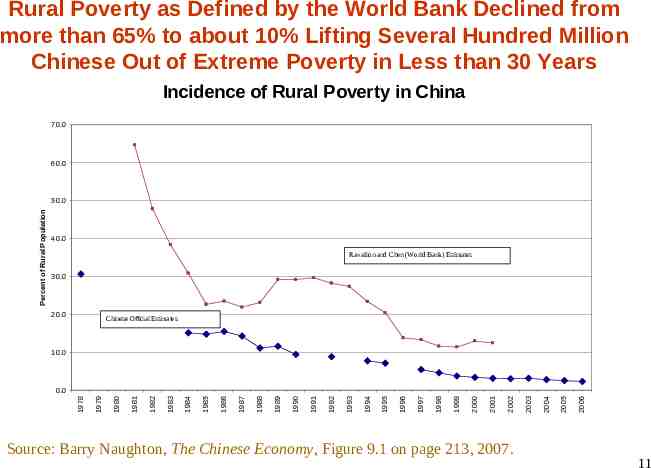
Rural Poverty as Defined by the World Bank Declined from more than 65% to about 10% Lifting Several Hundred Million Chinese Out of Extreme Poverty in Less than 30 Years Incidence of Rural Poverty in China 70.0 60.0 Percent of Rural Population 50.0 40.0 Ravallion and Chen (World Bank) Estimates 30.0 20.0 Chinese Official Estimates 10.0 Source: Barry Naughton, The Chinese Economy, Figure 9.1 on page 213, 2007. 2006 2005 2004 2003 2002 2001 2000 1999 1998 1997 1996 1995 1994 1993 1992 1991 1990 1989 1988 1987 1986 1985 1984 1983 1982 1981 1980 1979 1978 0.0 11
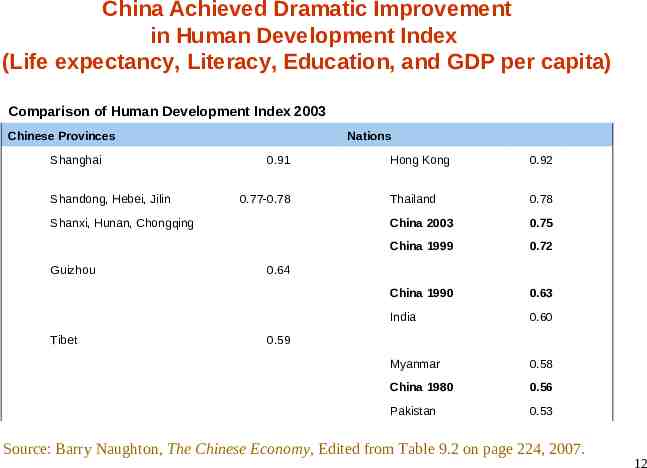
China Achieved Dramatic Improvement in Human Development Index (Life expectancy, Literacy, Education, and GDP per capita) Comparison of Human Development Index 2003 Chinese Provinces Shanghai Shandong, Hebei, Jilin Nations 0.91 0.77-0.78 Shanxi, Hunan, Chongqing Guizhou Tibet Hong Kong 0.92 Thailand 0.78 China 2003 0.75 China 1999 0.72 China 1990 0.63 India 0.60 Myanmar 0.58 China 1980 0.56 Pakistan 0.53 0.64 0.59 Source: Barry Naughton, The Chinese Economy, Edited from Table 9.2 on page 224, 2007. 12
The Role of Public Investment in China’s Growth 13
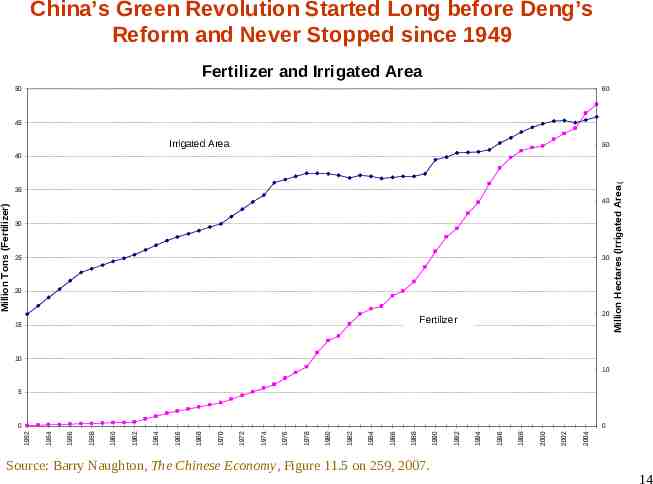
China’s Green Revolution Started Long before Deng’s Reform and Never Stopped since 1949 Fertilizer and Irrigated Area 50 60 45 Irrigated Area 50 Million Tons (Fertilizer) 35 40 30 25 30 20 20 Fertilizer 15 Million Hectares (Irrigated Area ) 40 10 10 5 Source: Barry Naughton, The Chinese Economy, Figure 11.5 on 259, 2007. 2004 2002 2000 1998 1996 1994 1992 1990 1988 1986 1984 1982 1980 1978 1976 1974 1972 1970 1968 1966 1964 1962 1960 1958 1956 1954 0 1952 0 14
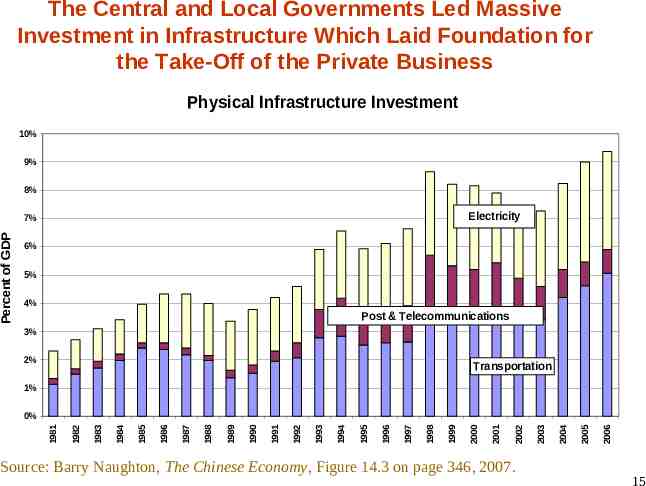
The Central and Local Governments Led Massive Investment in Infrastructure Which Laid Foundation for the Take-Off of the Private Business Physical Infrastructure Investment 10% 9% 8% Electricity Percent of GDP 7% 6% 5% 4% Post & Telecommunications 3% 2% Transportation 1% Source: Barry Naughton, The Chinese Economy, Figure 14.3 on page 346, 2007. 2006 2005 2004 2003 2002 2001 2000 1999 1998 1997 1996 1995 1994 1993 1992 1991 1990 1989 1988 1987 1986 1985 1984 1983 1982 1981 0% 15
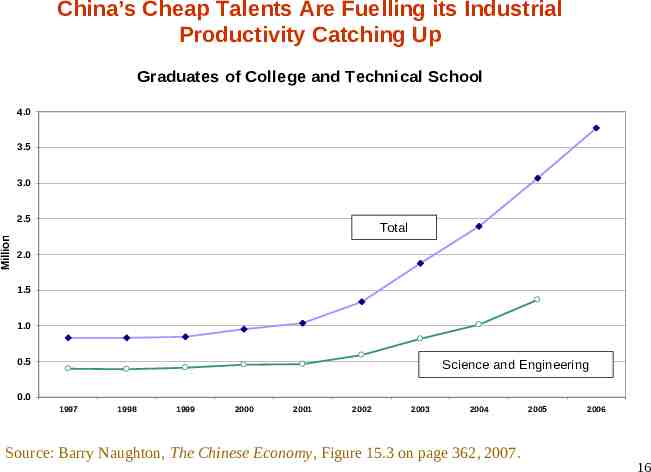
China’s Cheap Talents Are Fuelling its Industrial Productivity Catching Up Graduates of College and Technical School 4.0 3.5 3.0 Million 2.5 Total 2.0 1.5 1.0 0.5 Science and Engineering 0.0 1997 1998 1999 2000 2001 2002 2003 2004 Source: Barry Naughton, The Chinese Economy, Figure 15.3 on page 362, 2007. 2005 2006 16
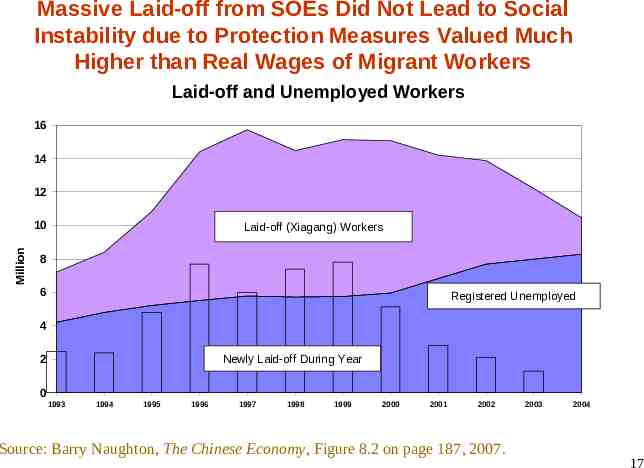
Massive Laid-off from SOEs Did Not Lead to Social Instability due to Protection Measures Valued Much Higher than Real Wages of Migrant Workers Laid-off and Unemployed Workers 16 14 12 Million 10 Laid-off (Xiagang) Workers 8 6 Registered Unemployed 4 2 Newly Laid-off During Year 0 1993 1994 1995 1996 1997 1998 1999 2000 2001 2002 Source: Barry Naughton, The Chinese Economy, Figure 8.2 on page 187, 2007. 2003 2004 17
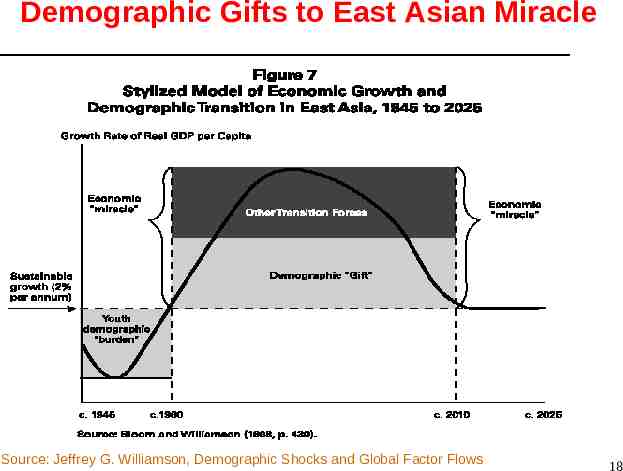
Demographic Gifts to East Asian Miracle Source: Jeffrey G. Williamson, Demographic Shocks and Global Factor Flows 18
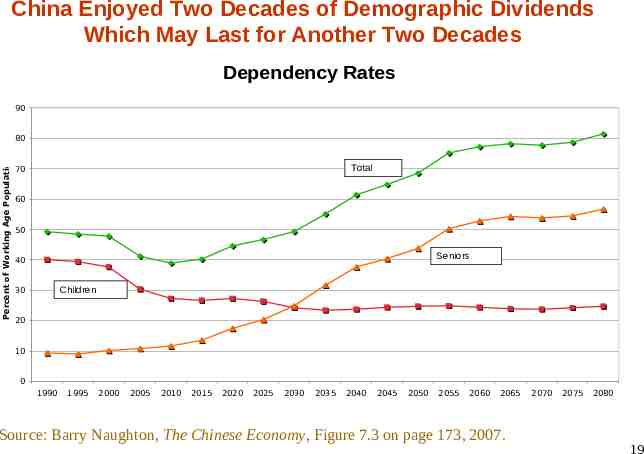
China Enjoyed Two Decades of Demographic Dividends Which May Last for Another Two Decades Dependency Rates 90 Percent of Working Age Population 80 Total 70 60 50 Seniors 40 Children 30 20 10 0 1990 1995 2000 2005 2010 2015 2020 2025 2030 2035 2040 2045 2050 2055 2060 2065 Source: Barry Naughton, The Chinese Economy, Figure 7.3 on page 173, 2007. 2070 2075 2080 19
China’s Open-Door Policy 20
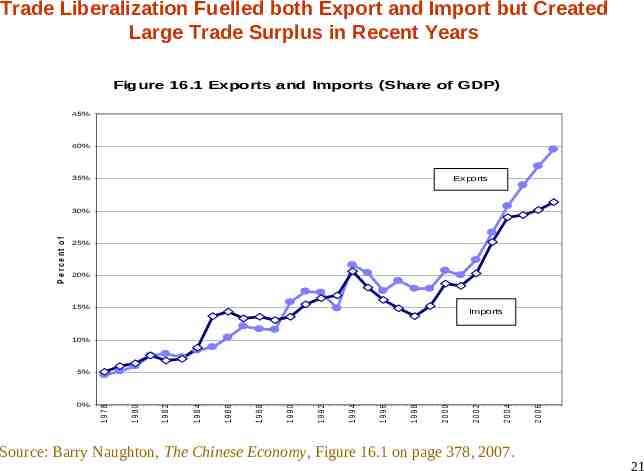
Trade Liberalization Fuelled both Export and Import but Created Large Trade Surplus in Recent Years Figure 16.1 Exports and Imports (Share of GDP) 45% 40% 35% Exports P e rc e nt of G D P 30% 25% 20% 15% Imports 10% Source: Barry Naughton, The Chinese Economy, Figure 16.1 on page 378, 2007. 2006 2004 2002 2000 1998 1996 1994 1992 1990 1988 1986 1984 1982 1980 0% 1978 5% 21
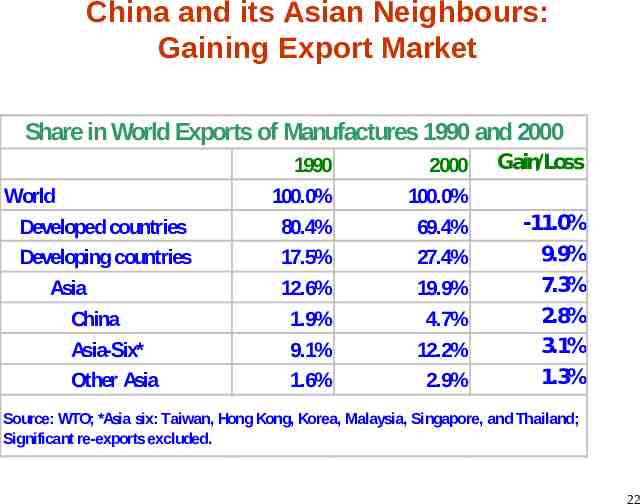
China and its Asian Neighbours: Gaining Export Market Share in World Exports of Manufactures 1990 and 2000 World Developed countries Developing countries Asia China Asia-Six* Other Asia 1990 100.0% 80.4% 17.5% 12.6% 1.9% 9.1% 1.6% 2000 100.0% 69.4% 27.4% 19.9% 4.7% 12.2% 2.9% Gain/Loss -11.0% 9.9% 7.3% 2.8% 3.1% 1.3% Source: WTO; *Asia six: Taiwan, Hong Kong, Korea, Malaysia, Singapore, and Thailand; Significant re-exports excluded. 22
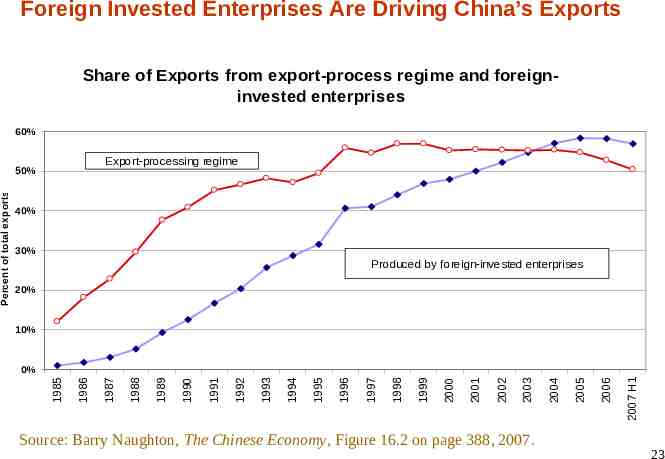
Foreign Invested Enterprises Are Driving China’s Exports Share of Exports from export-process regime and foreigninvested enterprises 60% Export-processing regime 40% 30% Produced by foreign-invested enterprises 20% 10% Source: Barry Naughton, The Chinese Economy, Figure 16.2 on page 388, 2007. 2007 H1 2006 2005 2004 2003 2002 2001 2000 1999 1998 1997 1996 1995 1994 1993 1992 1991 1990 1989 1988 1987 1986 0% 1985 Percent of total exports 50% 23
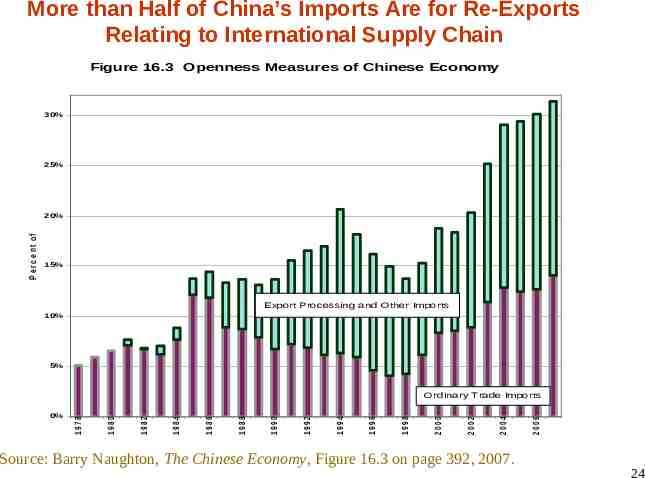
More than Half of China’s Imports Are for Re-Exports Relating to International Supply Chain Figure 16.3 Openness Measures of Chinese Economy 30% P e rc e nt of G D P 25% 20% f 15% Export Processing and Other Imports 10% 5% Source: Barry Naughton, The Chinese Economy, Figure 16.3 on page 392, 2007. 2006 2004 2002 2000 1998 1996 1994 1992 1990 1988 1986 1984 1982 1980 0% 1978 Ordinary Trade Imports 24
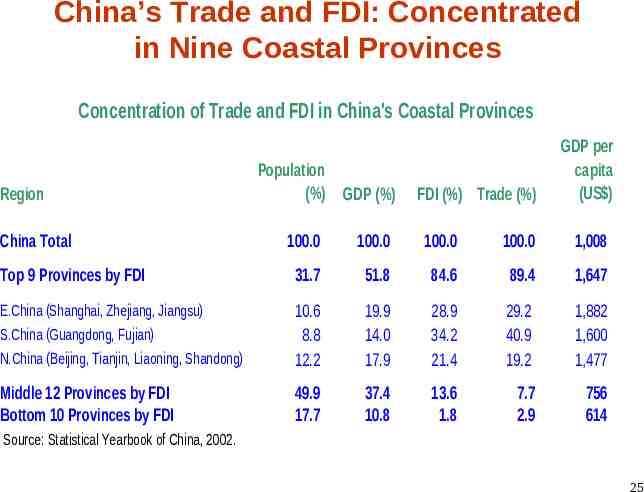
China’s Trade and FDI: Concentrated in Nine Coastal Provinces Concentration of Trade and FDI in China's Coastal Provinces Region China Total Population (%) GDP (%) FDI (%) Trade (%) GDP per capita (US ) 100.0 100.0 100.0 100.0 1,008 Top 9 Provinces by FDI 31.7 51.8 84.6 89.4 1,647 E.China (Shanghai, Zhejiang, Jiangsu) S.China (Guangdong, Fujian) N.China (Beijing, Tianjin, Liaoning, Shandong) 10.6 8.8 12.2 19.9 14.0 17.9 28.9 34.2 21.4 29.2 40.9 19.2 1,882 1,600 1,477 Middle 12 Provinces by FDI Bottom 10 Provinces by FDI 49.9 17.7 37.4 10.8 13.6 1.8 7.7 2.9 756 614 Source: Statistical Yearbook of China, 2002. 25
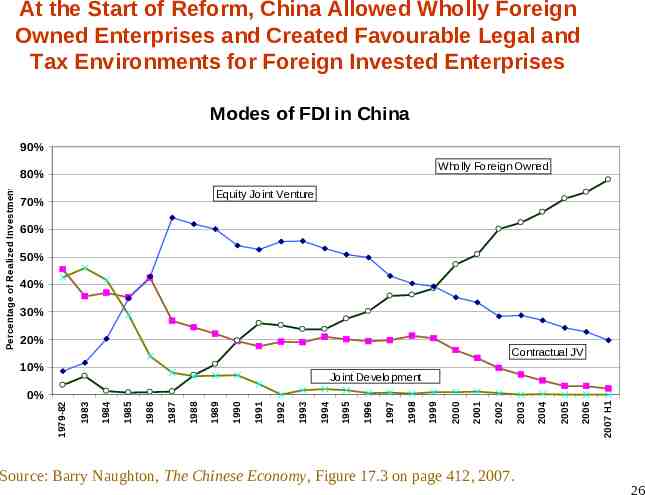
At the Start of Reform, China Allowed Wholly Foreign Owned Enterprises and Created Favourable Legal and Tax Environments for Foreign Invested Enterprises Modes of FDI in China 90% Wholly Foreign Owned Equity Joint Venture 70% 60% 50% 40% 30% 20% Contractual JV 10% Joint Development Source: Barry Naughton, The Chinese Economy, Figure 17.3 on page 412, 2007. 2006 2005 2004 2003 2002 2001 2000 1999 1998 1997 1996 1995 1994 1993 1992 1991 1990 1989 1988 1987 1986 1985 1984 1983 1979-82 0% 2007 H1 Percentage of Realized Investment 80% 26
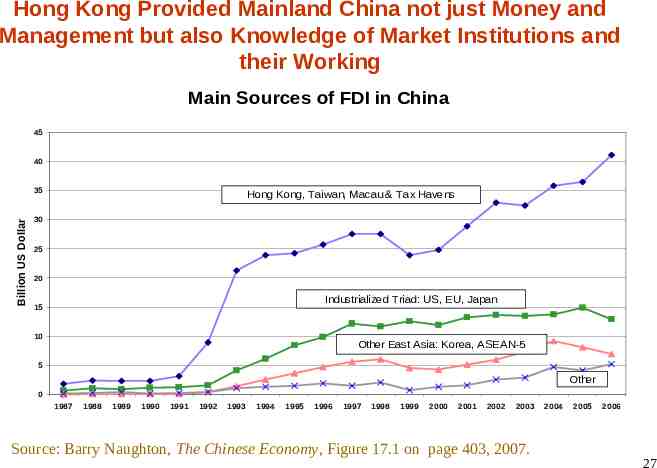
Hong Kong Provided Mainland China not just Money and Management but also Knowledge of Market Institutions and their Working Main Sources of FDI in China 45 40 Billion US Dollars 35 Hong Kong, Taiwan, Macau & Tax Havens 30 25 20 Industrialized Triad: US, EU, Japan 15 10 Other East Asia: Korea, ASEAN-5 5 Other 0 1987 1988 1989 1990 1991 1992 1993 1994 1995 1996 1997 1998 1999 2000 2001 2002 2003 Source: Barry Naughton, The Chinese Economy, Figure 17.1 on page 403, 2007. 2004 2005 2006 27
China’s Market-Oriented Reform Policy 28
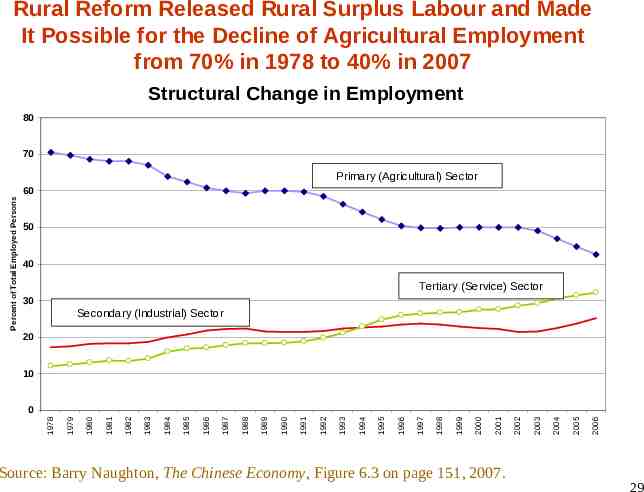
Rural Reform Released Rural Surplus Labour and Made It Possible for the Decline of Agricultural Employment from 70% in 1978 to 40% in 2007 Structural Change in Employment 80 70 Primary (Agricultural) Sector Percent of Total Employed Persons 60 50 40 Tertiary (Service) Sector 30 Secondary (Industrial) Sector 20 10 Source: Barry Naughton, The Chinese Economy, Figure 6.3 on page 151, 2007. 2006 2005 2004 2003 2002 2001 2000 1999 1998 1997 1996 1995 1994 1993 1992 1991 1990 1989 1988 1987 1986 1985 1984 1983 1982 1981 1980 1979 1978 0 29
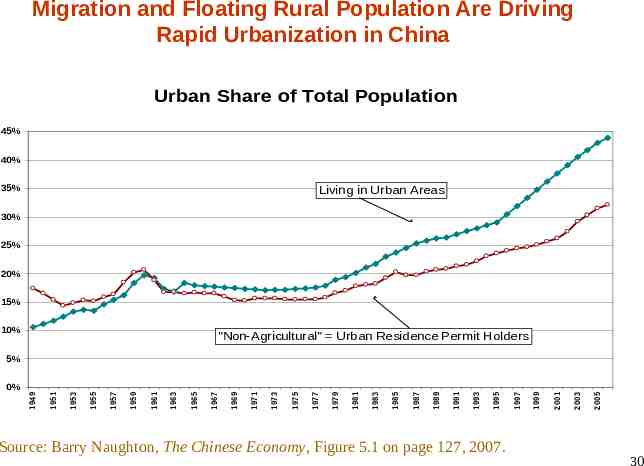
Migration and Floating Rural Population Are Driving Rapid Urbanization in China Urban Share of Total Population 45% 40% 35% Living in Urban Areas 30% 25% 20% 15% 10% "Non-Agricultural" Urban Residence Permit Holders Source: Barry Naughton, The Chinese Economy, Figure 5.1 on page 127, 2007. 2005 2003 2001 1999 1997 1995 1993 1991 1989 1987 1985 1983 1981 1979 1977 1975 1973 1971 1969 1967 1965 1963 1961 1959 1957 1955 1953 1951 0% 1949 5% 30
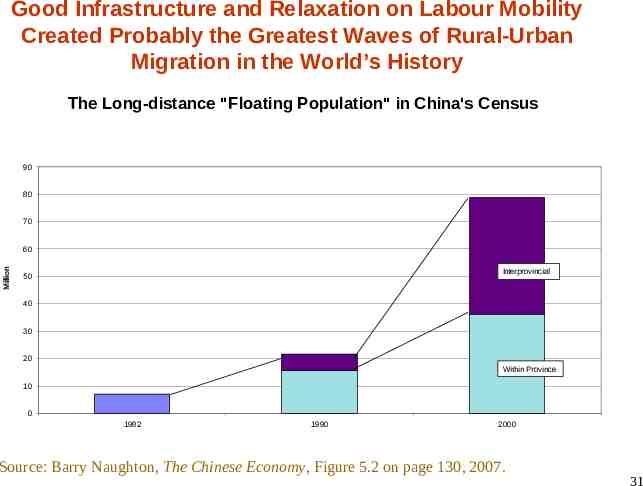
Good Infrastructure and Relaxation on Labour Mobility Created Probably the Greatest Waves of Rural-Urban Migration in the World’s History The Long-distance "Floating Population" in China's Census 90 80 70 Million 60 Interprovincial 50 40 30 20 Within Province 10 0 1982 1990 2000 Source: Barry Naughton, The Chinese Economy, Figure 5.2 on page 130, 2007. 31
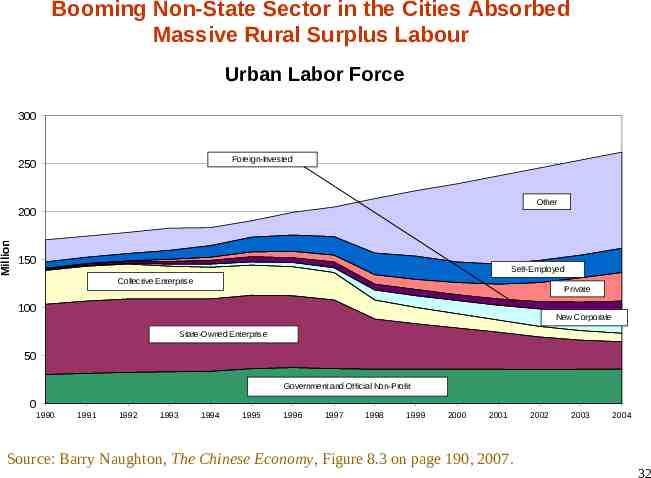
Booming Non-State Sector in the Cities Absorbed Massive Rural Surplus Labour Urban Labor Force 300 Foreign-Invested 250 Other Million 200 150 Self-Employed Collective Enterprise Private 100 New Corporate State-Owned Enterprise 50 Government and Official Non-Profit 0 1990 1991 1992 1993 1994 1995 1996 1997 1998 1999 2000 2001 Source: Barry Naughton, The Chinese Economy, Figure 8.3 on page 190, 2007. 2002 2003 2004 32
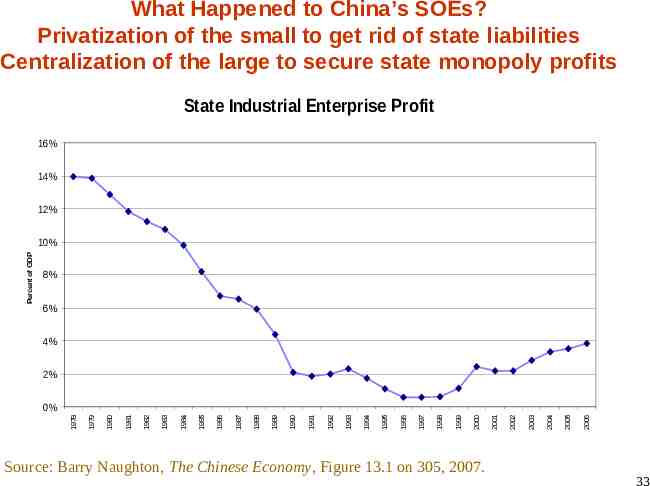
What Happened to China’s SOEs? Privatization of the small to get rid of state liabilities Centralization of the large to secure state monopoly profits State Industrial Enterprise Profit 16% 14% 12% Percent of GDP 10% 8% 6% 4% 2% Source: Barry Naughton, The Chinese Economy, Figure 13.1 on 305, 2007. 2006 2005 2004 2003 2002 2001 2000 1999 1998 1997 1996 1995 1994 1993 1992 1991 1990 1989 1988 1987 1986 1985 1984 1983 1982 1981 1980 1979 1978 0% 33
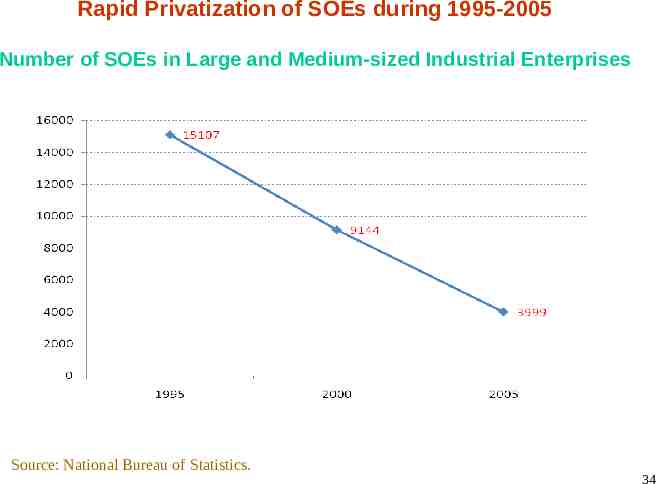
Rapid Privatization of SOEs during 1995-2005 Number of SOEs in Large and Medium-sized Industrial Enterprises Source: National Bureau of Statistics. 34
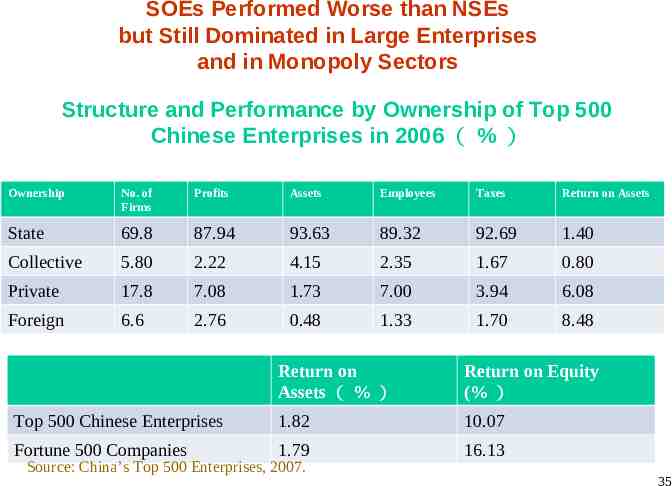
SOEs Performed Worse than NSEs but Still Dominated in Large Enterprises and in Monopoly Sectors Structure and Performance by Ownership of Top 500 Chinese Enterprises in 2006 ( % ) Ownership No. of Firms Profits Assets Employees Taxes Return on Assets State 69.8 87.94 93.63 89.32 92.69 1.40 Collective 5.80 2.22 4.15 2.35 1.67 0.80 Private 17.8 7.08 1.73 7.00 3.94 6.08 Foreign 6.6 2.76 0.48 1.33 1.70 8.48 Return on Assets ( % ) Return on Equity (% ) Top 500 Chinese Enterprises 1.82 10.07 Fortune 500 Companies 1.79 16.13 Source: China’s Top 500 Enterprises, 2007. 35
Reading List 1. 2. 3. 4. 5. 6. 7. Sach, D. Jeffrey. “China: catching up after half a millennium,” chapter 8 in The End of Poverty, 2005. Sachs, D. Jeffrey and Wing Thye Woo. “Structural Factors in the Economic Reforms of China, Eastern Europe, and the Former Soviet Union” Economic Policy, Vol. 9, No. 18 (Apr., 1994), pp. 101-145. Dollar, David. “Poverty, inequality and social disparities during China’s economic reform.” Policy Research Working Paper, WPS4253, The World Bank, 2007. http://www-wds.worldbank.org/external/default/WDSContentServer/WDSP/IB/2007/06/13/0000164 06 20070613095018/Rendered/PDF/wps4253.pdf Cheong, Young-rok and Geng Xiao. “Global Capital Flows and the Position of China: Structural and Institutional Factors and their Implications,” Chapter 8 in China’s Role in Asia and the World Economy - Fostering Stability and Growth, Forum on Debt and Development, December 2003. http://www.fondad.org/publications/china Xiao, Geng. “Reforming the Governance Structure of China's State Owned Enterprises.” Public Administration and Development, No. 18, 273-280, 1998. Woo, Wing Thye and Geng Xiao. “Facing Protectionism Generated by Trade Disputes: China’s Post-WTO Blues,” In Garnaut, R. and L. Song (eds.) China: Linking Markets for Growth, 2007. Naughton, Barry. The Chinese Economy: Transitions and Growth, The MIT Press, 2007. 36