How to write a scientific paper Grace Townshend CardioVascular Journal


92 Slides2.62 MB
How to write a scientific paper Grace Townshend CardioVascular Journal of Africa: Workshop at Pan African Society of Cardiology (PASCAR) Conference 26 May 2011
Programme Why publish? Journal considerations IMRAD structure Parts of the paper Statistics – brief points When you think you’ve finished Appendix: Figures and tables
Why publish? Share your results Establish credibility of the work Further your career
Who is your reader? Other scientists Funding agencies Government officials Other?
Value of unpublished work Who benefits? Possibly, person who did the work (?) Nobody Who is disadvantaged? Other researchers Funders of the work Patients
Programme Why publish? Journal considerations IMRAD structure Parts of the paper Statistics – brief points When you think you’ve finished Appendix: Figures and tables
Why do journals exist? To publish research that is important to their audience To educate readers To interpret and synthesise research findings To encourage debate
What do journals want? A paper that: Adds to knowledge Shows a well-designed study Is well written Is clinically significant Provides an enlightening discussion Conforms with journal requirements and international codes
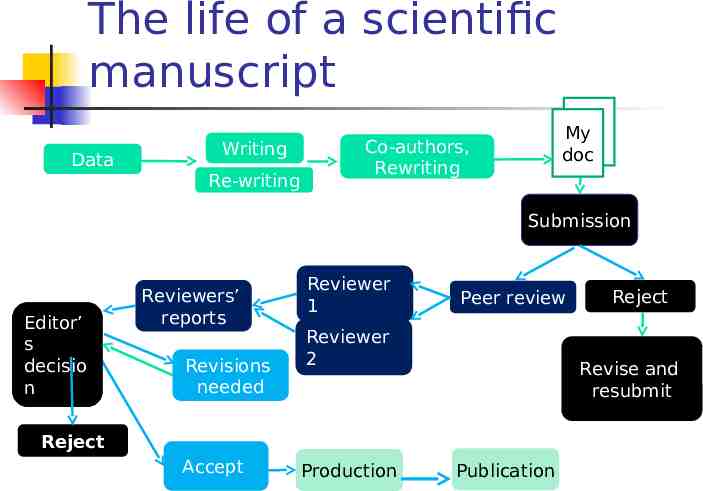
The life of a scientific manuscript Data Writing Re-writing My doc Co-authors, Rewriting Submission Editor’ s decisio n Reviewers’ reports Revisions needed Reviewer 1 Peer review Reviewer 2 Revise and resubmit Reject Accept Production Reject Publication
Peer review ‘Quality controllers’ of the scientific literature Unpaid: done in the spirit of ‘giving back’ Can greatly improve articles (by addressing issues in the research itself or the reporting of the research)
CONSORT guidelines for clinical trial reports Outlines a standard way for authors to report trial findings Freely accessible online Schulz et al. CONSORT 2010 Statement: Updated guidelines for Reporting Parallel Group Randomised Trials. PLOS Medicine 7(3):1-7. http://www.consort-statement.org/?o 1001
Ethics: research Get ethical approval before you start working with humans or animals Obtain written informed consent for any interventions
Ethics: publishing Plagiarism is unacceptable Cite references Do not copy work directly unless it is shown as a quote Permission is needed to re-use tables and figures Can phrases ever be re-used?
Choosing a journal Published topics Medline indexed Peer reviewed Impact factor Geographic coverage Rejection rate Length of time from submission to publication
Why choose the journal before the manuscript is finished? Style for journal when writing instructions for authors previously published manuscripts Content specific to journal audience Enquire about suitability prior to submission?
Before you start Check journal requirements! - Instructions to authors Have a copy of a sample article Assemble all your data Assemble references
Programme Why publish? Journal considerations IMRAD structure Parts of the paper Statistics – brief points When you think you’ve finished Appendix: Figures and tables
Structuring any kind of writing ‘One big idea’ A few key sections Use helpful subheadings Provide supporting facts Group logically within sections Don’t assume everything will be read
The IMRAD structure Title Abstract Introduction Methods Results and Discussion References Acknowledgements Appendices
IMRAD Introduction What did I do, and why? Methods (including Materials/Patients) How did I do it? Results What did I find? Discussion What does it mean?
IMRAD - benefits Based on the principles of critical argument Reader knows at the beginning what the paper is about, and where to find items N.B. This is the order in the published paper, but not necessarily the order in which to write!
The IMRAD structure: possible writing order Outline Methods Results Introduction Discussion Title Abstract Acknowledgements Appendices Work out what suits you best!
Outline Write an outline based on IMRAD: Introduction – why did you do the study? Results – which results answer the question? Methods – which ones need to be included? Discussion – key points Select which references you need and order any missing ones
Function of the title Contains the essence of your ‘story’ Helps you focus Should be a true description of the contents! Used for scanning Used by indexing and abstracting services
Types of title Passive: gives topic Concurrent resistance and aerobic training as protection against heart disease Active: gives main conclusion The vascular endothelium masks the persistent inhibition of rat thoracic arterial tone induced by S-nitrosoglutathione Less common
Tips for writing the Title Look at journal for examples of usual style Be as specific as possible Don’t waste words Avoid non-standard abbreviations
Titles: exercise In groups of two, look at these titles of articles which all report research studies. Is each one specific enough? Would it ‘hook’ you into reading the study?
Introduction: function What’s the problem? Why should anyone care? How do we propose to solve it?
Introduction: organisation (1) Start with the known Move to the
Tips for writing the Introduction Give brief background Provide the context that shows why your question is important State aim of your study Keep it short! Consider the journal’s readers: What do they need to know? What do they know already? What terminology is appropriate?
Introduction: references The references cited here help the reader understand the question Choose the most important and best-conducted studies Minimum number necessary Including everything doesn’t prove that you know everything; it proves that you lack discrimination
Introduction: Exercise The exercise consists of two introductions, one short, one long. Read the two introductions quickly (don’t try to read in depth) and then discuss (in groups of two): Do they present what is known? Do they clearly state what they set out to study? Is the length right?
Methods and patients A ‘recipe’ for the study In basic research papers: repeatability In clinical papers: comparability Q: Why do methods matter? A: Validity of your results will be judged on the methods
Structuring methods and results: a mirror image Standard sequence of methods: Study design Patient description, interventions Definition of endpoints Primary endpoint Secondary efficacy endpoints Safety endpoints Statistics Standard sequence of results: Study flow Patient baseline characteristics Results of each endpoint Primary endpoint Secondary efficacy endpoints Safety endpoints
Methods: items on CONSORT checklist Trial design Participants Intervention Outcomes Sample size Randomisation Blinding Statistical methods
Tips for writing the Methods Avoid fussy detail Use past tense Use subheadings Give references for established techniques; describe only novel techniques in detail
Results: function Beware! Do not mix Results and Discussion The Results section DOES state the results present the supporting data (including tables and figures) It does NOT compare the work with that of others relate the findings to other work
Tips for writing the Results Logical order, following methods Use subheadings Report only relevant results For every result reported, there must be a method, and vice versa
Structuring methods and results: a mirror image Standard sequence of methods: Study design Patient description, interventions Definition of endpoints Primary endpoint Secondary efficacy endpoints Safety endpoints Statistics Standard sequence of results: Study flow Patient baseline characteristics Results of each endpoint Primary endpoint Secondary efficacy endpoints Safety endpoints
Results: items on CONSORT checklist Participant flow Recruitment Baseline data Numbers analysed Outcomes and estimation of precision Ancillary analyses Harms (i.e. adverse events)
Use of figures and tables Evidence: To summarise data that supports your findings Efficiency: To give precise data that cannot easily be presented in text Emphasis: To highlight key points A picture can be worth 500 words!
Programme Why publish? Journal considerations IMRAD structure Parts of the paper Statistics – brief points When you think you’ve finished Appendix: Figures and tables
Statistical methods Get expert statistical advice from the beginning Report: Alpha level (value defining statistical significance) Statistical test(s) used and type of data Statistical software program used
Statistics: exercise 1. In a drug trial, 4.1% of patients in the control group had a heart attack, compared with 2.7% of those in the drug group. What was the absolute reduction in risk? What was the relative reduction in risk? 2. A trial of a diabetes drug in 6,000 overweight patients showed the following: Mean weight loss with Drug A 1.2 kg Mean weight loss with Drug B 0.9 kg (p 0.005). What can we say about the statistical significance and clinical significance of these results?
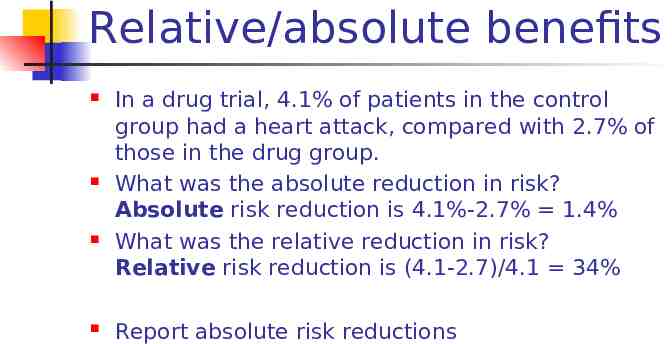
Relative/absolute benefits In a drug trial, 4.1% of patients in the control group had a heart attack, compared with 2.7% of those in the drug group. What was the absolute reduction in risk? Absolute risk reduction is 4.1% 2.7% 1.4% What was the relative reduction in risk? Relative risk reduction is (4.1 2.7)/4.1 34% Report absolute risk reductions
Percentages Report the number of patients/cases as well as percentages 33% of patients has very different value in a sample of 3 or 50!
Pitfalls of probability Do not use the word ‘significant’ unless you mean statistically significant Statistical significance clinical significance p-values 0.05 are significant No significant difference equal p-values do not show magnitude of advantage or difference
Measures of precision Results of most biomedical studies are estimates Estimates require a measure of precision Standard deviation (SD) – measures how spread out the data are 95% confidence interval (CI) – the true result will fall within this interval 95% of the time
Measures of precision ECG measurement Group A Group B p value Mean IVSDd (cm) 1.11 0.22 1.10 0.23 0.90 Mean PWDd (cm) 1.15 0.32 1.08 0.24 0.49 Ojji 2009 Rate of VTE Group A (n 240) (%) Group B (n 240) (%) Absolute difference A B (%) (95% CI) p value 0-84 days 2.1 4.6 2.5 ( 5.7 to 0.7) 0.20 85-365 days 10.4 8.3 2.1 ( 3.1 to 7.3) 0.43 Hull 2009
Programme Why publish? Journal considerations IMRAD structure Parts of the paper Statistics – brief points Parts of the paper, continued When you think you’ve finished Appendix: Figures and tables
Discussion: contents Answer the main question and give the supporting evidence briefly Do your results fit with existing information? If not, provide possible reasons Explain strengths and limitations of the study Explain the implications
Tips for writing the Discussion Restate the main question with the answer Provide supporting evidence by restating results briefly Focus on what the results mean, don’t repeat detailed values Do not introduce new results Use subheads in a long discussion (remove from final draft)
Discussion: possible limitations to discuss Study design Methods/ Data collection Patient groups studied Unusual conditions Analysis
Conclusion Often merged with Discussion Possibly restate main finding State implications/next step
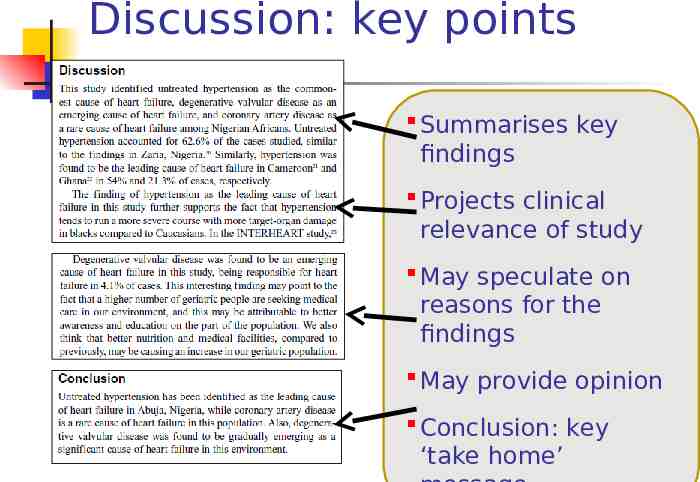
Discussion: key points Summarises key findings Projects clinical relevance of study May speculate on reasons for the findings May provide opinion Conclusion: key ‘take home’
Abstract: function Stands alone Often the only part that’s read Summarises the paper (don’t just ‘cut and paste’) Attracts the reader
Abstract: organisation Write in IMRAD order (some journals require a structured abstract) Context/question Minimal methods Most important results Main conclusion Key words
Tips for writing the abstract Write it last Keep to required length Focus on results Includes a ‘take home message’ Abstracts do not contain: References Figures or tables Information that is not in the paper
Abstracts: exercise With a partner, please read and discuss the provided abstracts, focusing on: What information has been included ‘Take home message’ Which abstract is the most informative?
References Follow Instructions to Authors! Cite only relevant references Reference software, e.g. EndNote, RefMan can be useful
References: which to cite First Most important Most recent Most readily available: Journal articles, websites Book chapters Articles submitted – can only be cited once they are accepted
Authorship and acknowledgements Authorship Decide on authorship at the beginning Consult journal instructions Follow international recommendations1 Acknowledgements Acknowledge funding sources Disclose conflicts of interest 1. International Committee of Medical Journal Editors. http://www.icmje.org/ethical 1author.html
The IMRAD structure: writing order Outline Methods Results Introduction Discussion Title Abstract Acknowledgements Appendices Work out what suits you best!
Programme Why publish? Journal considerations IMRAD structure Parts of the paper Statistics/probability When you think you’ve finished Appendix: Figures and tables
When you think you’ve finished
Revising the draft Sleep on it Be prepared to make several drafts. Get someone to read it
Check logic and story-flow first . Does the paper say all that it should? Are there any unnecessary items? Does each part follow logically?
.then check for accuracy. Data check for accuracy Check references Check units and terminology for consistency Figures and tables: are these all mentioned in the text? do they appear in numerical order? do all the percentages and numbers add up?
Top tips for writing any document 1. Understand the purpose of the document 2. Know what message(s) you have to communicate 3. Write a logical outline 4. Make your text active 5. Use concise, uncomplicated language 6. Avoid repetition and padding 7. Keep to length
Writing is hard work! “When something can be read without effort, great effort has gone into its writing.” Enrique Jardiel Poncela But . It gets easier with practice!
Celebrate when your work is published! Who benefits? You Career; future research (clarified thinking) Other researchers Funders of the work Patients
Acknowledgements In this talk I have used ideas from: Dr Jane Fraser, UK Dr Joan Marsh, UK Watermeadow Medical, UK [email protected]
Useful resources Guidelines for Authors and Translators of Scientific Articles to be Published in English http://www.ease.org.uk/pdfguidelines/AuthorGuidelinesHi ghRes.pdf AuthorAID is a global research community that provides networking, mentoring, resources and training for researchers in developing countries. You can search their resource library at: http://www.authoraid.info/resource-library
Going forward What do you need in order to help you publish your research?
APPENDIX: FIGURES AND TABLES
Figures and tables Group A (n 100) Group B (n 102) Group C (n 99) Age (years) 63.2 64.1 63.9 Female (%) 40 38 37 Systolic BP (mmHg) 180 175 178 Study No. of infusions No. of patients Local pain or redness Systemic reactions (%) Gardulf 1991 3232 25 20% of patients 0.93 Gardulf 1995 33,168 158 19% of patients 0.3 Abrahamsen 1996 1100 8 2.1% of infusions 0 Chapel 2000 1222 30 10.4% of infusions 3.3 Berger 2003 1500 11 Not reported 0.15
When to use tables DO NOT use tables when data can be summarised briefly in the text when relationships of the data or trends can be shown more clearly in a graph DO use tables when readers want exact values of data and this would need several sentences of text
Tables: layout (1) Give each type of information in its own column Sometimes it’s obvious which way round the rows and columns have to be (with rows, there is space for more items) It’s generally easier to read the same item across a row Study groups will usually be shown as column headings
Table: example Group A (n 100 ) Group Group B C (n 102 (n 99) ) Age (years ) 63.2 64.1 Femal e (%) 40 SBP 180 (mmHg ) 63.9 38 37 175 178 Age Femal (years e (%) ) SBP (mmHg) Group A (n 100) 63.2 40 180 Group B (n 102) 64.1 38 175 Group C (n 99) 63.9 37 178
Tables: layout Follow journal instructions Blank cells: leave blank or use -, , ND, as required by journal Footnotes: use symbols as required by journal (e.g. 1, 2, 3; a, b, c) Footnotes follow sequence: across columns first, then down rows Statistical significance: indicate with *
Table: example Group A (n 100 ) Age (years) 63.2 Female (%) 40 Systolic BP 180b (mmHg) a b Based on 92 patients Based on 95 patients Group B (n 102 ) 64.1 38 175 Group C (n 99) 63.9a 37 178
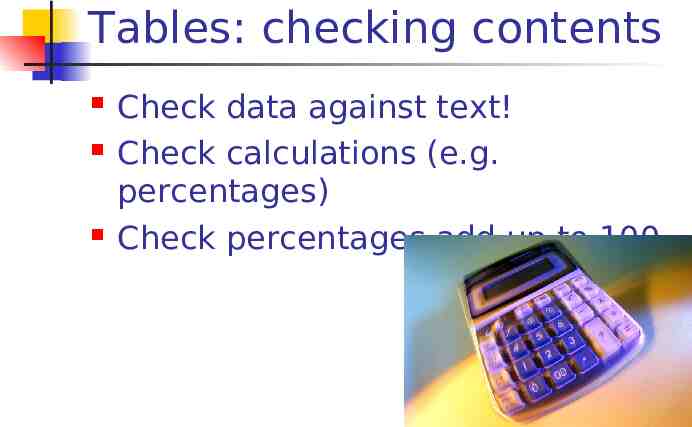
Tables: checking contents Check data against text! Check calculations (e.g. percentages) Check percentages add up to 100
When to use figures To portray reality e.g. electron micrographs To convey patterns or complex data Trends, relationships between data sets To visualise concepts or structures e.g. flow charts, organigrams
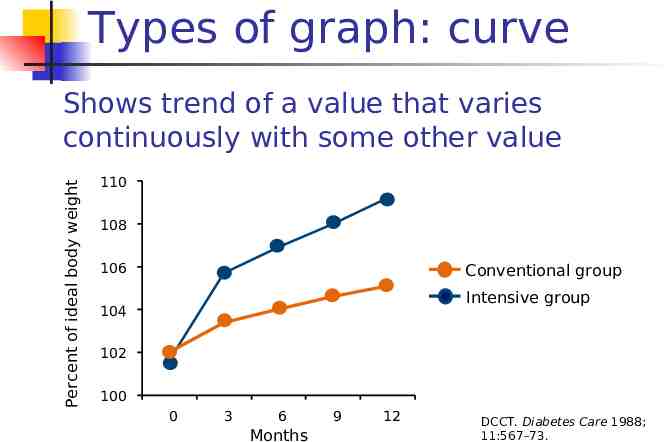
Types of graph: curve Percent of ideal body weight Shows trend of a value that varies continuously with some other value 110 108 106 Conventional group Intensive group 104 102 100 0 3 6 Months 9 12 DCCT. Diabetes Care 1988; 11:567–73.
Types of graph: bar chart Useful for showing sets of values under different conditions Usually discrete (‘single points’) data relative to other data Adrenaline Glucagon 350 120 300 100 250 80 200 60 150 40 100 50 20 0 0 Non-diabetic 1 month 1–5 years 14–31 years Peak hormone responses to insulin induced hypoglycaemia (2.5 mM) Glucagon (pg/ml) Adrenaline (pg/ml)
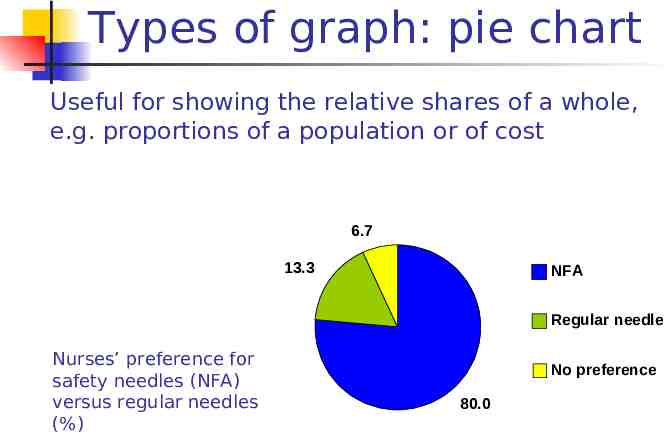
Types of graph: pie chart Useful for showing the relative shares of a whole, e.g. proportions of a population or of cost 6.7 13.3 NFA Regular needle Nurses’ preference for safety needles (NFA) versus regular needles (%) No preference 80.0
Figures: format (1) Keep it simple Present similar results in a similar way Use symbols consistently
Figures: format (2) Label the axes Remember to state the units Use an appropriate scale and suitable intervals Mark any breaks in the axis Mean values: give vertical bars for SD or SEM, state which
Figures: photographs Crop if necessary Include scale bar
Figures and tables Don’t show the same data in figures and tables Don’t duplicate the text (OK to quote selected data to make a point)
Figure/table titles What does it show? Figure/table and title must be self-contained Figure/table number - use correct format - check numbers against text at end
Figures/tables: additional information Definition of symbols/abbreviations (in title, on figure, in footnote) Reproduced with permission from (necessary if using existing figure/table)