How Living Costs Undermine Net Price As An Affordability Metric Braden

35 Slides1.90 MB
How Living Costs Undermine Net Price As An Affordability Metric Braden J. Hosch, Ph.D. Asst. Vice President for Institutional Research, Planning & Effectiveness Association for Institutional Research Annual Forum Denver, CO May 29, 2015 Office of Institutional Research, Planning & Effectiveness
OVERVIEW Except for institutions with very few commuters, net price is not a valid measure of affordability because cost of living budgets are determined without sufficient standards and consistency Research partners through Wisconsin HOPE Lab: Robert Kelchen, Seton Hall University Sara Goldrick-Rab, Univ. of Wisconsin-Madison Office of Institutional Research, Planning & Effectiveness
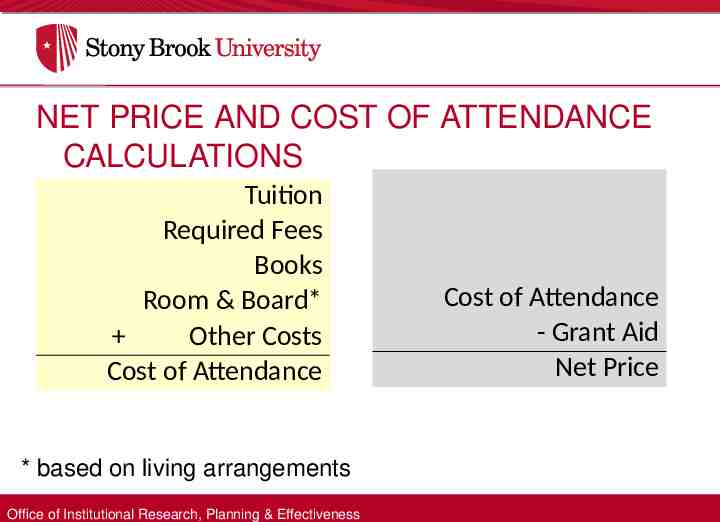
NET PRICE AND COST OF ATTENDANCE CALCULATIONS Tuition Required Fees Books Room & Board* Other Costs Cost of Attendance * based on living arrangements Office of Institutional Research, Planning & Effectiveness Cost of Attendance - Grant Aid Net Price
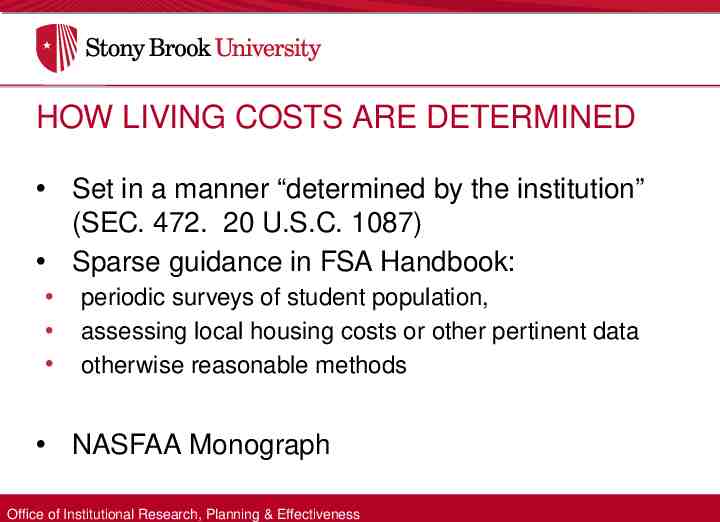
HOW LIVING COSTS ARE DETERMINED Set in a manner “determined by the institution” (SEC. 472. 20 U.S.C. 1087) Sparse guidance in FSA Handbook: periodic surveys of student population, assessing local housing costs or other pertinent data otherwise reasonable methods NASFAA Monograph Office of Institutional Research, Planning & Effectiveness
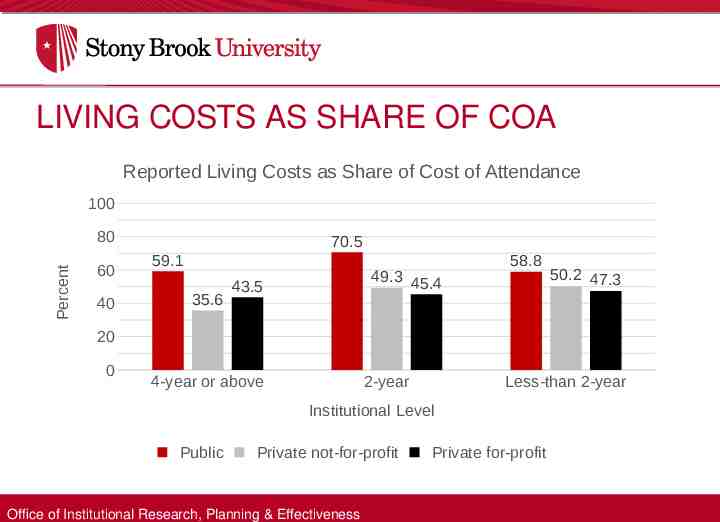
LIVING COSTS AS SHARE OF COA Reported Living Costs as Share of Cost of Attendance 100 Percent 80 60 40 70.5 59.1 35.6 49.3 45.4 43.5 58.8 50.2 47.3 20 0 4-year or above 2-year Less-than 2-year Institutional Level Public Private not-for-profit Office of Institutional Research, Planning & Effectiveness Private for-profit
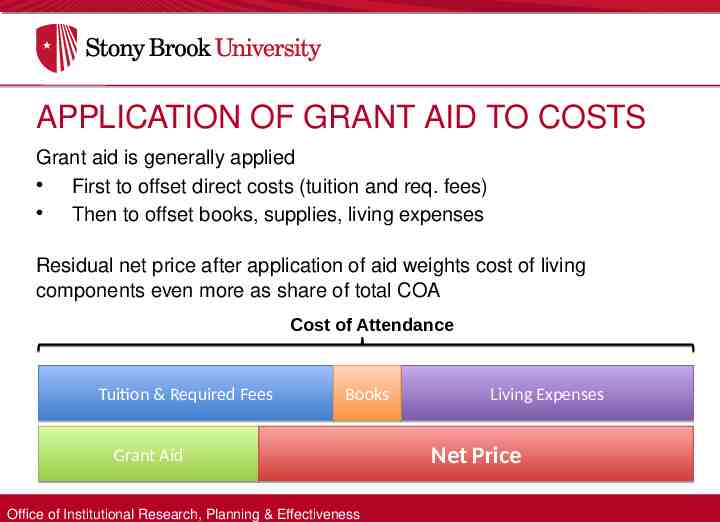
APPLICATION OF GRANT AID TO COSTS Grant aid is generally applied First to offset direct costs (tuition and req. fees) Then to offset books, supplies, living expenses Residual net price after application of aid weights cost of living components even more as share of total COA Cost of Attendance Tuition & Required Fees Books Grant Aid Office of Institutional Research, Planning & Effectiveness Living Expenses Net Price
SELECTED RANKINGS USING NET PRICE Federal Uses: HEOA Watch Lists White House Score Card College Navigator Rating System (?) Selected Ranking Publications: Washington Monthly U.S. News Best Value Colleges Kiplinger’s Best Value Colleges Office of Institutional Research, Planning & Effectiveness
METHODOLOGY Generate county-level estimates of cost-of-living Compare campus-reported costs for living expenses off-campus, not with family to county-level estimates Results analyzed by sector and geospatially Office of Institutional Research, Planning & Effectiveness
REGIONAL ADJUSTMENT APPROACH (1) Model approach on the MIT Living Wage Calculator (Glasmeier & Arete, 2014), using data available when 2013-14 COA numbers were developed Adjusted for regional differences using 2013 County Cost of Living Index when needed Room and board: Housing: HUD median rents by county for efficiency apartment without roommates (FY 2012) Food: USDA low-cost food plan (June 2012) Office of Institutional Research, Planning & Effectiveness
REGIONAL ADJUSTMENT APPROACH (2) “Other expenses”: Transportation: BLS Consumer Expenditure Survey for individuals under 25 years old (2012) Health care: Average premium by state from the Kaiser Family Foundation—national average used if missing data (2010) Miscellaneous: BLS Consumer Expenditure Survey for individuals under 25 years old (2012) Office of Institutional Research, Planning & Effectiveness
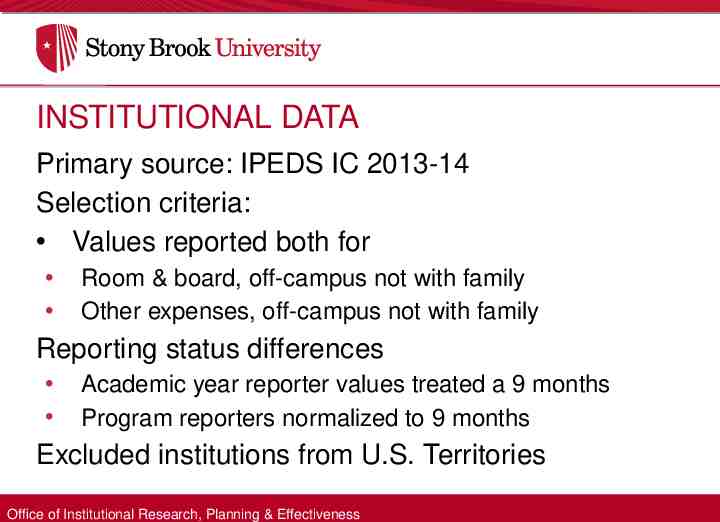
INSTITUTIONAL DATA Primary source: IPEDS IC 2013-14 Selection criteria: Values reported both for Room & board, off-campus not with family Other expenses, off-campus not with family Reporting status differences Academic year reporter values treated a 9 months Program reporters normalized to 9 months Excluded institutions from U.S. Territories Office of Institutional Research, Planning & Effectiveness
LIMITATIONS Costs are not uniform within counties Urban areas: Gasoline/rent costs vary within small areas Rural areas: Transportation costs vary by distance to college Does not reflect variation in needs within students that can be captured by professional judgments Office of Institutional Research, Planning & Effectiveness
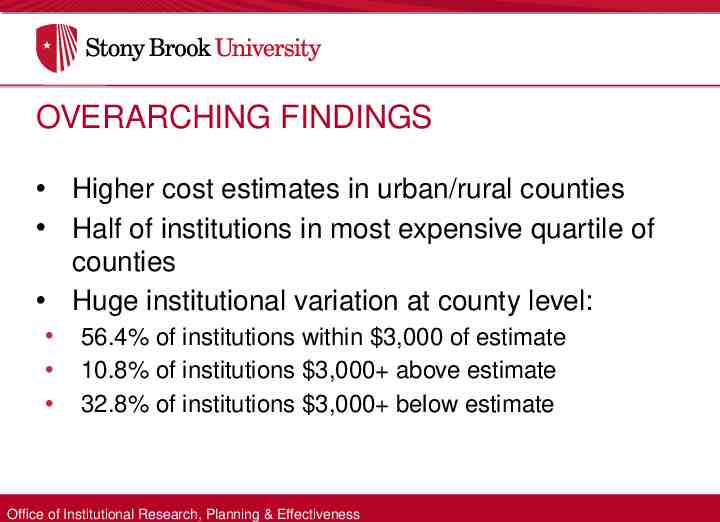
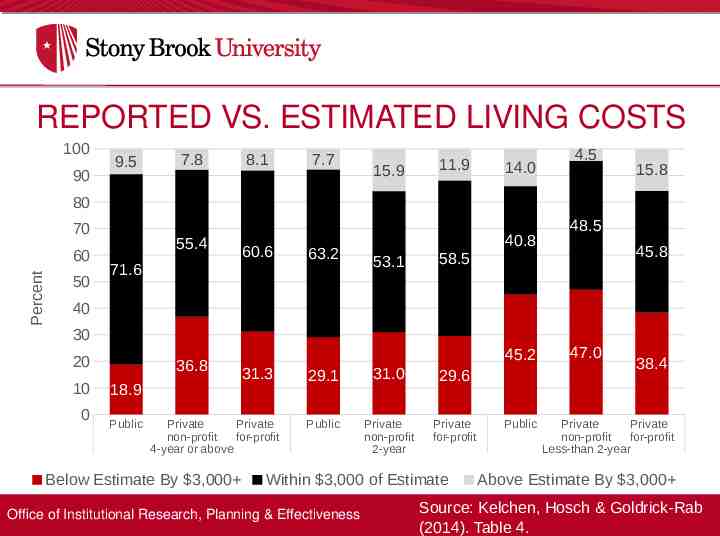
OVERARCHING FINDINGS Higher cost estimates in urban/rural counties Half of institutions in most expensive quartile of counties Huge institutional variation at county level: 56.4% of institutions within 3,000 of estimate 10.8% of institutions 3,000 above estimate 32.8% of institutions 3,000 below estimate Office of Institutional Research, Planning & Effectiveness
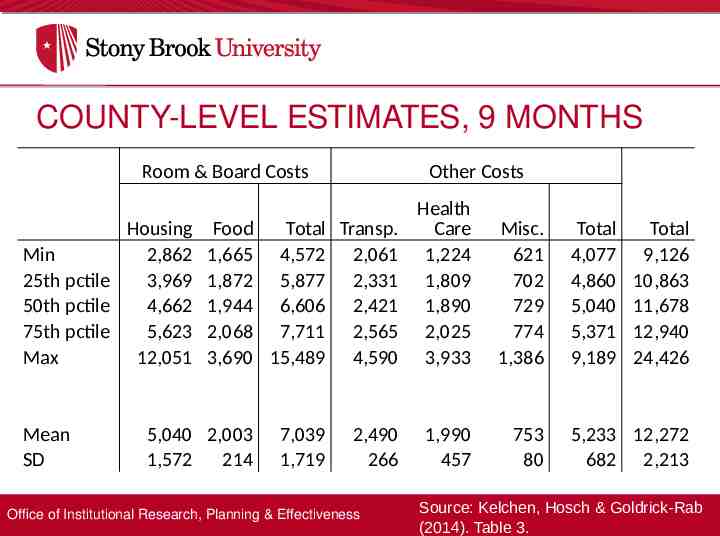
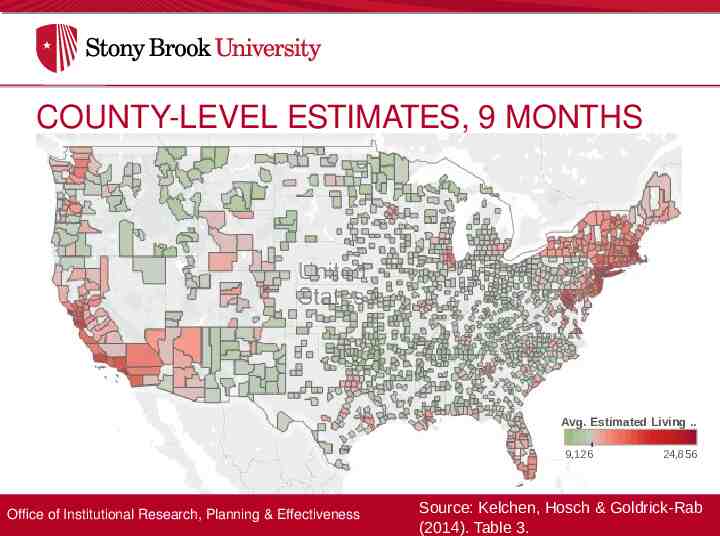
COUNTY-LEVEL ESTIMATES, 9 MONTHS Room & Board Costs Housing Min 2,862 25th pctile 3,969 50th pctile 4,662 75th pctile 5,623 Max 12,051 Mean SD Other Costs Food Total Transp. 1,665 4,572 2,061 1,872 5,877 2,331 1,944 6,606 2,421 2,068 7,711 2,565 3,690 15,489 4,590 5,040 2,003 1,572 214 7,039 1,719 2,490 266 Office of Institutional Research, Planning & Effectiveness Health Care 1,224 1,809 1,890 2,025 3,933 Misc. 621 702 729 774 1,386 1,990 457 753 80 Total 4,077 4,860 5,040 5,371 9,189 Total 9,126 10,863 11,678 12,940 24,426 5,233 12,272 682 2,213 Source: Kelchen, Hosch & Goldrick-Rab (2014). Table 3.
COUNTY-LEVEL ESTIMATES, 9 MONTHS Avg. Estimated Living . 9,126 Office of Institutional Research, Planning & Effectiveness 24,856 Source: Kelchen, Hosch & Goldrick-Rab (2014). Table 3.
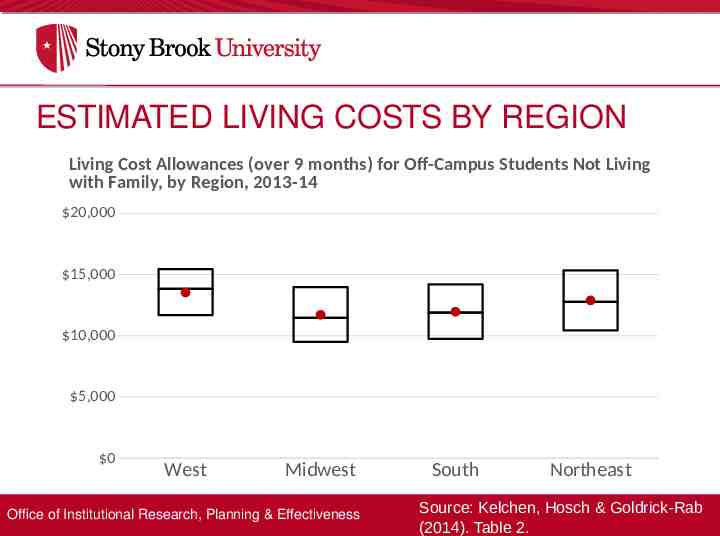
ESTIMATED LIVING COSTS BY REGION Living Cost Allowances (over 9 months) for Off-Campus Students Not Living with Family, by Region, 2013-14 20,000 15,000 10,000 5,000 0 West Midwest Office of Institutional Research, Planning & Effectiveness South Northeast Source: Kelchen, Hosch & Goldrick-Rab (2014). Table 2.
REPORTED VS. ESTIMATED LIVING COSTS 100 90 9.5 7.8 8.1 7.7 15.9 11.9 14.0 4.5 15.8 80 70 Percent 60 50 55.4 60.6 71.6 63.2 40.8 53.1 48.5 45.8 58.5 40 30 20 10 0 36.8 18.9 Public 45.2 31.3 Private Private non-profit for-profit 4-year or above Below Estimate By 3,000 29.1 31.0 29.6 Public Private non-profit 2-year Private for-profit Within 3,000 of Estimate Office of Institutional Research, Planning & Effectiveness Public 47.0 38.4 Private Private non-profit for-profit Less-than 2-year Above Estimate By 3,000 Source: Kelchen, Hosch & Goldrick-Rab (2014). Table 4.
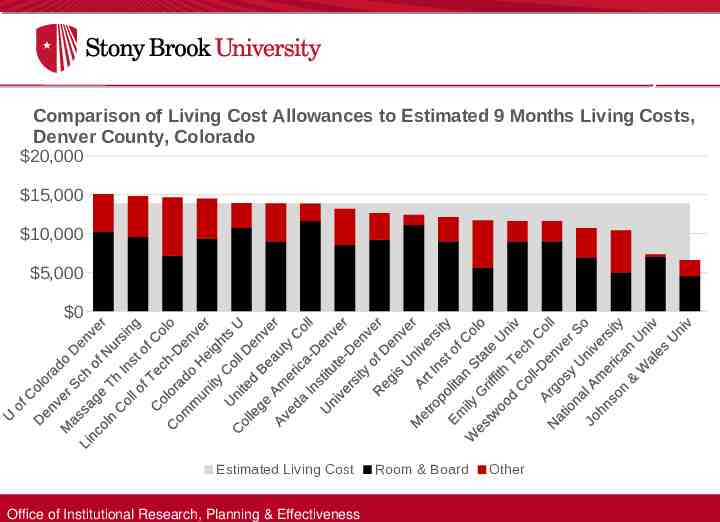
Milwaukee County Comparison of Living Cost Allowances to Estimated 9 Months Living Costs, Denver County, Colorado 20,000 15,000 10,000 5,000 0 Estimated Living Cost Office of Institutional Research, Planning & Effectiveness Room & Board Other
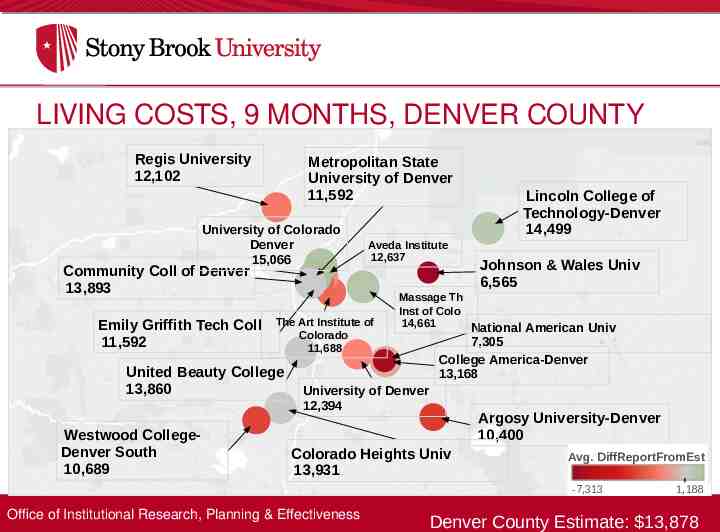
LIVING COSTS, 9 MONTHS, DENVER COUNTY Regis University 12,102 Metropolitan State University of Denver 11,592 University of Colorado Denver 15,066 Community Coll of Denver 13,893 Emily Griffith Tech Coll 11,592 The Art Institute of Colorado 11,688 United Beauty College 13,860 Westwood CollegeDenver South 10,689 Aveda Institute 12,637 Lincoln College of Technology-Denver 14,499 Johnson & Wales Univ 6,565 Massage Th Inst of Colo 14,661 National American Univ 7,305 College America-Denver 13,168 University of Denver 12,394 Argosy University-Denver 10,400 Colorado Heights Univ 13,931 Avg. DiffReportFromEst -7,313 Office of Institutional Research, Planning & Effectiveness 1,188 Denver County Estimate: 13,878
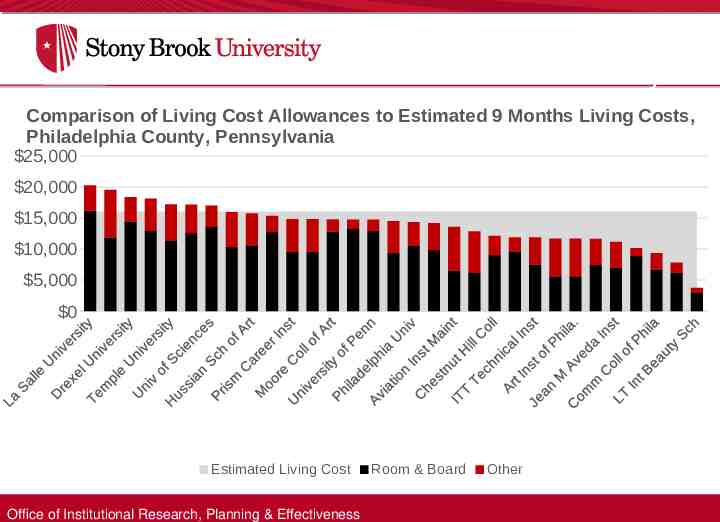
Milwaukee County Comparison of Living Cost Allowances to Estimated 9 Months Living Costs, Philadelphia County, Pennsylvania 25,000 20,000 15,000 10,000 5,000 0 Estimated Living Cost Office of Institutional Research, Planning & Effectiveness Room & Board Other
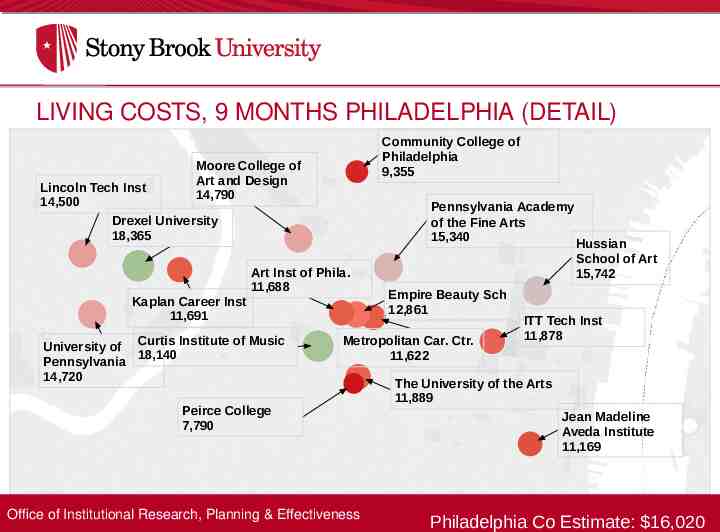
LIVING COSTS, 9 MONTHS PHILADELPHIA (DETAIL) Community College of Philadelphia 9,355 Moore College of Art and Design 14,790 Lincoln Tech Inst 14,500 Drexel University 18,365 Pennsylvania Academy of the Fine Arts 15,340 Art Inst of Phila. 11,688 Kaplan Career Inst 11,691 University of Curtis Institute of Music 18,140 Pennsylvania 14,720 Empire Beauty Sch 12,861 Metropolitan Car. Ctr. 11,622 Peirce College 7,790 Office of Institutional Research, Planning & Effectiveness Hussian School of Art 15,742 ITT Tech Inst 11,878 The University of the Arts 11,889 Jean Madeline Aveda Institute 11,169 Philadelphia Co Estimate: 16,020
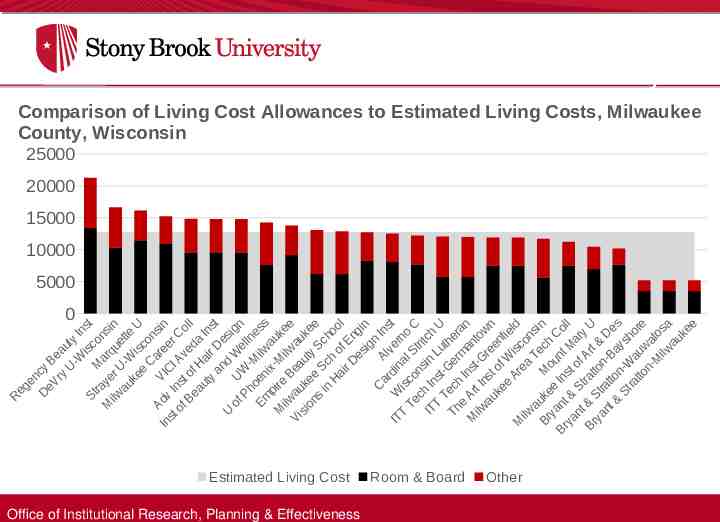
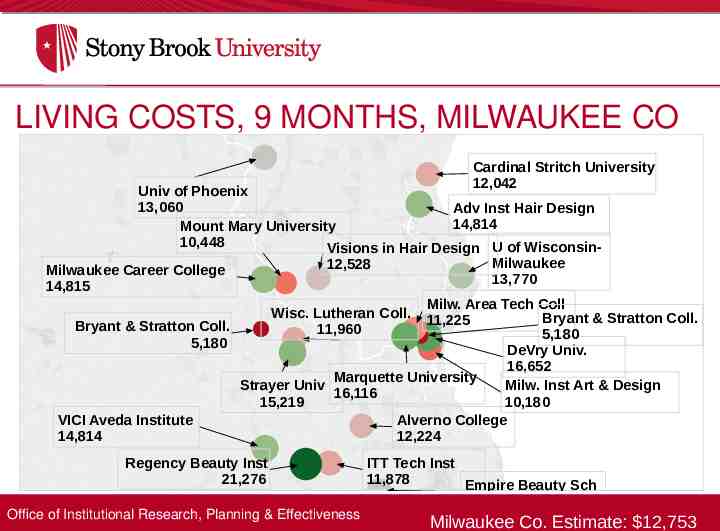
Milwaukee County Comparison of Living Cost Allowances to Estimated Living Costs, Milwaukee County, Wisconsin 25000 20000 15000 10000 5000 0 ll s ll e n n e n st C U es ore sa ee U st U in nst ld in in ol in I no ch era tow fie ns Co ry In ns tte ns Co In sig nes uke uke ho ng k o D y t o c f E gn er tri t h an en co ch Ma t & ysh wat au e co er da De ell a a t c u S u i u is rq a is re ve ir W Milw Milw uty h o es Alv l S n L rm Gre Wis Te unt f Ar -Ba au Milw a Be -W Ma -W Ca I A Ha nd e c D i y U in ns t-G nst t of rea Mo st o tton n-W onU e i x B ea e S a i r C of W a c I r d y n e I r U e e V st e ty a sco Ins ch In tra atto ratt H ns e A en eV r ye uk I k o u r g C i a i n n e t a h p I r h Te A r e D e & S Str St ke au s i ea W P c v k St i l w u R m f w B e o il E on T ITT he lwa au ant t & nt & M Ad of i M s U i T T ilw Bry yan rya st Vi M IT M In B Br Estimated Living Cost Office of Institutional Research, Planning & Effectiveness Room & Board Other
LIVING COSTS, 9 MONTHS, MILWAUKEE CO Cardinal Stritch University 12,042 Univ of Phoenix 13,060 Adv Inst Hair Design 14,814 Mount Mary University 10,448 Visions in Hair Design U of WisconsinMilwaukee 12,528 Milwaukee Career College 13,770 14,815 Milw. Area Tech Coll Bryant & Stratton Coll. 11,225 Bryant & Stratton Coll. 5,180 5,180 DeVry Univ. 16,652 Marquette University Strayer Univ Milw. Inst Art & Design 16,116 15,219 10,180 VICI Aveda Institute Alverno College 14,814 12,224 Wisc. Lutheran Coll. 11,960 Regency Beauty Inst 21,276 Office of Institutional Research, Planning & Effectiveness ITT Tech Inst 11,878 Empire Beauty Sch 12,861 Milwaukee Co. Estimate: 12,753
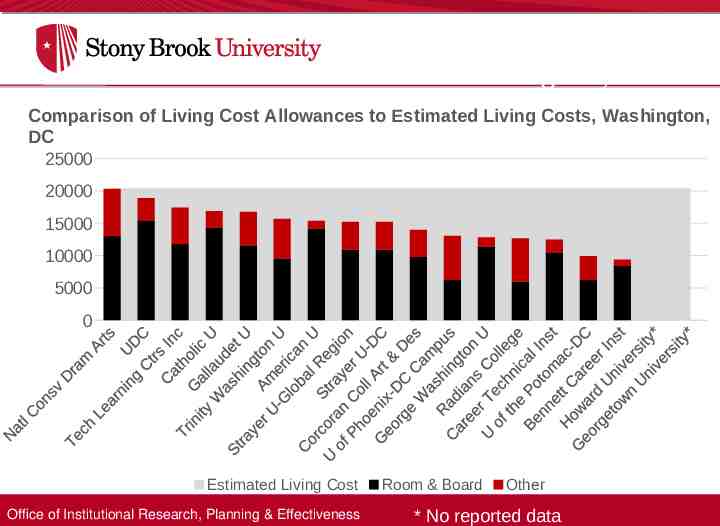
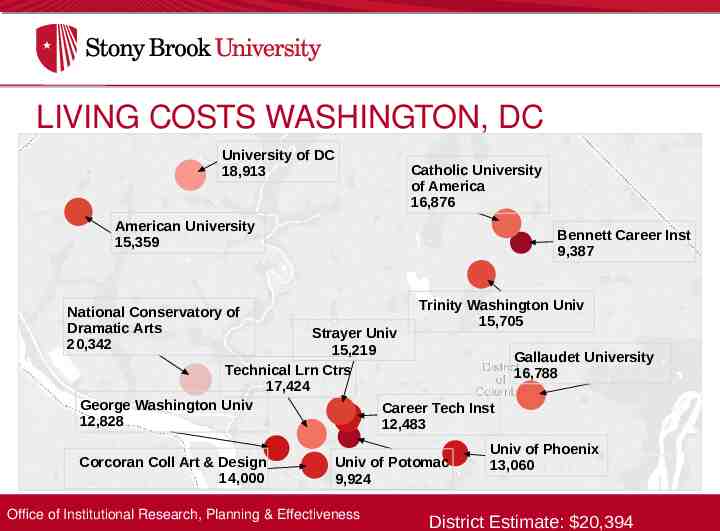
Washington, DC Comparison of Living Cost Allowances to Estimated Living Costs, Washington, DC 25000 20000 15000 10000 5000 0 Estimated Living Cost Office of Institutional Research, Planning & Effectiveness Room & Board Other * No reported data
LIVING COSTS WASHINGTON, DC University of DC 18,913 Catholic University of America 16,876 American University 15,359 Bennett Career Inst 9,387 Trinity Washington Univ 15,705 National Conservatory of Dramatic Arts 20,342 Strayer Univ 15,219 Technical Lrn Ctrs 17,424 George Washington Univ Career Tech Inst 12,828 12,483 Corcoran Coll Art & Design 14,000 Univ of Potomac 9,924 Office of Institutional Research, Planning & Effectiveness Gallaudet University 16,788 Univ of Phoenix 13,060 District Estimate: 20,394
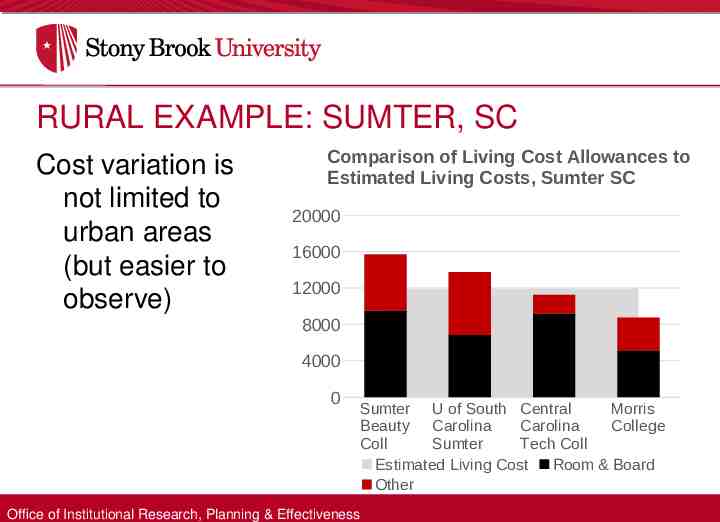
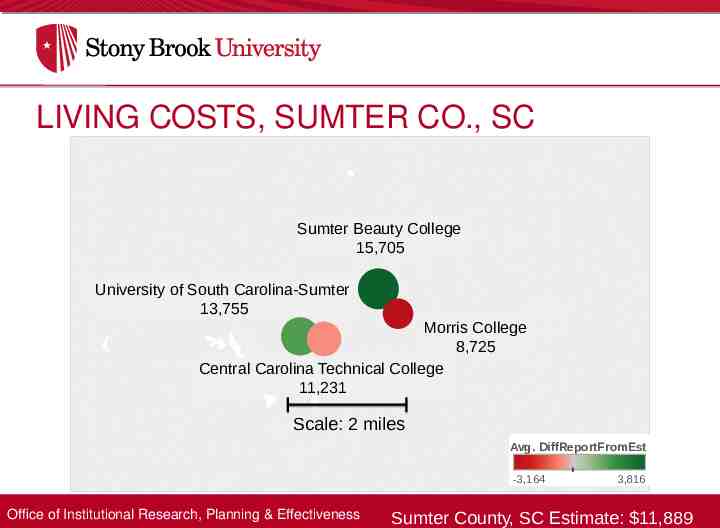
RURAL EXAMPLE: SUMTER, SC Cost variation is not limited to urban areas (but easier to observe) Comparison of Living Cost Allowances to Estimated Living Costs, Sumter SC 20000 16000 12000 8000 4000 0 Office of Institutional Research, Planning & Effectiveness Sumter U of South Central Morris Beauty Carolina Carolina College Coll Sumter Tech Coll Estimated Living Cost Room & Board Other
LIVING COSTS, SUMTER CO., SC Sumter Beauty College 15,705 University of South Carolina-Sumter 13,755 Morris College 8,725 Central Carolina Technical College 11,231 Scale: 2 miles Avg. DiffReportFromEst -3,164 Office of Institutional Research, Planning & Effectiveness 3,816 Sumter County, SC Estimate: 11,889
IMPLICATIONS Net price statistics for institutions with sizeable commuter populations are not necessarily valid across groups Net price should not be used for accountability within broad groups of institutions without correction for living costs Benchmarking activities should examine variation in COA budgets prior to examination of net price Office of Institutional Research, Planning & Effectiveness
UNINTENDED CONSEQUENCES Manipulation of net price to game accountability Subverts transparency agenda Artificial lowering of living costs Incentives to lower living cost budgets may stress students who qualify for less aid Office of Institutional Research, Planning & Effectiveness
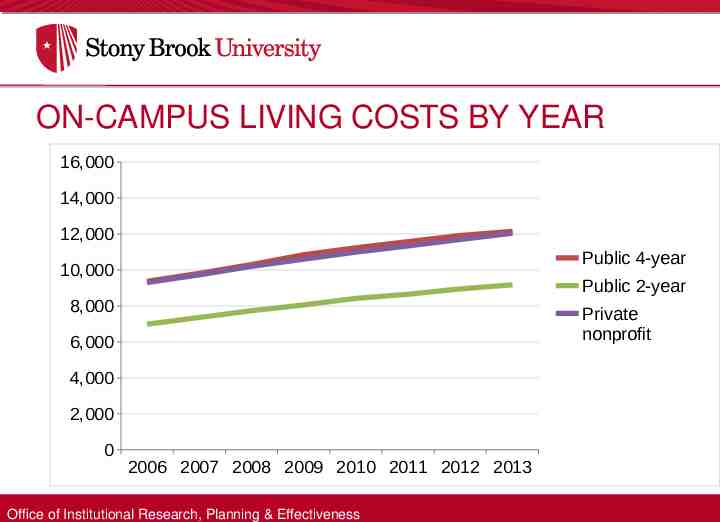
ON-CAMPUS LIVING COSTS BY YEAR 16,000 14,000 12,000 Public 4-year 10,000 Public 2-year 8,000 Private nonprofit 6,000 4,000 2,000 0 2006 2007 2008 2009 2010 2011 2012 2013 Office of Institutional Research, Planning & Effectiveness
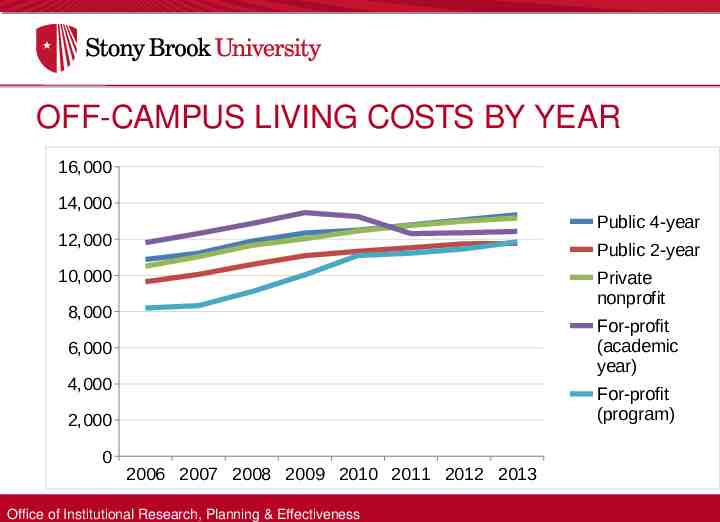
OFF-CAMPUS LIVING COSTS BY YEAR 16,000 14,000 Public 4-year 12,000 Public 2-year 10,000 Private nonprofit 8,000 For-profit (academic year) 6,000 4,000 For-profit (program) 2,000 0 2006 2007 2008 2009 2010 2011 2012 2013 Office of Institutional Research, Planning & Effectiveness
RECOMMENDATIONS (1) 1. Determine living costs at federal level with regional (county) adjustments 2. Failing federal determination, authorize ED to establish rigorous methodology for cost of living budgets 3. Do not include net price in ratings system or 3rd party rankings, unless statistically adjusted Office of Institutional Research, Planning & Effectiveness
RECOMMENDATIONS (2) 4. Failing adoption of #1-3, for the purposes of net price calculations, consider using (nearest) campus living costs for off-campus costs 5. Conduct more research on living expenses at different geographic scales, esp. health care 6. Research community should take more active role in examining reliability and validity of prominent educational statistics Office of Institutional Research, Planning & Effectiveness
RESOURCES & CONTACT INFO Kelchen, R., Hosch, B., Goldrick-Rab, S. The Costs of College Attendance: Trends, Variatio n, and Accuracy in Institutional Living Cost Allowa nces . Association of Public Policy and Management (2014). http://wihopelab.com/publications/. http://www.stonybrook.edu/commcms/irpe/reports/ [email protected] Office of Institutional Research, Planning & Effectiveness