HLTHINFO 730 Healthcare Decision Support Systems Lecture 6:

20 Slides301.50 KB
HLTHINFO 730 Healthcare Decision Support Systems Lecture 6: Decision Trees Lecturer: Prof Jim Warren HLTHINFO 730 – lecture 6 Slide #1
Decision Trees Essentially flowcharts – A natural order of ‘micro decisions’ (Boolean – yes/no decisions) to reach a conclusion – In simplest form all you need is A start (marked with an oval) A cascade of Boolean decisions (each with exactly outbound branches) A set of decision nodes (marked with ovals) and representing all the ‘leaves’ of the decision tree (no outbound branches) HLTHINFO 730 – lecture 6 Slide #2
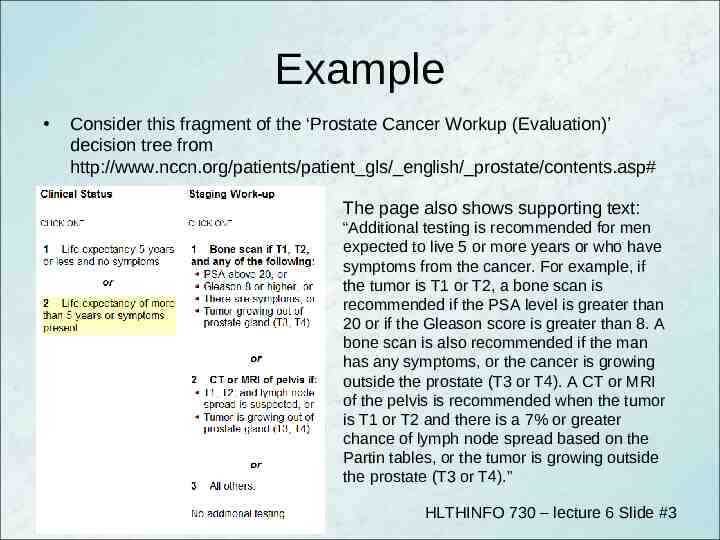
Example Consider this fragment of the ‘Prostate Cancer Workup (Evaluation)’ decision tree from http://www.nccn.org/patients/patient gls/ english/ prostate/contents.asp# The page also shows supporting text: “Additional testing is recommended for men expected to live 5 or more years or who have symptoms from the cancer. For example, if the tumor is T1 or T2, a bone scan is recommended if the PSA level is greater than 20 or if the Gleason score is greater than 8. A bone scan is also recommended if the man has any symptoms, or the cancer is growing outside the prostate (T3 or T4). A CT or MRI of the pelvis is recommended when the tumor is T1 or T2 and there is a 7% or greater chance of lymph node spread based on the Partin tables, or the tumor is growing outside the prostate (T3 or T4).” HLTHINFO 730 – lecture 6 Slide #3
KE problems for flowchart The natural language may pack a lot in – E.g., “any one of the following” – Even harder if they say “two or more of the following” which implies they mean to compute some score and then ask if it’s 2 Incompleteness – There are logically possible (and, worse, physically possible) cases that aren’t handled The ‘for example’ in the text is a worry Inconsistency – Are we trying to reach one decision (which test) or a set of decisions 1) whether to do a bone scan 2) whether to do a ‘CT or MRI’ HLTHINFO 730 – lecture 6 Slide #4
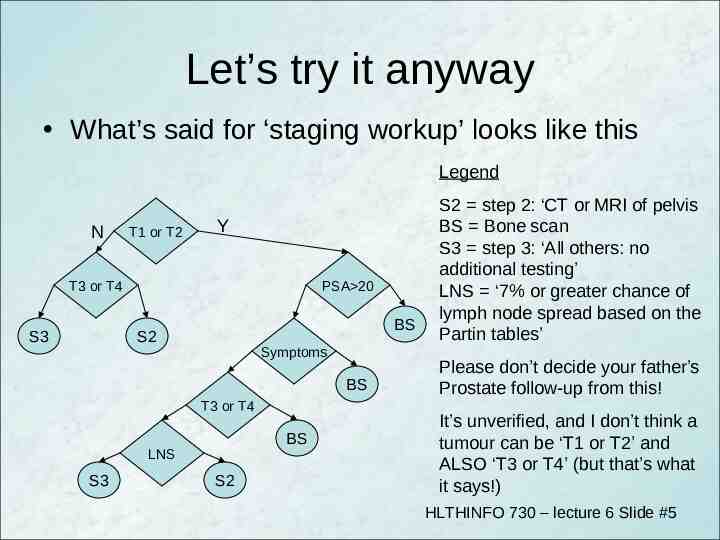
Let’s try it anyway What’s said for ‘staging workup’ looks like this Legend N T1 or T2 Y T3 or T4 S3 PSA 20 BS S2 Symptoms BS T3 or T4 BS LNS S3 S2 S2 step 2: ‘CT or MRI of pelvis BS Bone scan S3 step 3: ‘All others: no additional testing’ LNS ‘7% or greater chance of lymph node spread based on the Partin tables’ Please don’t decide your father’s Prostate follow-up from this! It’s unverified, and I don’t think a tumour can be ‘T1 or T2’ and ALSO ‘T3 or T4’ (but that’s what it says!) HLTHINFO 730 – lecture 6 Slide #5
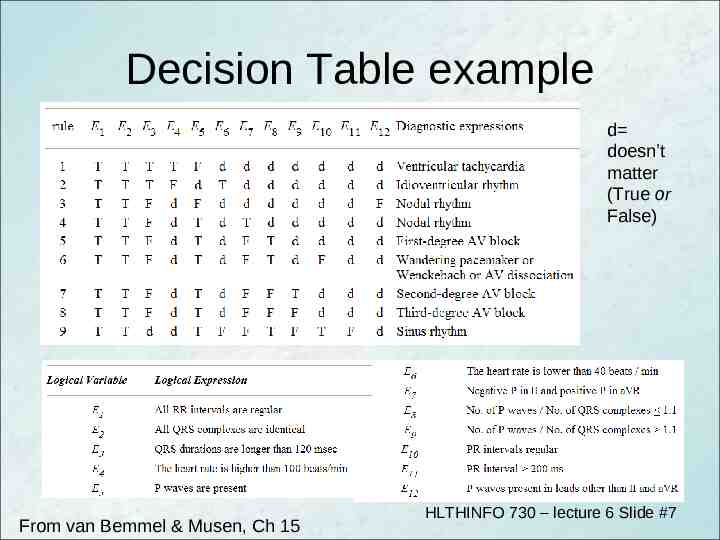
Decision Tables As you can see from the Prostate example, a flowchart can get huge – We can pack more into a smaller space if we relinquish some control on indicating the order of microdecisions A decision table has – One row per ‘rule’ – One column per decision variable – An additional column for the decision to take when that rule evaluates to true HLTHINFO 730 – lecture 6 Slide #6
Decision Table example d doesn’t matter (True or False) From van Bemmel & Musen, Ch 15 HLTHINFO 730 – lecture 6 Slide #7
Flowcharts v. Tables Decision table is not as natural as a flowchart – But we’ve seen, a ‘real’ (complete and consistent) flowchart ends up very large (or representing a very small decision) Decision table gets us close to production rule representation – Good as design specification to take to an expert system shell Completeness is more evident with a flowchart Decision table could allow for multiple rules to simultaneously evaluate to true – Messy on a flowchart (need multiple charts, or terminals that include every possible combination of decision outcomes) Applying either in practice requires KE in a broad sense – E.g., may need to reformulate the goals of the guideline HLTHINFO 730 – lecture 6 Slide #8
On to production rule systems In a production rule system we have decision-table-like rule, but also the decision outcomes can feed back to the decision variables Evaluating some special decision rule (or rules) is then the goal for the decision process – The other rules are intermediary, and might be part of the explanation of how externally-derived decision variables were used to reach a goal decision The inference engine of the expert system shell chooses how to reach the goal – i.e., with backward chaining, or forward chaining – Possibly with some direction from a User Interface (UI) manager component (e.g., we might group sets of variables for input into forms as a web page) HLTHINFO 730 – lecture 6 Slide #9
Boolean Algebra To formulate flow chart decisions and (especially) decision table rows, can help to have mastered Boolean Algebra Basic operators – NOT – if A was true, NOT A is false – AND – A AND B is only true if both A and B are true – OR – A OR B is true if either A, or B, or both are true (aka inclusive or) This is not the place for a course on Boolean algebra, but a few ideas will help HLTHINFO 730 – lecture 6 Slide #10
Notation Alas there are a lot of ways the operators are written – NOT A might appear as A, A, A′ or A – A AND B might appear as A.B, A·B, A B or simply AB – A OR B might appear as A B or AvB We can use parentheses like in normal algebra – C(A B) means the expression is True if and only if C is true AND either B is true OR C is true (or both) – It’s equivalent to CA CB (C-AND-A or C-AND-B, evaluate AND before OR) – So AND is a bit like multiplication, whereas OR is a bit like addition 1 1 1 1 0 1 (inclusive OR) 1 x 1 1 1 x 0 1 (logical AND) HLTHINFO 730 – lecture 6 Slide #11
Think! If you just keep your head and focus on the meaning in the clinical domain, you can usually find the Boolean expression you need – Be sure to be precise “NOT (x 43)” is “x is NOT GREATER than 43” is “x 43” (get your equals in the right place!) (with this advice, I won’t teach you De Morgan’s Law, truth tables, or Karnaugh maps, but feel free to look them up – they all Google well) HLTHINFO 730 – lecture 6 Slide #12
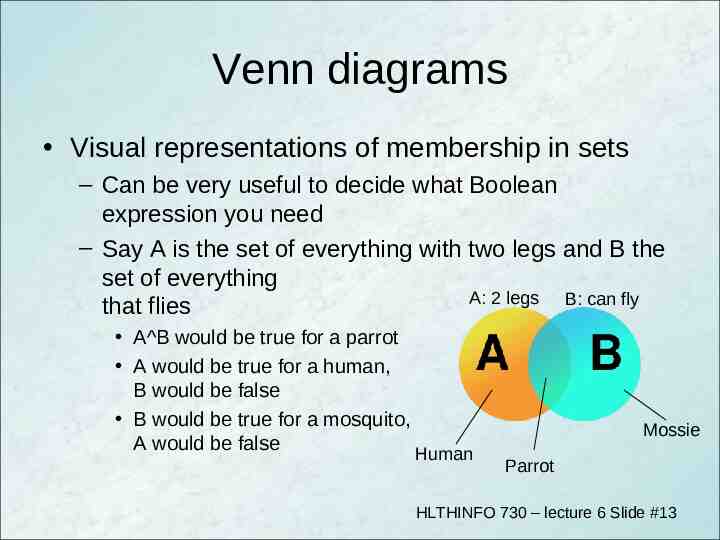
Venn diagrams Visual representations of membership in sets – Can be very useful to decide what Boolean expression you need – Say A is the set of everything with two legs and B the set of everything A: 2 legs B: can fly that flies A B would be true for a parrot A would be true for a human, B would be false B would be true for a mosquito, A would be false Human Mossie Parrot HLTHINFO 730 – lecture 6 Slide #13
Decision Tree Induction An alternative to knowledge engineering a decision tree is to turn the task over to a machine learning algorithm – The decision tree can be ‘induced’ (or inducted) from a sufficiently large set of example The ID3 algorithm is the classic for inducing a decision tree using Information Theory – If I have 50 examples where the patients survived and 50 where they didn’t I have total (1.0) entropy and zero information – Given a set of potential decision attributes I can try to create more order (less entropy, more information) in the data HLTHINFO 730 – lecture 6 Slide #14
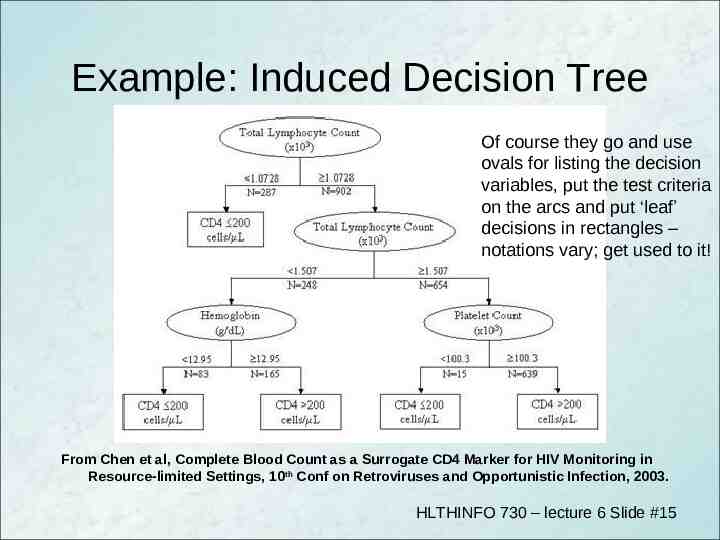
Example: Induced Decision Tree Of course they go and use ovals for listing the decision variables, put the test criteria on the arcs and put ‘leaf’ decisions in rectangles – notations vary; get used to it! From Chen et al, Complete Blood Count as a Surrogate CD4 Marker for HIV Monitoring in Resource-limited Settings, 10th Conf on Retroviruses and Opportunistic Infection, 2003. HLTHINFO 730 – lecture 6 Slide #15
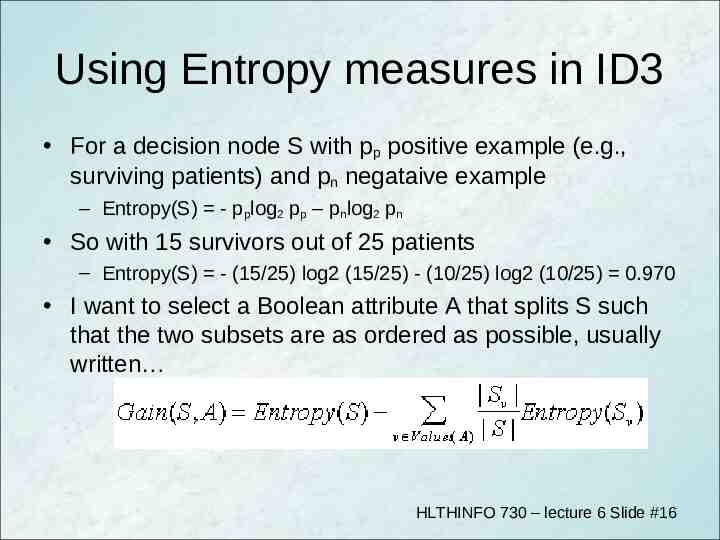
Using Entropy measures in ID3 For a decision node S with pp positive example (e.g., surviving patients) and pn negataive example – Entropy(S) - pplog2 pp – pnlog2 pn So with 15 survivors out of 25 patients – Entropy(S) - (15/25) log2 (15/25) - (10/25) log2 (10/25) 0.970 I want to select a Boolean attribute A that splits S such that the two subsets are as ordered as possible, usually written HLTHINFO 730 – lecture 6 Slide #16
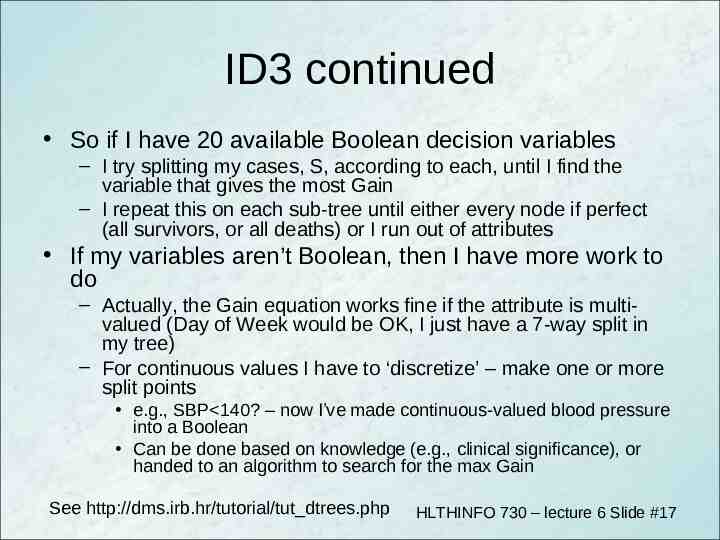
ID3 continued So if I have 20 available Boolean decision variables – I try splitting my cases, S, according to each, until I find the variable that gives the most Gain – I repeat this on each sub-tree until either every node if perfect (all survivors, or all deaths) or I run out of attributes If my variables aren’t Boolean, then I have more work to do – Actually, the Gain equation works fine if the attribute is multivalued (Day of Week would be OK, I just have a 7-way split in my tree) – For continuous values I have to ‘discretize’ – make one or more split points e.g., SBP 140? – now I’ve made continuous-valued blood pressure into a Boolean Can be done based on knowledge (e.g., clinical significance), or handed to an algorithm to search for the max Gain See http://dms.irb.hr/tutorial/tut dtrees.php HLTHINFO 730 – lecture 6 Slide #17
Tools You don’t find ‘pure’ ID3 too much – Other algorithms in a similar spirit to search for are C4.5 and Adaboost Tools – Matlab implements decision tree induction – Weka toolkit (from Waikato Uni) has a variety of Java tools for machine learning – Try Pierre Geurts’ online decision tree induction applet, e.g., for ‘animal descriptions’ from http://www.montefiore.ulg.ac.be/ geurts/dtapplet/dtexplication.html#online HLTHINFO 730 – lecture 6 Slide #18
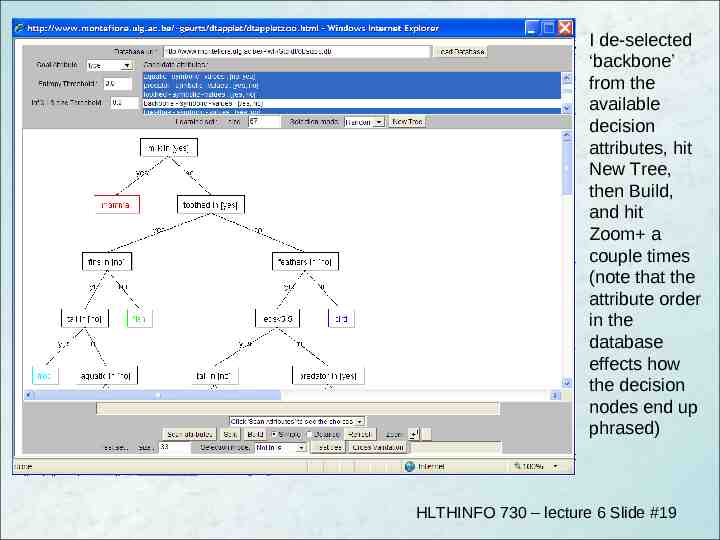
I de-selected ‘backbone’ from the available decision attributes, hit New Tree, then Build, and hit Zoom a couple times (note that the attribute order in the database effects how the decision nodes end up phrased) HLTHINFO 730 – lecture 6 Slide #19
Summary Decision trees are a basic design-level knowledge representation technique for ‘logical’ (rule based, Boolean-predicate-driven) decisions Decision tables let you compactly compile a host of decisions on a fixed set of decision variables – These take you very close to the representation needed to encode production rules for an inference engine Rule induction from data provides an alternative to conventional Knowledge Engineering – Computer figures out rules that fit past decisions instead of you pursuing experts to ask them what rules they use HLTHINFO 730 – lecture 6 Slide #20