Energy Unit Unit #7: Enthalpy, PE diagrams, Phase Changes, IMF,
11 Slides1.30 MB
Energy Unit Unit #7: Enthalpy, PE diagrams, Phase Changes, IMF, BP Curves, Specific heat, Latent heat, Heating/cooling curves
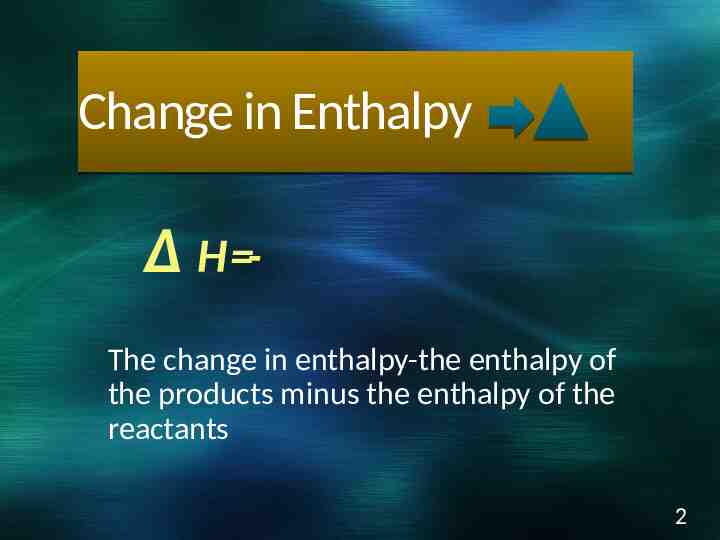
Change in Enthalpy Δ H The change in enthalpy-the enthalpy of the products minus the enthalpy of the reactants 2
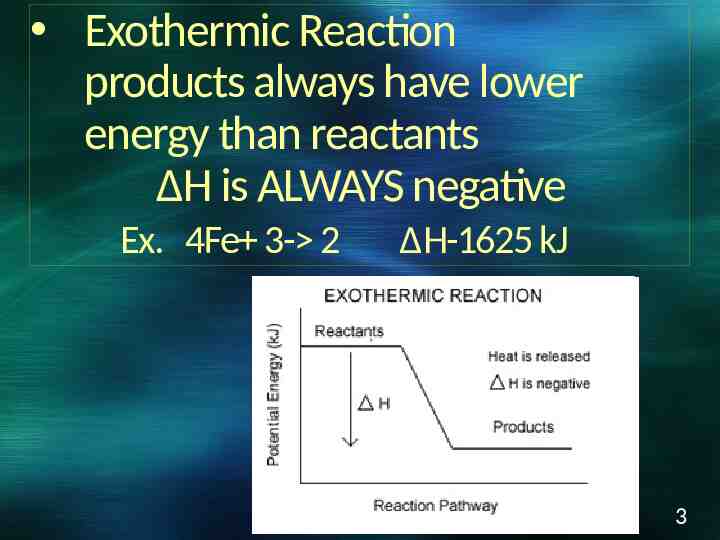
Exothermic Reaction products always have lower energy than reactants ΔH is ALWAYS negative Ex. 4Fe 3- 2 ΔH-1625 kJ 3
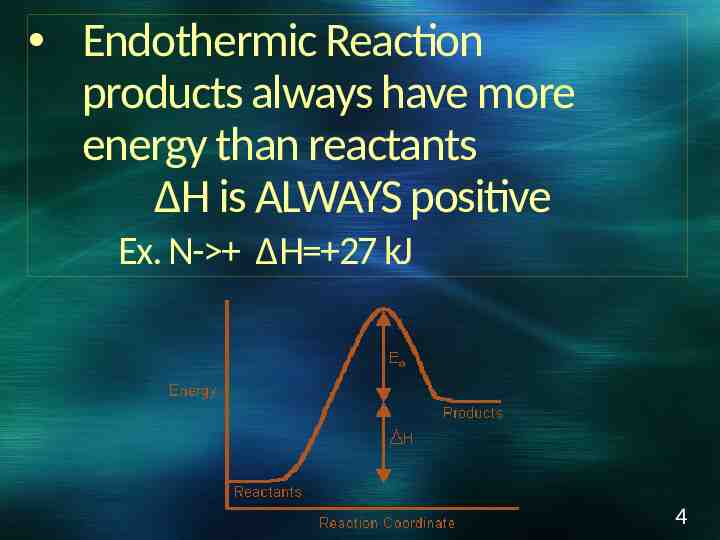
Endothermic Reaction products always have more energy than reactants ΔH is ALWAYS positive Ex. N- ΔH 27 kJ 4
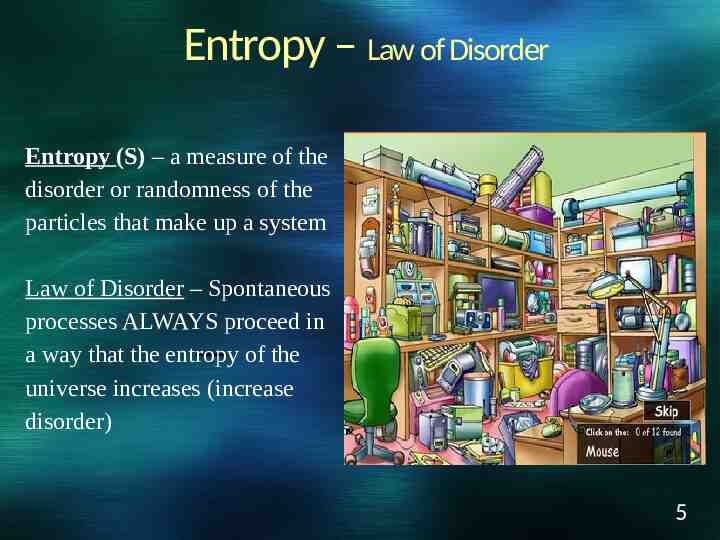
Entropy – Law of Disorder Entropy (S) – a measure of the disorder or randomness of the particles that make up a system Law of Disorder – Spontaneous processes ALWAYS proceed in a way that the entropy of the universe increases (increase disorder) 5
Entropy (cont.) Entropy changes associated with state of matter: Solids – molecules are tightly packed and cannot move (more order) Liquids – molecules have some freedom to move (some order) Gas – unrestricted movements (very little order) Entropy increases as a substance changes from solid liquid gas 6
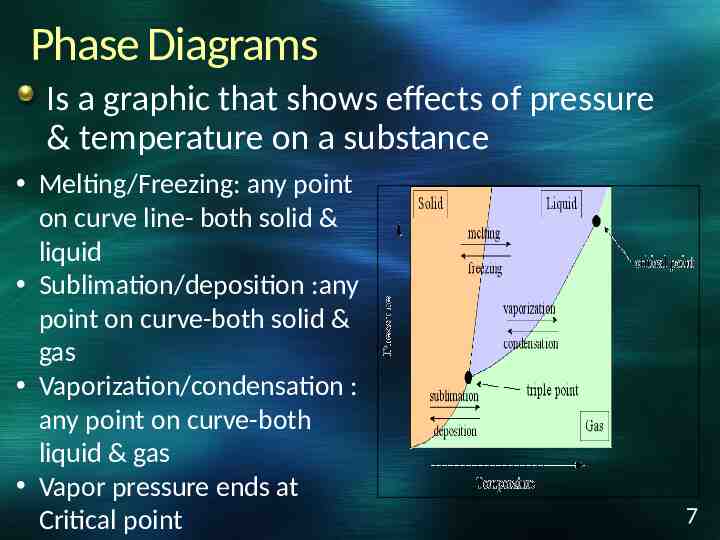
Phase Diagrams Is a graphic that shows effects of pressure & temperature on a substance Melting/Freezing: any point on curve line- both solid & liquid Sublimation/deposition :any point on curve-both solid & gas Vaporization/condensation : any point on curve-both liquid & gas Vapor pressure ends at Critical point 7
Phase diagrams (cont.) Critical Point- the temperature above which the gas CANNOT be liquefied Critical point is called a supercritical fluid- not distinguishable between gas/liquid 8
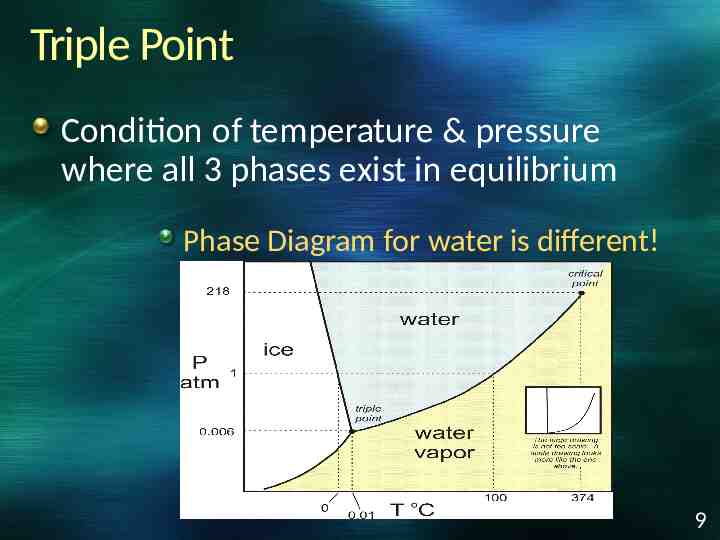
Triple Point Condition of temperature & pressure where all 3 phases exist in equilibrium Phase Diagram for water is different! 9
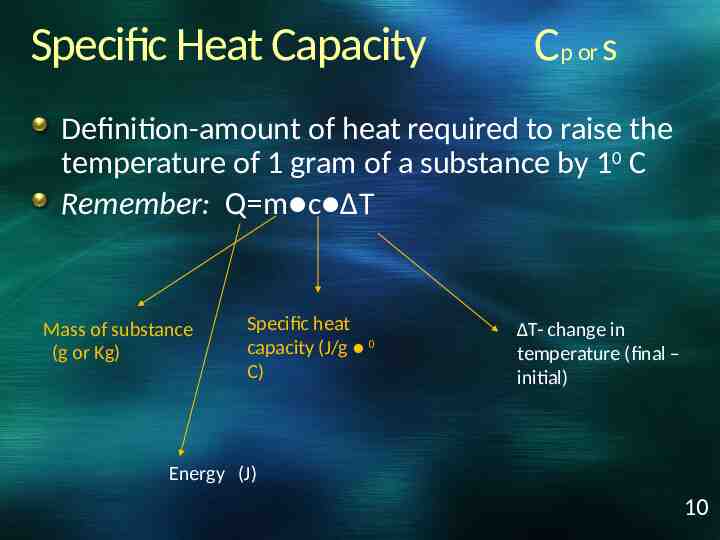
Specific Heat Capacity Cp or s Definition-amount of heat required to raise the temperature of 1 gram of a substance by 10 C Remember: Q m c ΔT Mass of substance (g or Kg) Specific heat capacity (J/g 0 C) ΔT- change in temperature (final – initial) Energy (J) 10
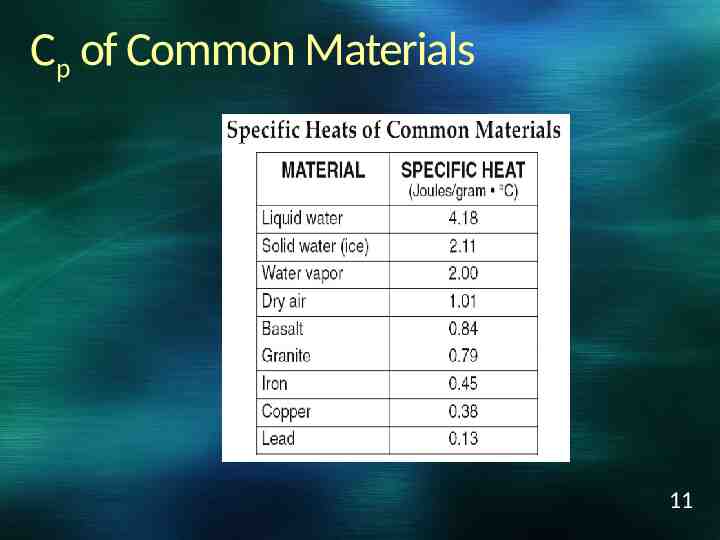
Cp of Common Materials 11