Electrochemistry Introduction This presentation will introduce:

8 Slides357.78 KB
Electrochemistry Introduction This presentation will introduce: - Cyclic Voltammetry - Current vs potential graphs (cyclic voltammograms) - Randles-Sevcik equation - Potential step experiments and the Cottrell equation - How to use the potentiostat software
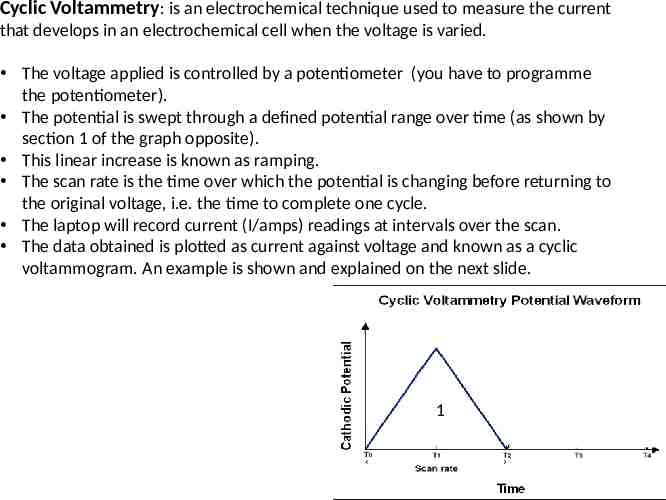
Cyclic Voltammetry: is an electrochemical technique used to measure the current that develops in an electrochemical cell when the voltage is varied. The voltage applied is controlled by a potentiometer (you have to programme the potentiometer). The potential is swept through a defined potential range over time (as shown by section 1 of the graph opposite). This linear increase is known as ramping. The scan rate is the time over which the potential is changing before returning to the original voltage, i.e. the time to complete one cycle. The laptop will record current (I/amps) readings at intervals over the scan. The data obtained is plotted as current against voltage and known as a cyclic voltammogram. An example is shown and explained on the next slide. 1
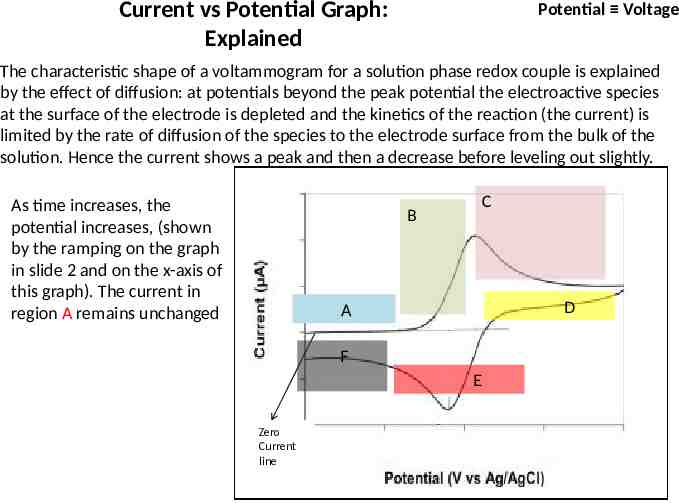
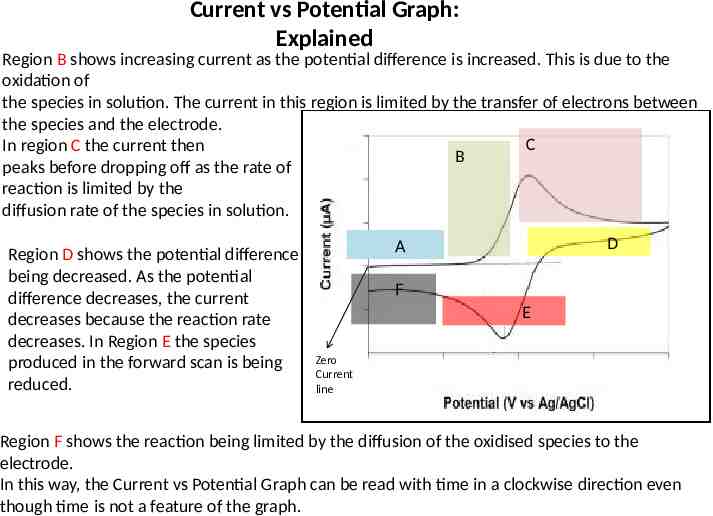
Current vs Potential Graph: Explained Potential Voltage The characteristic shape of a voltammogram for a solution phase redox couple is explained by the effect of diffusion: at potentials beyond the peak potential the electroactive species at the surface of the electrode is depleted and the kinetics of the reaction (the current) is limited by the rate of diffusion of the species to the electrode surface from the bulk of the solution. Hence the current shows a peak and then a decrease before leveling out slightly. As time increases, the potential increases, (shown by the ramping on the graph in slide 2 and on the x-axis of this graph). The current in region A remains unchanged C B D A F E Zero Current line
Current vs Potential Graph: Explained Region B shows increasing current as the potential difference is increased. This is due to the oxidation of the species in solution. The current in this region is limited by the transfer of electrons between the species and the electrode. C In region C the current then B peaks before dropping off as the rate of reaction is limited by the diffusion rate of the species in solution. Region D shows the potential difference being decreased. As the potential difference decreases, the current decreases because the reaction rate decreases. In Region E the species produced in the forward scan is being reduced. D A F E Zero Current line Region F shows the reaction being limited by the diffusion of the oxidised species to the electrode. In this way, the Current vs Potential Graph can be read with time in a clockwise direction even though time is not a feature of the graph.
Current vs Potential Graph: Uses The graph can be used to determine the number of moles (of copper in this case) that are reduced/oxidised at the electrode during the reaction. Find the area under the curve of the cyclic voltammogram (CV) Divide the area by the scan rate this will give the charge (Q/As) that is associated with the electron transfer in a reaction. The charge is then directly related to the number of moles by the equation: Q nFm where: Q is the charge (C) n is the number of electrons transferred in the reaction F the Faraday constant (96485 C mol-1) m the number of moles (mol) Remember 1 Coulomb is 1 Amp second C As
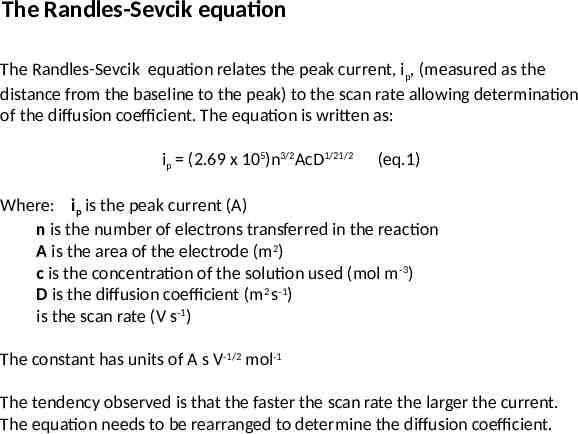
The Randles-Sevcik equation The Randles-Sevcik equation relates the peak current, ip, (measured as the distance from the baseline to the peak) to the scan rate allowing determination of the diffusion coefficient. The equation is written as: ip (2.69 x 10⁵)n3/2AcD1/21/2 (eq.1) Where: ip is the peak current (A) n is the number of electrons transferred in the reaction A is the area of the electrode (m2) c is the concentration of the solution used (mol m-3) D is the diffusion coefficient (m2 s-1) is the scan rate (V s-1) The constant has units of A s V-1/2 mol-1 The tendency observed is that the faster the scan rate the larger the current. The equation needs to be rearranged to determine the diffusion coefficient.
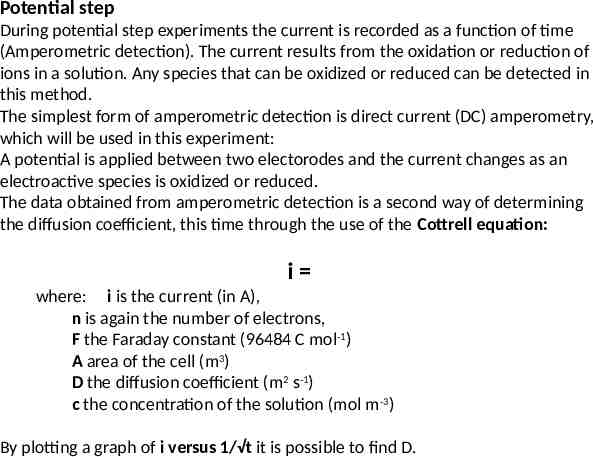
Potential step During potential step experiments the current is recorded as a function of time (Amperometric detection). The current results from the oxidation or reduction of ions in a solution. Any species that can be oxidized or reduced can be detected in this method. The simplest form of amperometric detection is direct current (DC) amperometry, which will be used in this experiment: A potential is applied between two electorodes and the current changes as an electroactive species is oxidized or reduced. The data obtained from amperometric detection is a second way of determining the diffusion coefficient, this time through the use of the Cottrell equation: i where: i is the current (in A), n is again the number of electrons, F the Faraday constant (96484 C mol-1) A area of the cell (m3) D the diffusion coefficient (m2 s-1) c the concentration of the solution (mol m-3) By plotting a graph of i versus 1/ t it is possible to find D.
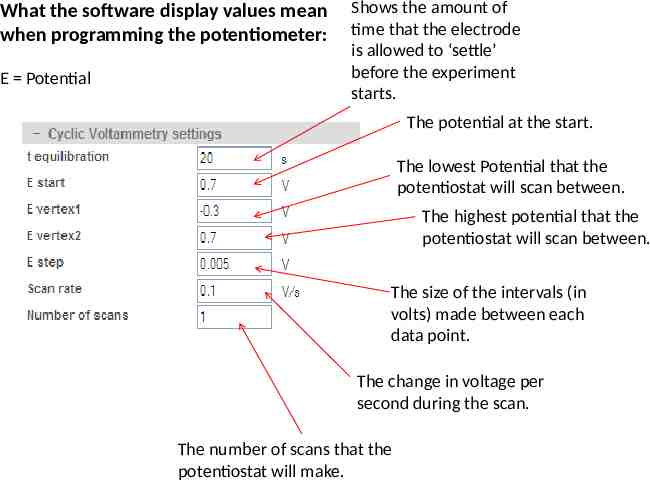
What the software display values mean when programming the potentiometer: E Potential Shows the amount of time that the electrode is allowed to ‘settle’ before the experiment starts. The potential at the start. The lowest Potential that the potentiostat will scan between. The highest potential that the potentiostat will scan between. The size of the intervals (in volts) made between each data point. The change in voltage per second during the scan. The number of scans that the potentiostat will make.