Eco 6380 Predictive Analytics For Economists Spring 2016 Professor


18 Slides374.50 KB
Eco 6380 Predictive Analytics For Economists Spring 2016 Professor Tom Fomby Department of Economics SMU
Presentation 17 Cluster Analysis Chapter 14 in SPB
First go read the pdf file “Cluster Analysis v3.pdf” on the Class Website for a detailed discussion of Cluster Methods and an illustrative example of the method. In this PowerPoint we only provide a set of short notes on Cluster Analysis.
Main Points Cluster Analysis is an unsupervised learning method. It doesn’t involve prediction or classification. Clustering is based on assigning vector observations, say, into distinct groups for the purpose of description and later action. Clustering of a company’s customer base is often used to conduct “customer segmentation” for purposes of specializing advertising and customer incentive programs and practicing differential pricing of products by customer segments (groups). In the latter example, differential pricing is nothing more than practicing price discrimination based upon the different elasticities of demand across customer groups. Cluster Analysis is an “Art Form.” It must be practiced with care. The more experience you have in doing cluster analysis, the better you are as a practitioner. Normalization of data before proceeding to do cluster analysis is recommended. Cluster Analysis involving variables with very different scales of measurement can lead to clusters that are not robust to adding or deleting variables or observations. Two Basic Approaches to Clustering: a) Hierarchical Clustering (Agglomerative and Divisive approaches) b) Non-hierarchical Clustering (K-means)
TWO Distinct Clustering Approaches Two Basic Approaches for Doing Clustering: Hierarchical Clustering Non-Hierarchical Clustering Hierarchical Clustering – final clusters are built following a distinct set of sequential steps Non-Hierarchical Clustering – Clusters are built in such a way that if M clusters are built there is no guarantee that putting together two of the clusters would give rise to the same (M-1) clusters built separately by the method.
Hierarchical Clustering: Two ways of building hierarchical clusters – Agglomerative versus Divisive Approaches. The Agglomerative Approach starts with each case making up its own cluster and then forming more and more aggregative clusters one step at a time. The Divisive approach starts with all cases in one cluster and then breaks this comprehensive cluster into a succession of smaller and smaller clusters.
Steps in Agglomerative Clustering Start with n clusters (each observation cluster) The two “closest” observations are merged into one cluster. At every step, the two clusters that are “closest” to each other are merged. That is, either single observations are added to existing clusters or two existing clusters are merged. This process continues until all observations are merged into one cluster. A graph called the Dendrogram summarizes this process. The next slide presents a Dendrogram based on Average Linkage Distance applied to the Utilities.xls data set. This is a tree-like diagram that summarizes the process of clustering. For any given number of clusters we can determine the records in the clusters by sliding a horizontal line (ruler) up and down the Dendrogram until the number of vertical intersections of the horizontal line equals the number of clusters desired.
The Dendrogram of Hierarchical Clustering Dendrogram(Average linkage) 5 22000 4.5 4 3.5 Distance 3 2.5 2 1.5 1 0.5 0 0 1 1 18 2 14 3 19 4 6 5 3 6 9 7 2 8 22 9 4 10 20 11 10 12 13 13 7 14 12 15 21 16 15 17 17 18 5 19 8 20 16 21 11 22 0 23
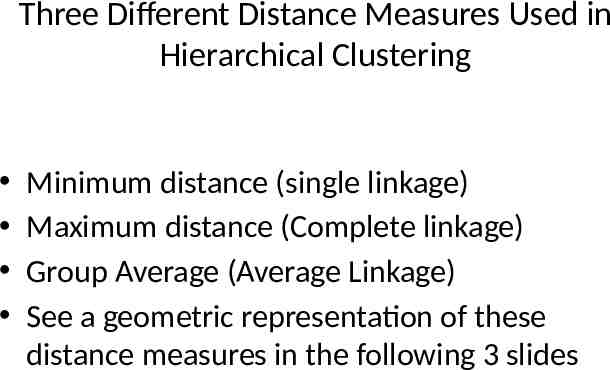
Three Different Distance Measures Used in Hierarchical Clustering Minimum distance (single linkage) Maximum distance (Complete linkage) Group Average (Average Linkage) See a geometric representation of these distance measures in the following 3 slides
Minimum Distance (Single Linkage)
Maximum Distance (Complete Linkage)
Group Average (Average Linkage)
Limitations of Hierarchical Clustering Dendrograms are most useful when there a small number of observations (cases) to cluster. The Agglomerative procedure works for larger data sets but is computing intensive in that (nxn) matrices are the basic building blocks for the Agglomerative procedure. Hierarchical Clustering only makes one pass through the data. Therefore, early clustering decisions affect the rest of the clustering results. Hierarchical Clusters often have low stability. That is, adding or subtracting variables or adding or dropping observations can affect the groupings substantially. The determination of final clusters can be sensitive to outliers and their treatment.
K-Means Clustering (Non-Hierarchical Clustering) K-Means Clustering is a non-hierarchical method in the sense that if one has 2 clusters, say, generated by pre-specifying 2 means (centroids) in the K-means algorithm and 3 clusters generated by pre-specifying 3 means in the K-means algorithm, then it may be the case that no combination of any two clusters of the 3 cluster group can give rise to the 2 cluster grouping.
Steps in the K-Means Clustering Approach Given a set of observations where each observation is a ddimensional real vector, then K-means clustering aims to partition the n observations into K sets (K n), so as to minimize the withincluster sum of squares (WCSS): (1) where is the mean of the points in . Now minimizing (1) can, in theory, be done by the integer programming method but this can be extremely time-consuming. Instead the Lloyd algorithm is more often used.
Lloyd Algorithm The steps of the Lloyd algorithm are as follows. Given the initial set of K-means which can be specified randomly or by some heuristic, the algorithm proceeds by alternating between two steps: Assignment Step: Assign each observation to the cluster with the closest mean for all . (2) Update Step: Calculate the new means to be the centroids of the observations in the clusters, i.e. for . (3) Repeat the Assignment and Update steps until WCSS (equation (1)) no longer changes. Then the centroids and members of the K clusters are determined. Note: When using random assignment of the K-means to start the algorithm, one might try several starting point K-means and then choose the “best” starting point to be the random Kmeans that produces the smallest WCSS among all of the random starting points tried in the K-means procedure. Regardless of the clustering technique used, one should strive to choose clusters that are interpretable and make sense given the domain-specific knowledge that we have about the problem at hand.
Review Utilities.xls data for Practice with Clustering Methods
Classroom Exercise: Exercise 13