Developing Performance Measures at UCEDD: Moving Forward with The
97 Slides1.20 MB
Developing Performance Measures at UCEDD: Moving Forward with The Logic Model
Contact Information Jon Desenberg Director Consulting Services, Performance Management The Performance Institute 1515 North Courthouse Road, Suite 600 Arlington, VA 22201 Phone: 703-894-0481 - Fax: 703-894-0482 www.performanceweb.org [email protected]
Measuring Performance for Results If you don’t know where you are going, any road will get you there. –Lewis Carroll
Why measure? To Plan? To Comply? To Manage? To Optimize? To Innovate? What gets measured gets done. –Peter Drucker
Performance is not about mandates, it’s about management PERFORMANCE MEASURES ALLOW YOU TO: STRATEGIZE COMMUNICATE MOTIVATE MANAGE
Long-Term Move Towards Performance Performance management is not a new phenomenon—50 years of work in the making to link resources with results – Budget Accounting Procedures Act (BAPA) of 1950 – Planning-Programming-Budgeting System (PPBS), 1965-1971 – Management by Objectives (MBO) 1973-1974 – Zero-Based Budgeting (ZBB), 1977-1981
Finally a Move in the Right Direction GPRA—(1993) Government Performance Results Act PMA—(2001) President’s Management Agenda PART—(2002) Program Assessment Rating Tool Mandates focusing on performance and accountability—bottom line results
Program Assessment Rating Tool (PART) OMB Tool to Evaluate Effectiveness of Program Performance in Budget Submissions for Individual Programs Designed to evaluate 20% of programs per fiscal year Methodological Standardized Evidence-based and Transparent Consistent with Government Performance Results Act (GPRA), 1993
Four Sections of PART Program Relevance Mission and purpose of program Program Planning Focus on program’s strategic objectives Program Management Stewardship by front-line managers Program Results Program accountability to strategic objectives
PART Categories Competitive Grant Programs Block/Formula Grant Programs Regulatory-Based Programs Capital Assets and Service Acquisition Programs Credit Programs Research and Development Programs Direct Federal Programs
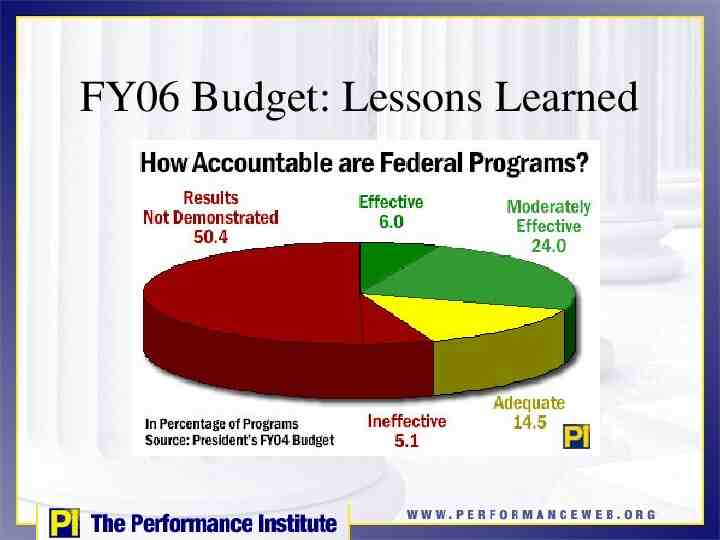
FY06 Budget: Lessons Learned
Lessons Learned Root Cause of Failure: Poor Plans, Bad Measures, Weak Management – Lack of meaningful, results-oriented performance measures – Failure to address management deficiencies identified by GAO, IG’s, et al. – Ill-defined, conflicting, duplicative program purpose
Lessons Learned Causes for Success – Good alignment towards Performance Plans – Effective management of strategic plans – Strong linkage between successful implementation of strategic goals
Making the Grade: OMB’s weighting for each section Section One: 20% Section Two: 10% Section Three: 20% Section Four: 50%
Section One: Relevance Clear agency mission Unique contribution Specific interest, problem or need Optimally Designed to address specifics
Section Two: Planning Long-Term Performance Goals Annual Performance Goals Stakeholder Dialogue Budget-Performance Integration
Section Three: Management Collection of timely, credible performance information Manager Accountability Strict allocation of funds Budget-Performance Integration
Section Four: Program Results Demonstrable progress towards goals Achievement of annual goals Improvement in efficiencies and cost effectiveness Favorable performance to comprable programs
Performance Measurement Issues: Manageable by PART Outcomes are extremely difficult to measure Are among many contributors to a desired outcome Have results that will not be achieved for many years Relate to deterrence or prevention of specific behaviors Have multiple purposes and funding that can be used for a range of activities Are administrative or process oriented
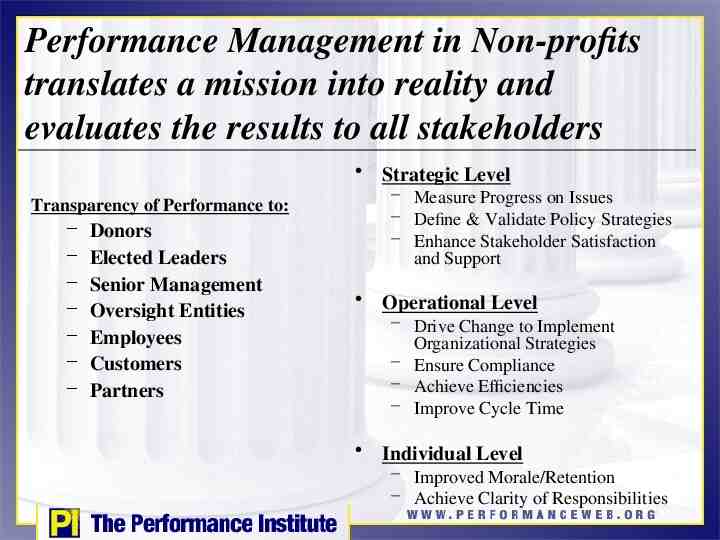
Performance Management in Non-profits translates a mission into reality and evaluates the results to all stakeholders Strategic Level Transparency of Performance to: – – – – – – – Donors Elected Leaders Senior Management Oversight Entities Employees Customers Partners – Measure Progress on Issues – Define & Validate Policy Strategies – Enhance Stakeholder Satisfaction and Support Operational Level – Drive Change to Implement Organizational Strategies – Ensure Compliance – Achieve Efficiencies – Improve Cycle Time Individual Level – Improved Morale/Retention – Achieve Clarity of Responsibilities
Effective Performance Measures are SMART S PECIFIC M EASUREABLE A CCOUNTABLE R ESULTS-ORIENTED (#1) T IME-BOUND
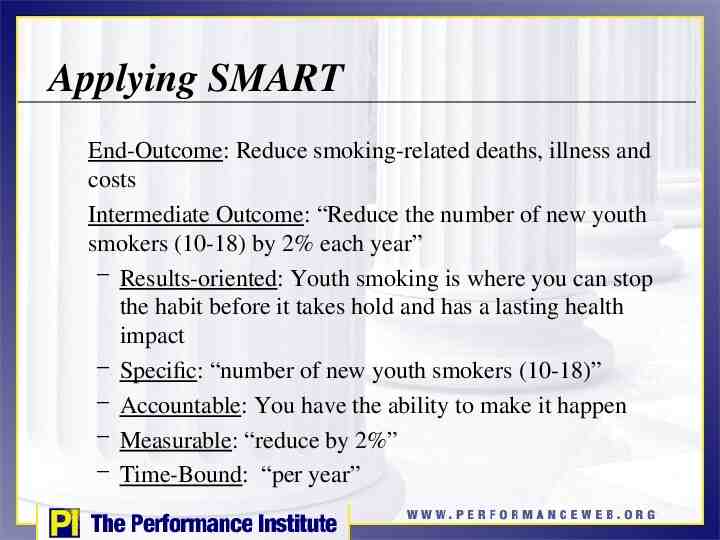
Applying SMART End-Outcome: Reduce smoking-related deaths, illness and costs Intermediate Outcome: “Reduce the number of new youth smokers (10-18) by 2% each year” – Results-oriented: Youth smoking is where you can stop the habit before it takes hold and has a lasting health impact – Specific: “number of new youth smokers (10-18)” – Accountable: You have the ability to make it happen – Measurable: “reduce by 2%” – Time-Bound: “per year”
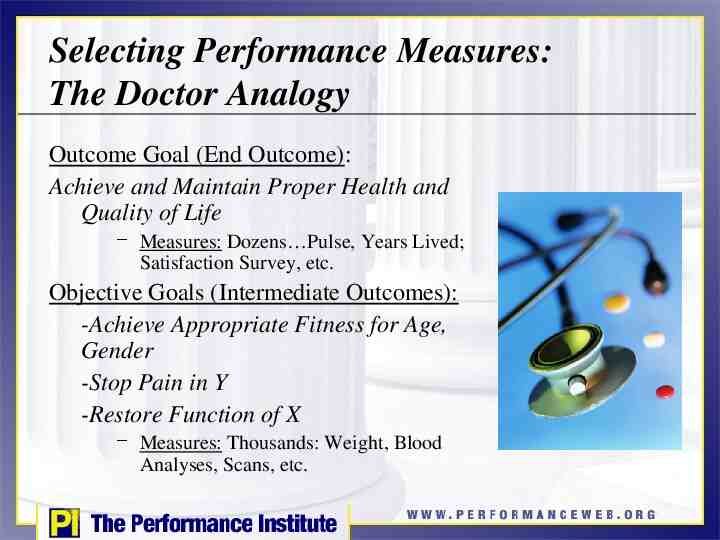
Selecting Performance Measures: The Doctor Analogy Outcome Goal (End Outcome): Achieve and Maintain Proper Health and Quality of Life – Measures: Dozens Pulse, Years Lived; Satisfaction Survey, etc. Objective Goals (Intermediate Outcomes): -Achieve Appropriate Fitness for Age, Gender -Stop Pain in Y -Restore Function of X – Measures: Thousands: Weight, Blood Analyses, Scans, etc.
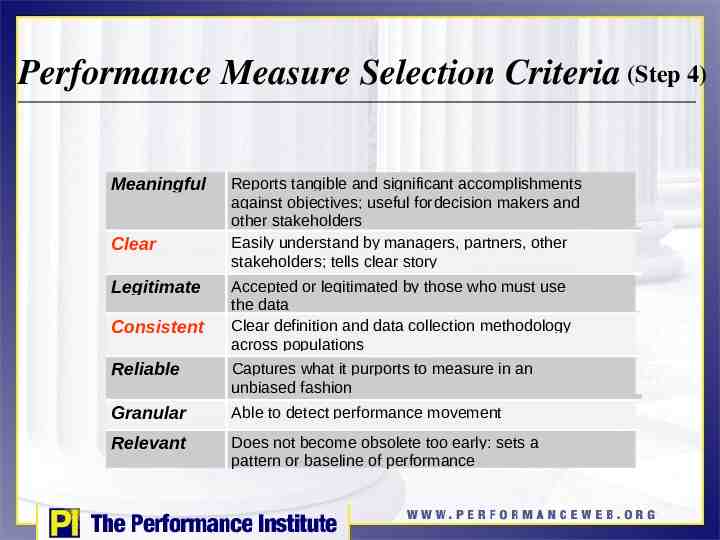
Performance Measure Selection Criteria (Step 4) Meaningful Clear Legitimate Consistent Reports tangible and significant accomplishments against objectives; useful for decision makers and other stakeholders Easily understand by managers, partners, other stakeholders; tells clear story Accepted or legitimated by those who must use the data Clear definition and data collection methodology across populations Reliable Captures what it purports to measure in an unbiased fashion Granular Able to detect performance movement Relevant Does not become obsolete too early: sets a pattern or baseline of performance
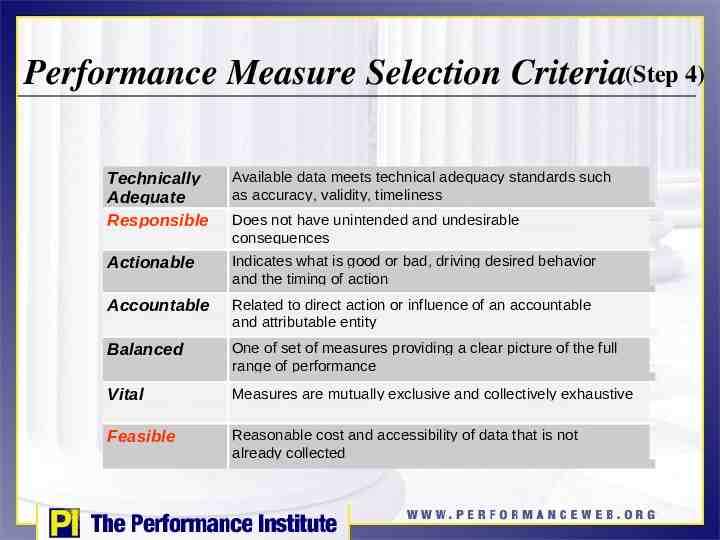
Performance Measure Selection Criteria(Step 4) Technically Adequate Responsible Available data meets technical adequacy standards such as accuracy, validity, timeliness Actionable Indicates what is good or bad, driving desired behavior and the timing of action Accountable Related to direct action or influence of an accountable and attributable entity Balanced One of set of measures providing a clear picture of the full range of performance Vital Measures are mutually exclusive and collectively exhaustive Feasible Reasonable cost and accessibility of data that is not already collected Does not have unintended and undesirable consequences
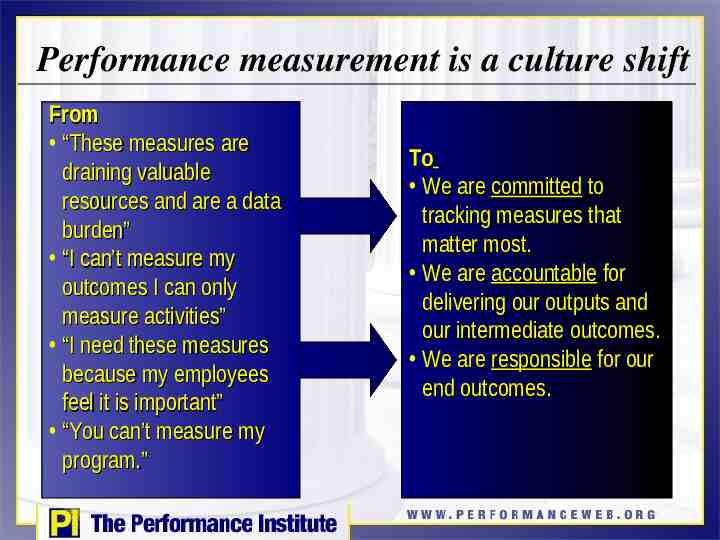
Performance measurement is a culture shift From “These measures are draining valuable resources and are a data burden” “I can’t measure my outcomes I can only measure activities” “I need these measures because my employees feel it is important” “You can’t measure my program.” To We are committed to tracking measures that matter most. We are accountable for delivering our outputs and our intermediate outcomes. We are responsible for our end outcomes.
Identifying Characteristics of Effective Performance Management Systems
8 Critical Success Factors for Effective Performance Management Systems 1. Defining and Aligning to Enterprise Strategy 2. Developing Meaningful Performance Measures 3. Increasing Data Availability 4. Maximizing Data Integrity 5. Enhancing Performance Reporting 6. Improving Evaluation and Analysis 7. Achieving Performance Integration 8. Driving Decision-Making
#1 Defining and Aligning to Enterprise Strategy 1.1 Has clearly defined its mission, vision and values 1.2 Has specific strategies in place to achieve organizational results (based on a SWOT or other landscape analysis) strategic 1.3 All structures (divisions, support functions) are fully aligned with enterprise-wide strategies 1.4 A formal strategic plan is clearly communicated to all employees at all levels of the organization Survey Questions: 1, 2, 3, 4
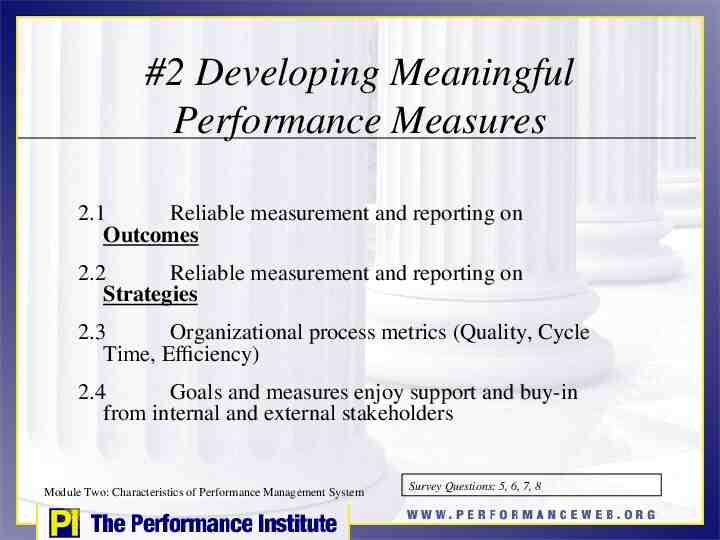
#2 Developing Meaningful Performance Measures 2.1 Reliable measurement and reporting on Outcomes 2.2 Reliable measurement and reporting on Strategies 2.3 Organizational process metrics (Quality, Cycle Time, Efficiency) 2.4 Goals and measures enjoy support and buy-in from internal and external stakeholders Module Two: Characteristics of Performance Management System Survey Questions: 5, 6, 7, 8
#3 Increasing Data Availability 3.1 Data sources are identified and readily accessible 3.2 Data burden is worth the information gleaned Module Two: Characteristics of Performance Management System Survey Questions: 9, 10
#4 Maximizing Data Integrity 4.1 Data is collected, managed, and analyzed in a uniform and consistent manner 4.2 Data is validated or verified through sampling or independent means Module Two: Characteristics of Performance Management System PI Management Survey Question: 11, 12
#5 Enhancing Performance Reporting 5.1 Internal reporting produces information for frontline managers and senior decision-makers on a “real time” basis. 5.2 Has a reporting system that produces comprehensive performance reports that include measures, analysis, trends, suggestions for improvement PI Management Survey Questions: 13, 14
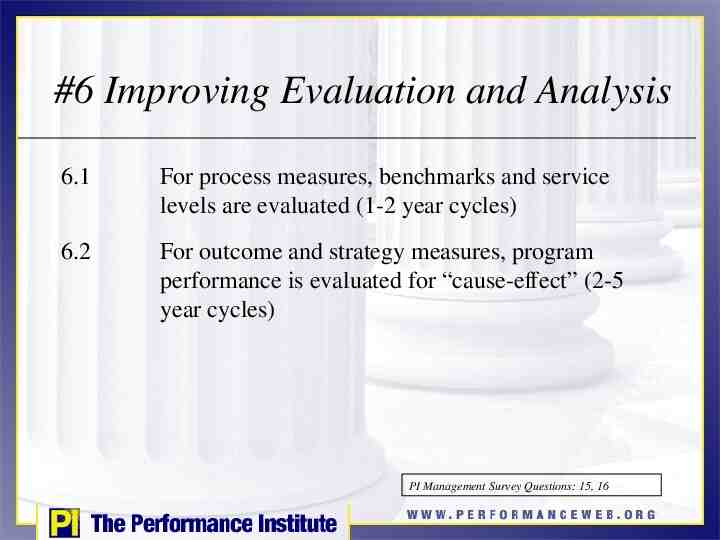
#6 Improving Evaluation and Analysis 6.1 For process measures, benchmarks and service levels are evaluated (1-2 year cycles) 6.2 For outcome and strategy measures, program performance is evaluated for “cause-effect” (2-5 year cycles) PI Management Survey Questions: 15, 16
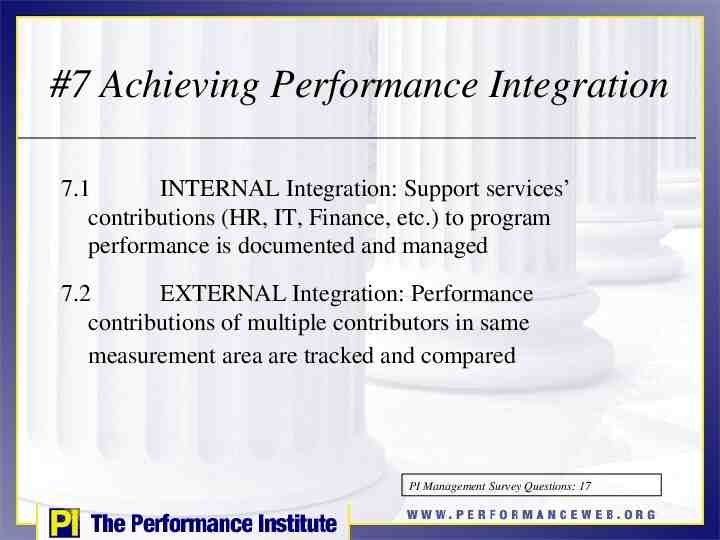
#7 Achieving Performance Integration 7.1 INTERNAL Integration: Support services’ contributions (HR, IT, Finance, etc.) to program performance is documented and managed 7.2 EXTERNAL Integration: Performance contributions of multiple contributors in same measurement area are tracked and compared PI Management Survey Questions: 17
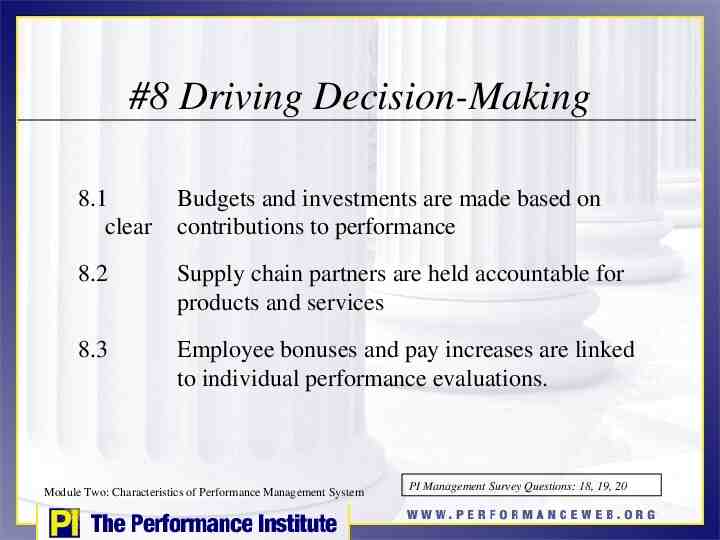
#8 Driving Decision-Making 8.1 clear Budgets and investments are made based on contributions to performance 8.2 Supply chain partners are held accountable for products and services 8.3 Employee bonuses and pay increases are linked to individual performance evaluations. Module Two: Characteristics of Performance Management System PI Management Survey Questions: 18, 19, 20
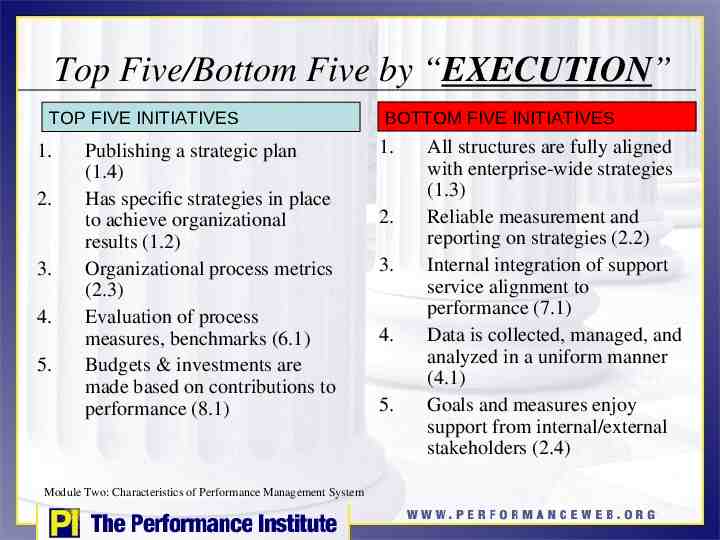
Top Five/Bottom Five by “EXECUTION” TOP FIVE INITIATIVES 1. 2. 3. 4. 5. Publishing a strategic plan (1.4) Has specific strategies in place to achieve organizational results (1.2) Organizational process metrics (2.3) Evaluation of process measures, benchmarks (6.1) Budgets & investments are made based on contributions to performance (8.1) Module Two: Characteristics of Performance Management System BOTTOM FIVE INITIATIVES 1. 2. 3. 4. 5. All structures are fully aligned with enterprise-wide strategies (1.3) Reliable measurement and reporting on strategies (2.2) Internal integration of support service alignment to performance (7.1) Data is collected, managed, and analyzed in a uniform manner (4.1) Goals and measures enjoy support from internal/external stakeholders (2.4)
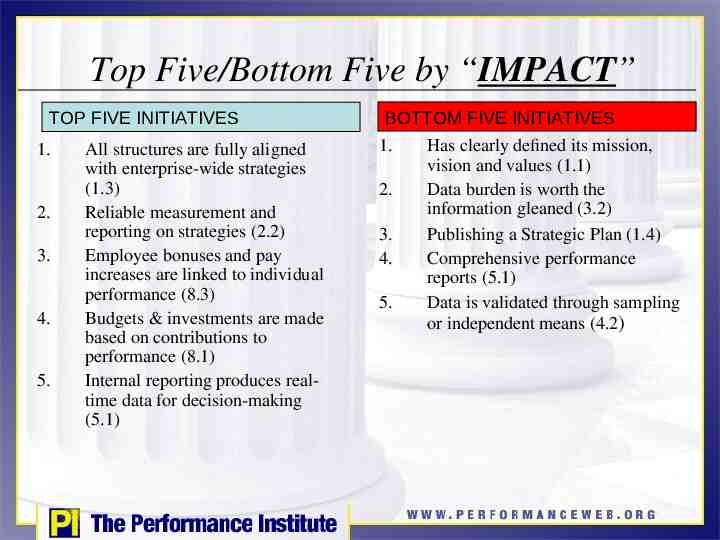
Top Five/Bottom Five by “IMPACT” TOP FIVE INITIATIVES 1. 2. 3. 4. 5. All structures are fully aligned with enterprise-wide strategies (1.3) Reliable measurement and reporting on strategies (2.2) Employee bonuses and pay increases are linked to individual performance (8.3) Budgets & investments are made based on contributions to performance (8.1) Internal reporting produces realtime data for decision-making (5.1) BOTTOM FIVE INITIATIVES 1. 2. 3. 4. 5. Has clearly defined its mission, vision and values (1.1) Data burden is worth the information gleaned (3.2) Publishing a Strategic Plan (1.4) Comprehensive performance reports (5.1) Data is validated through sampling or independent means (4.2)
Module Three Understanding Logic Models
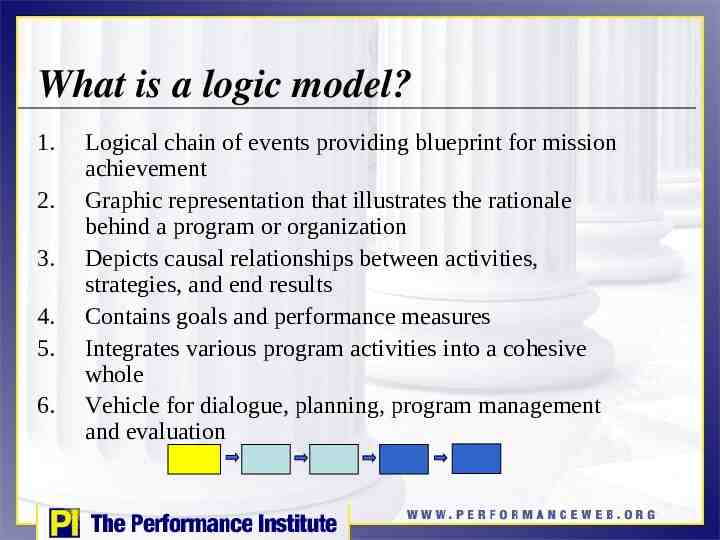
What is a logic model? 1. 2. 3. 4. 5. 6. Logical chain of events providing blueprint for mission achievement Graphic representation that illustrates the rationale behind a program or organization Depicts causal relationships between activities, strategies, and end results Contains goals and performance measures Integrates various program activities into a cohesive whole Vehicle for dialogue, planning, program management and evaluation
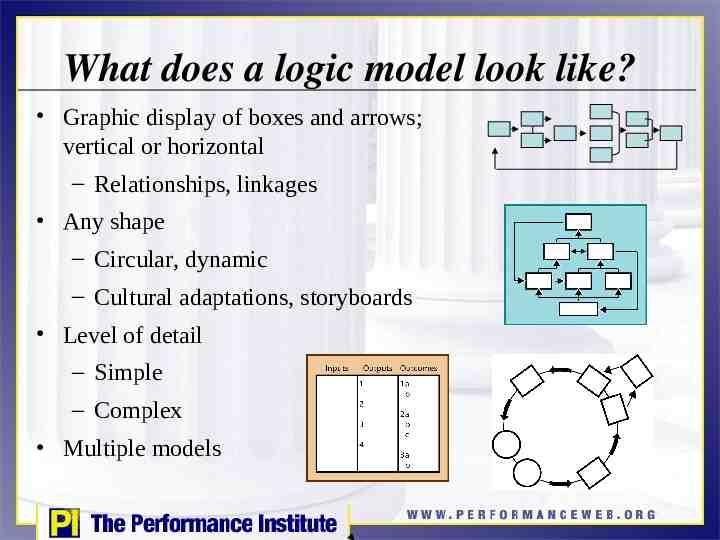
What does a logic model look like? Graphic display of boxes and arrows; vertical or horizontal – Relationships, linkages Any shape – Circular, dynamic – Cultural adaptations, storyboards Level of detail – Simple – Complex Multiple models
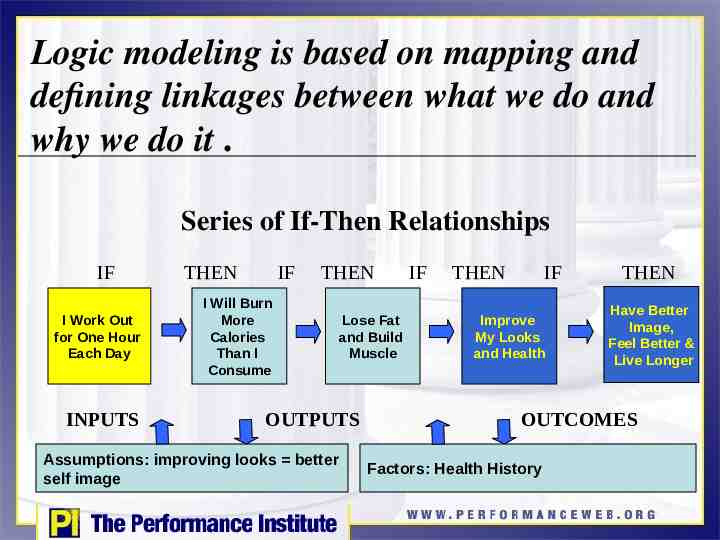
Logic modeling is based on mapping and defining linkages between what we do and why we do it . Series of If-Then Relationships IF I Work Out for One Hour Each Day INPUTS THEN IF THEN I Will Burn More Calories Than I Consume Lose Fat and Build Muscle OUTPUTS Assumptions: improving looks better self image IF THEN IF Improve My Looks and Health THEN Have Better Image, Feel Better & Live Longer OUTCOMES Factors: Health History
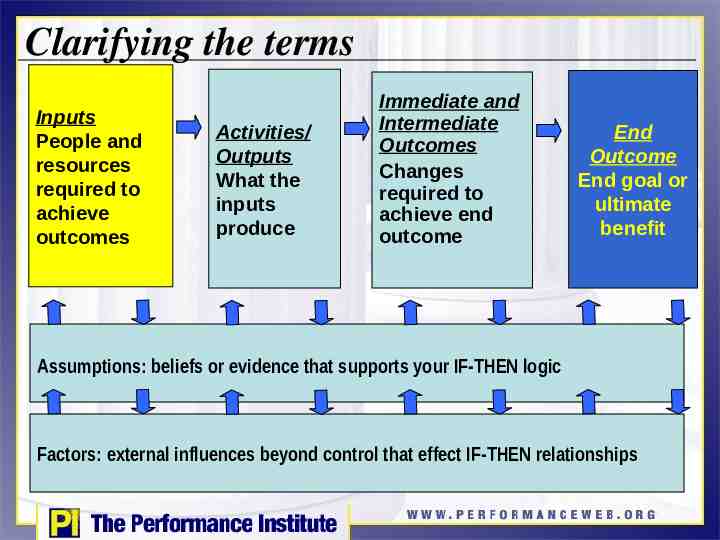
Clarifying the terms Inputs People and resources required to achieve outcomes Activities/ Outputs What the inputs produce Immediate and Intermediate Outcomes Changes required to achieve end outcome End Outcome End goal or ultimate benefit Assumptions: beliefs or evidence that supports your IF-THEN logic Factors: external influences beyond control that effect IF-THEN relationships
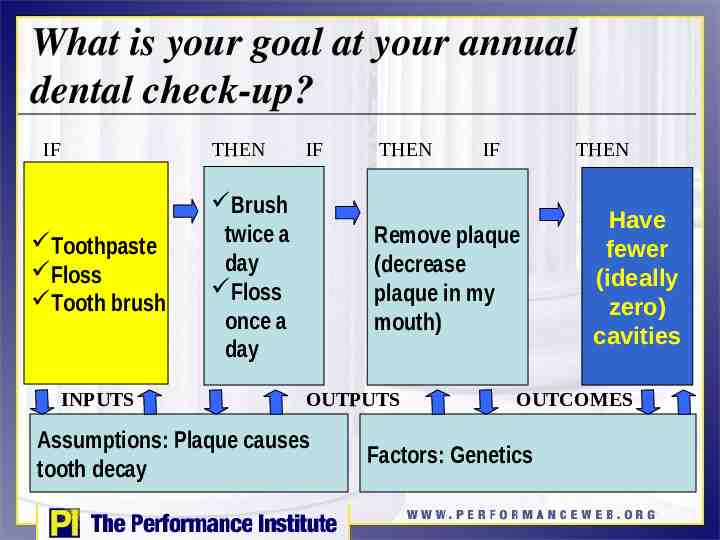
What is your goal at your annual dental check-up? IF THEN Toothpaste Floss Tooth brush INPUTS IF Brush twice a day Floss once a day THEN IF THEN Remove plaque (decrease plaque in my mouth) OUTPUTS Assumptions: Plaque causes tooth decay Have fewer (ideally zero) cavities OUTCOMES Factors: Genetics
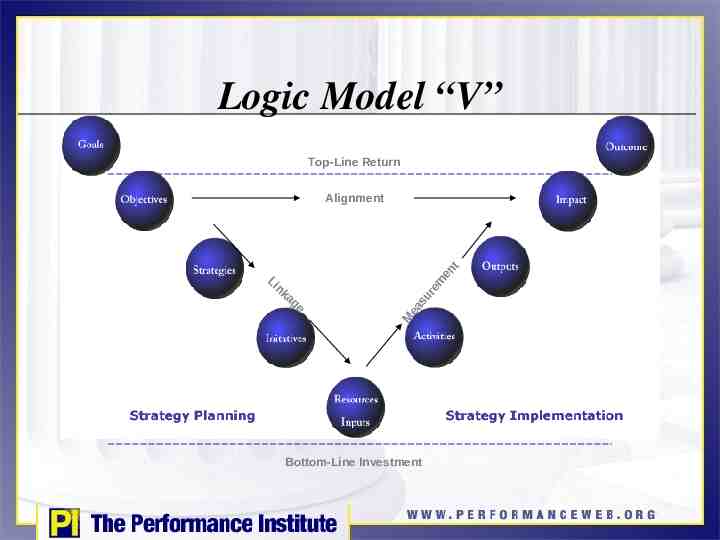
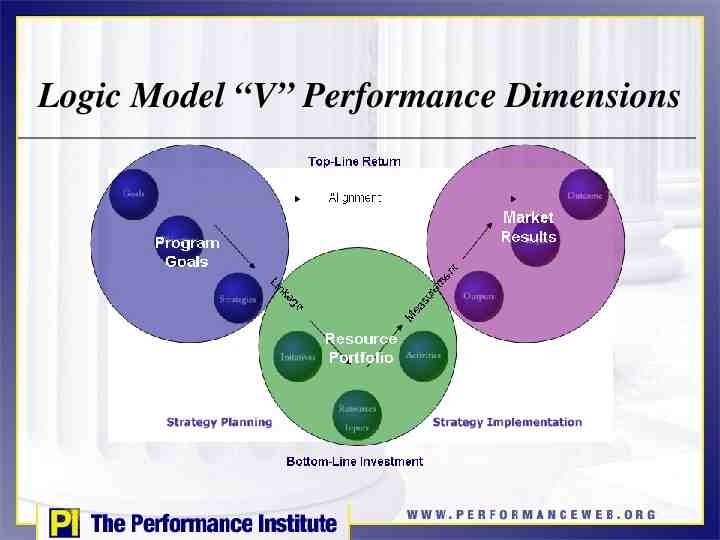
Logic Model “V” Top-Line Return em su r ag e M ea Li nk en t Alignment Bottom-Line Investment
Logic Model “V” Performance Dimensions
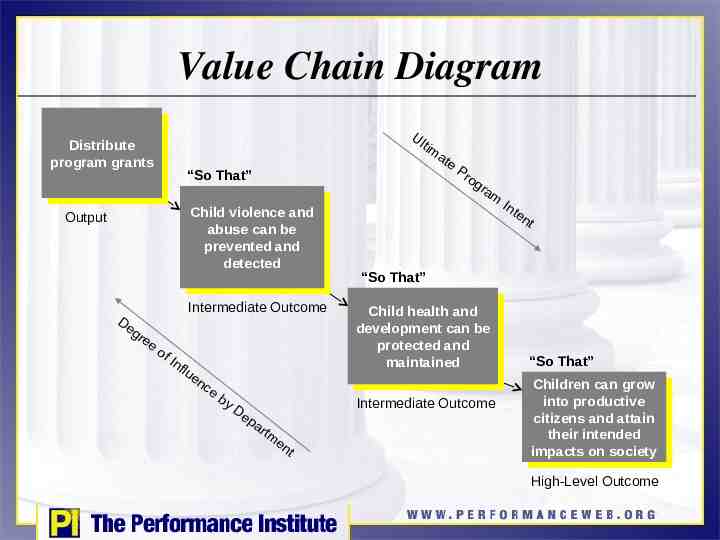
Value Chain Diagram Ul tim at Distribute Distribute program programgrants grants “So That” Child Childviolence violenceand and abuse can be abuse can be prevented preventedand and detected detected Output De gr ee Intermediate Outcome of In fl u en ce by De pa rtm e Pr o gr am en t “So That” Child Childhealth healthand and development can development canbe be protected and protected and maintained maintained Intermediate Outcome en t I nt “So That” Children Childrencan cangrow grow into productive into productive citizens citizensand andattain attain their intended their intended impacts impactson onsociety society High-Level Outcome
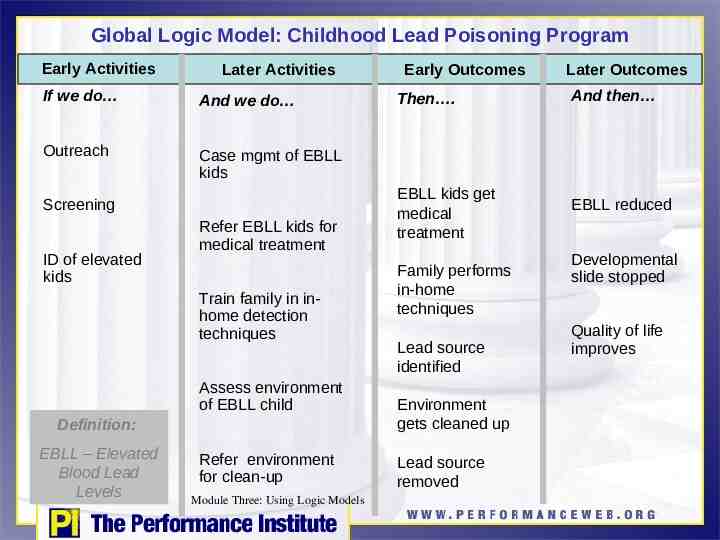
Global Logic Model: Childhood Lead Poisoning Program Early Activities Later Activities If we do And we do Outreach Case mgmt of EBLL kids Screening ID of elevated kids Refer EBLL kids for medical treatment Train family in inhome detection techniques Assess environment of EBLL child Definition: EBLL – Elevated Blood Lead Levels Refer environment for clean-up Module Three: Using Logic Models Early Outcomes Then . EBLL kids get medical treatment Family performs in-home techniques Lead source identified Environment gets cleaned up Lead source removed Later Outcomes And then EBLL reduced Developmental slide stopped Quality of life improves
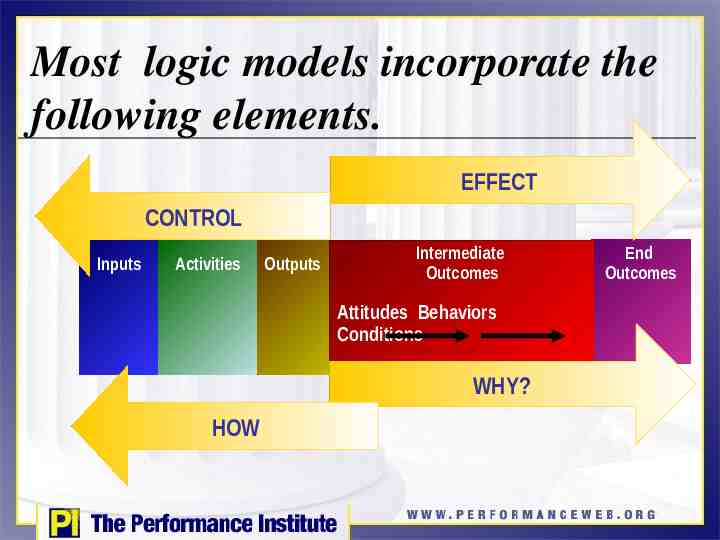
Most logic models incorporate the following elements. EFFECT CONTROL Inputs Activities Outputs Intermediate Outcomes Attitudes Behaviors Conditions WHY? HOW End Outcomes
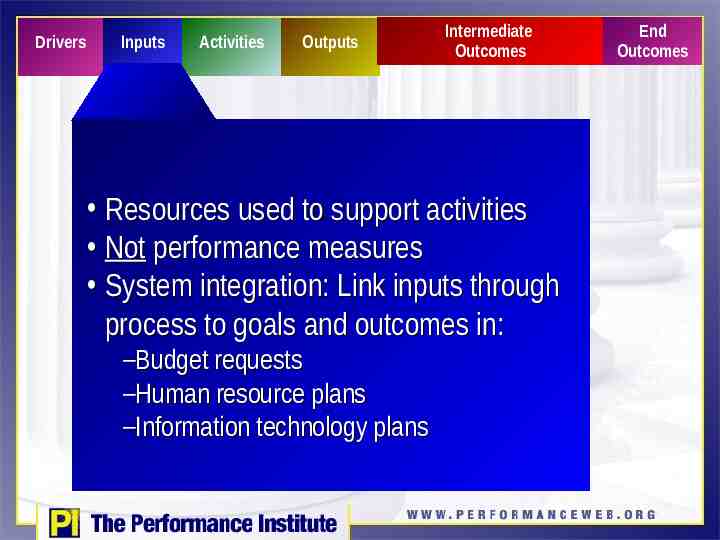
Drivers Inputs Activities Outputs Intermediate Outcomes Resources used to support activities Not performance measures System integration: Link inputs through process to goals and outcomes in: –Budget requests –Human resource plans –Information technology plans End Outcomes
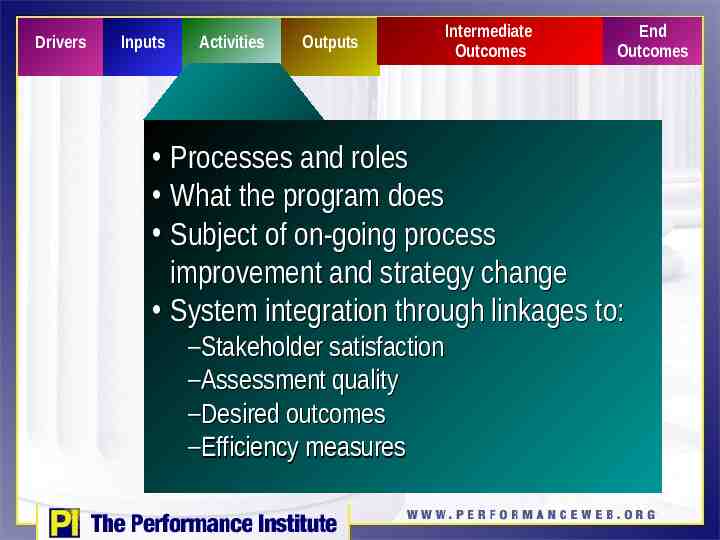
Drivers Inputs Activities Outputs Intermediate Outcomes End Outcomes Processes and roles What the program does Subject of on-going process improvement and strategy change System integration through linkages to: –Stakeholder satisfaction –Assessment quality –Desired outcomes –Efficiency measures
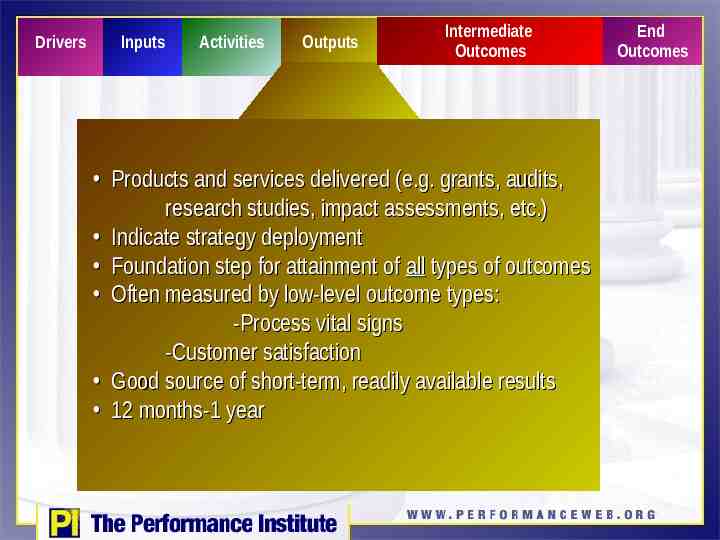
Drivers Inputs Activities Outputs Intermediate Outcomes Products and services delivered (e.g. grants, audits, research studies, impact assessments, etc.) Indicate strategy deployment Foundation step for attainment of all types of outcomes Often measured by low-level outcome types: -Process vital signs -Customer satisfaction Good source of short-term, readily available results 12 months-1 year End Outcomes
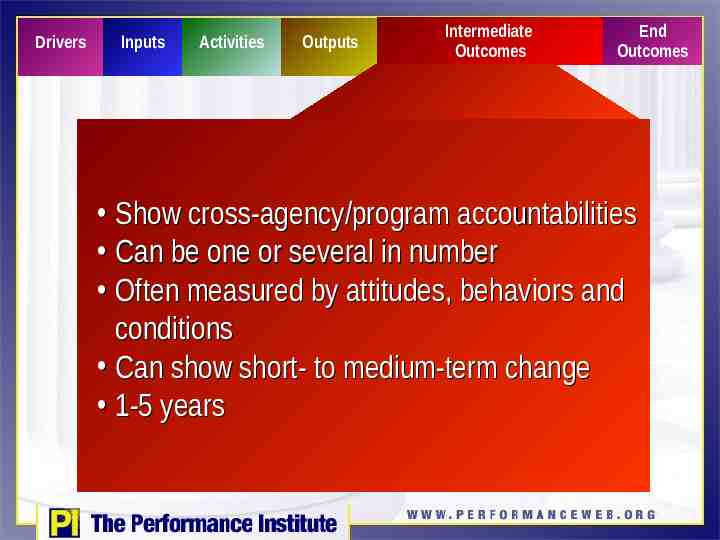
Drivers Inputs Activities Outputs Intermediate Outcomes End Outcomes Show cross-agency/program accountabilities Can be one or several in number Often measured by attitudes, behaviors and conditions Can show short- to medium-term change 1-5 years
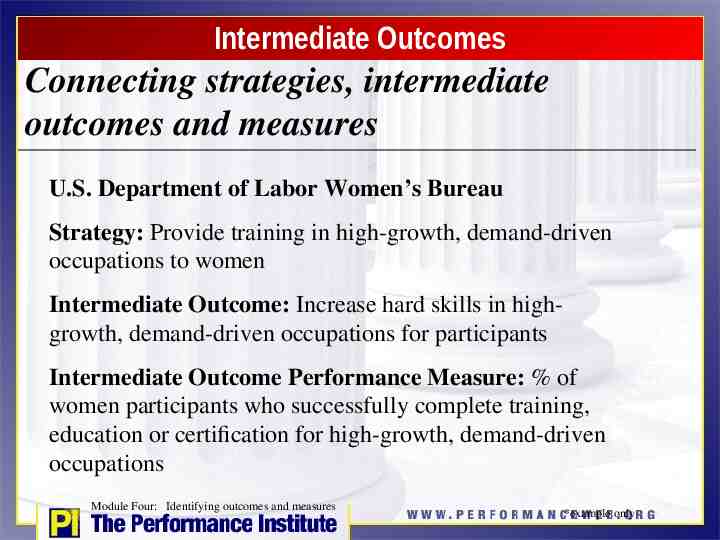
Intermediate Outcomes Connecting strategies, intermediate outcomes and measures U.S. Department of Labor Women’s Bureau Strategy: Provide training in high-growth, demand-driven occupations to women Intermediate Outcome: Increase hard skills in highgrowth, demand-driven occupations for participants Intermediate Outcome Performance Measure: % of women participants who successfully complete training, education or certification for high-growth, demand-driven occupations Module Four: Identifying outcomes and measures *example only
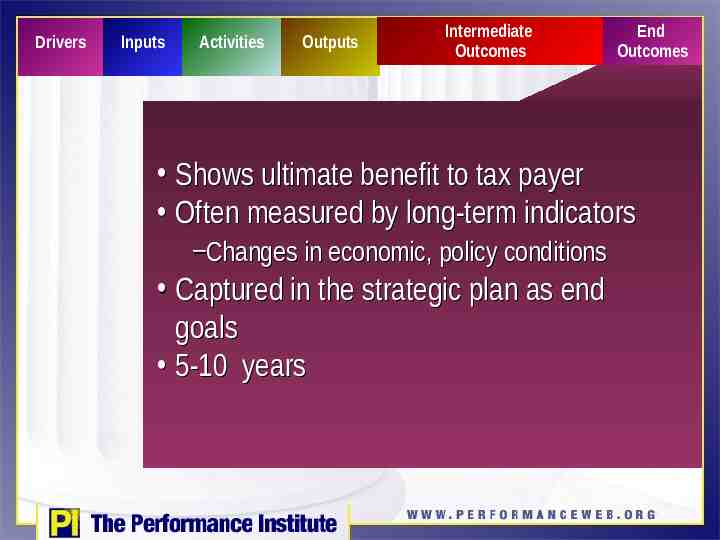
Drivers Inputs Activities Outputs Intermediate Outcomes End Outcomes Shows ultimate benefit to tax payer Often measured by long-term indicators –Changes in economic, policy conditions Captured in the strategic plan as end goals 5-10 years
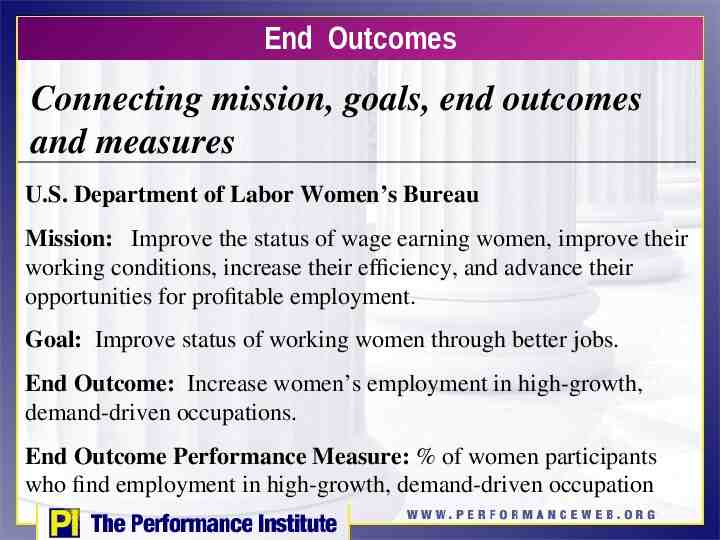
End Outcomes Connecting mission, goals, end outcomes and measures U.S. Department of Labor Women’s Bureau Mission: Improve the status of wage earning women, improve their working conditions, increase their efficiency, and advance their opportunities for profitable employment. Goal: Improve status of working women through better jobs. End Outcome: Increase women’s employment in high-growth, demand-driven occupations. End Outcome Performance Measure: % of women participants who find employment in high-growth, demand-driven occupation
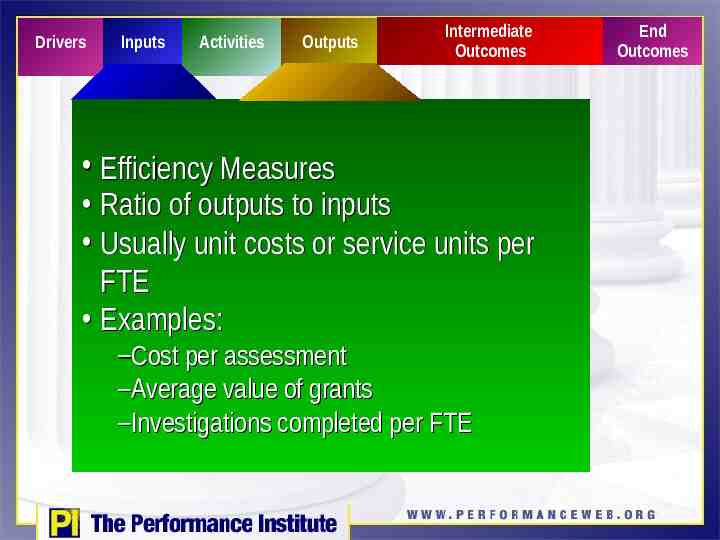
Drivers Inputs Activities Outputs Intermediate Outcomes Efficiency Measures Ratio of outputs to inputs Usually unit costs or service units per FTE Examples: –Cost per assessment –Average value of grants –Investigations completed per FTE End Outcomes
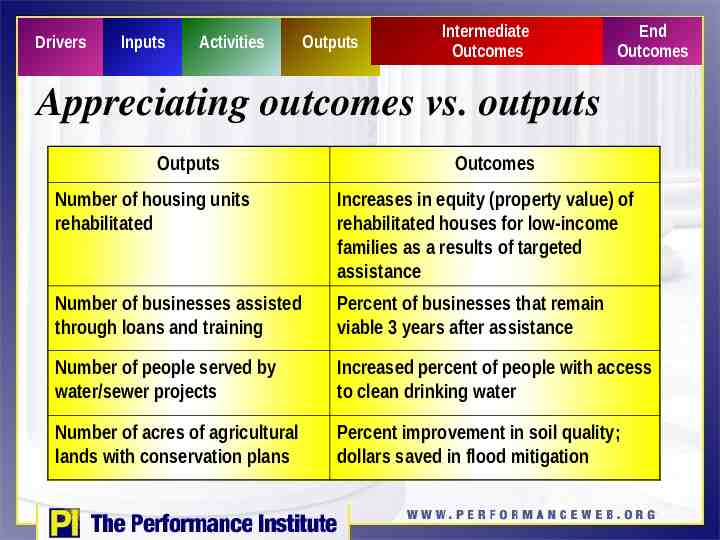
Drivers Inputs Activities Outputs Intermediate Outcomes End Outcomes Appreciating outcomes vs. outputs Outputs Outcomes Number of housing units rehabilitated Increases in equity (property value) of rehabilitated houses for low-income families as a results of targeted assistance Number of businesses assisted through loans and training Percent of businesses that remain viable 3 years after assistance Number of people served by water/sewer projects Increased percent of people with access to clean drinking water Number of acres of agricultural lands with conservation plans Percent improvement in soil quality; dollars saved in flood mitigation
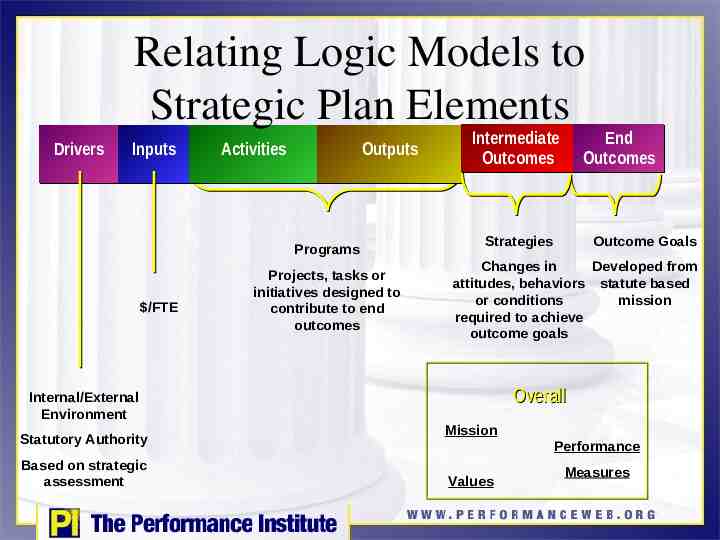
Relating Logic Models to Strategic Plan Elements Drivers Inputs Activities Outputs Programs /FTE Projects, tasks or initiatives designed to contribute to end outcomes Intermediate Outcomes Strategies Based on strategic assessment Outcome Goals Changes in Developed from attitudes, behaviors statute based or conditions mission required to achieve outcome goals Overall Internal/External Environment Statutory Authority End Outcomes Mission Performance Values Measures
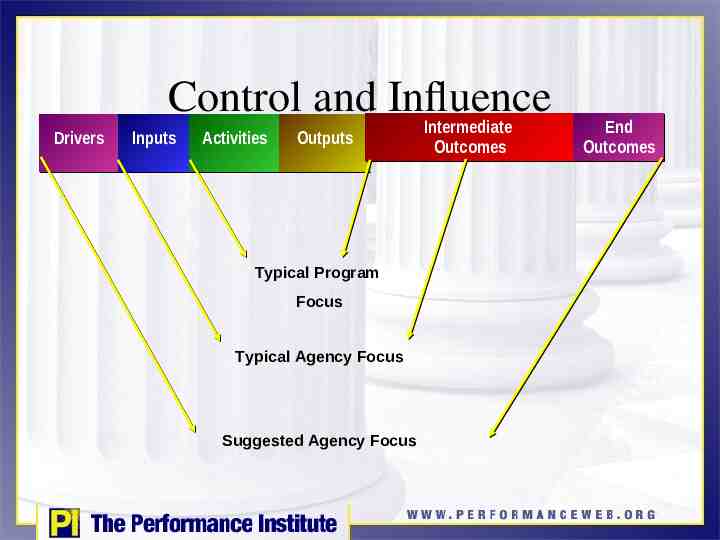
Control and Influence Drivers Inputs Activities Outputs Typical Program Focus Typical Agency Focus Suggested Agency Focus Intermediate Outcomes End Outcomes
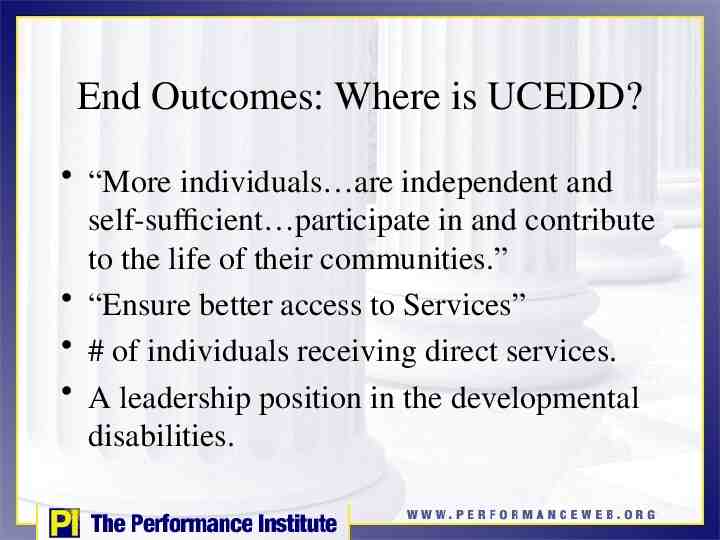
End Outcomes: Where is UCEDD? “More individuals are independent and self-sufficient participate in and contribute to the life of their communities.” “Ensure better access to Services” # of individuals receiving direct services. A leadership position in the developmental disabilities.
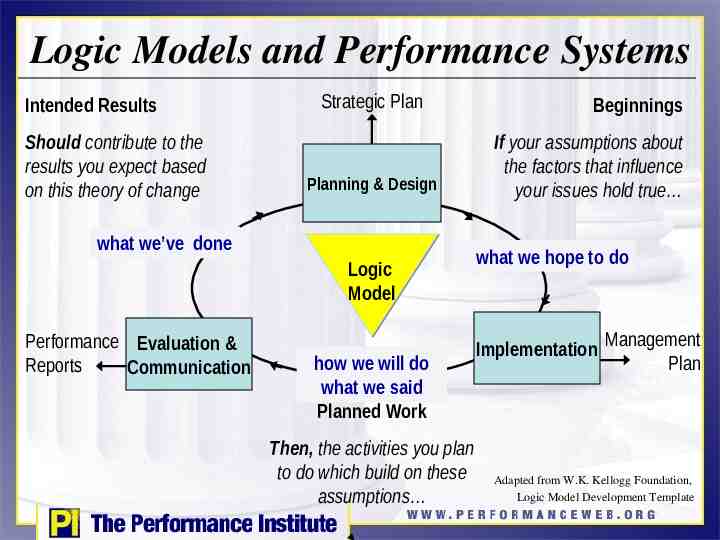
Logic Models and Performance Systems Intended Results Should contribute to the results you expect based on this theory of change Strategic Plan Planning & Design what we’ve done Logic Model Performance Evaluation & Reports Communication how we will do what we said Planned Work Then, the activities you plan to do which build on these assumptions Beginnings If your assumptions about the factors that influence your issues hold true what we hope to do Implementation Management Plan Adapted from W.K. Kellogg Foundation, Logic Model Development Template
The Performance Logic Model MEASURES
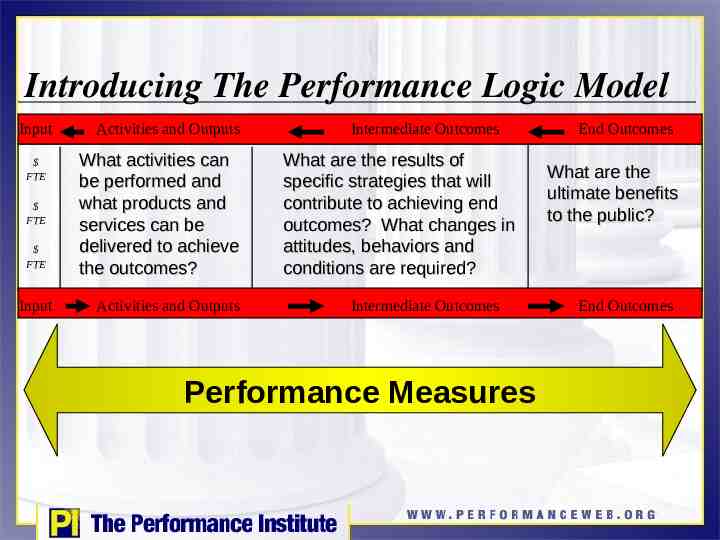
Introducing The Performance Logic Model Input FTE FTE FTE Input Activities and Outputs What activities can be performed and what products and services can be delivered to achieve the outcomes? Activities and Outputs Intermediate Outcomes What are the results of specific strategies that will contribute to achieving end outcomes? What changes in attitudes, behaviors and conditions are required? Intermediate Outcomes Performance Measures End Outcomes What are the ultimate benefits to the public? End Outcomes
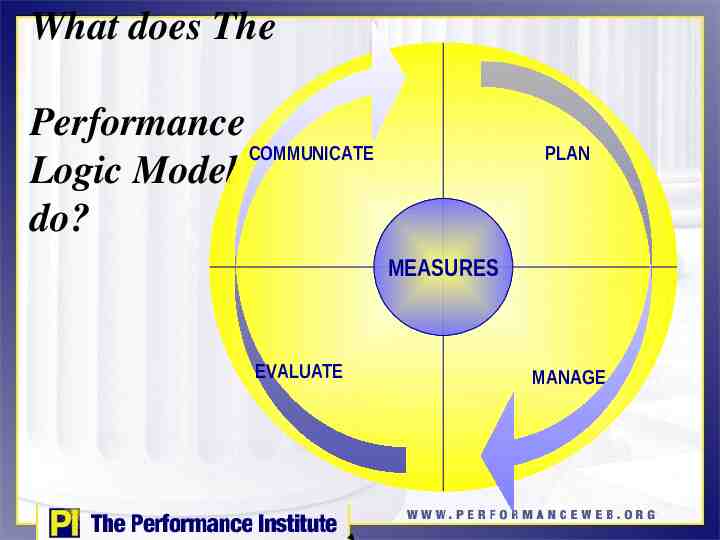
What does The Performance COMMUNICATE Logic Model do? PLAN MEASURES EVALUATE MANAGE
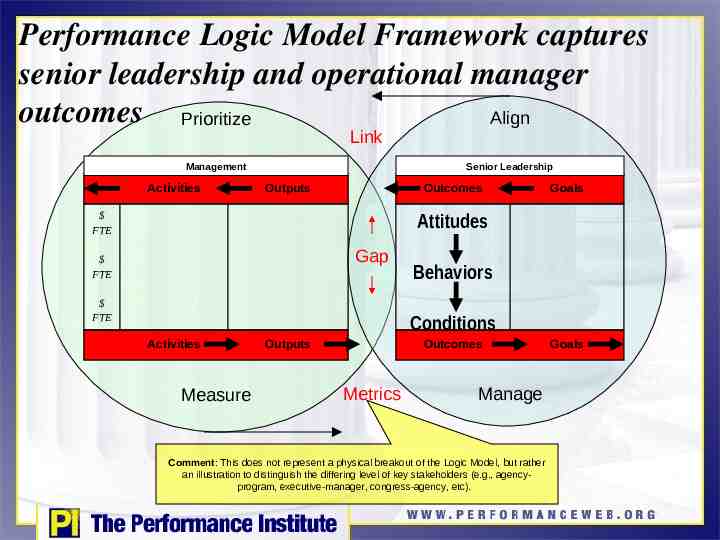
Performance Logic Model Framework captures senior leadership and operational manager outcomes Prioritize Align Link Management Activities Senior Leadership Outputs Outcomes Goals Attitudes FTE Gap FTE FTE Behaviors Conditions Activities Measure Outputs Outcomes Metrics Manage Comment: This does not represent a physical breakout of the Logic Model, but rather an illustration to distinguish the differing level of key stakeholders (e.g., agencyprogram, executive-manager, congress-agency, etc). Goals
Why use The Performance Logic Model? Brings detail to broad goals; helps in planning, evaluation, management, and communications. Builds understanding and promotes consensus about what the organization does and how it will work-builds buy-in and teamwork. Helps to clarify what is appropriate to evaluate, and when, so that evaluation resources are used wisely. Summarizes complex programs to communicate with stakeholders, funders, audiences.
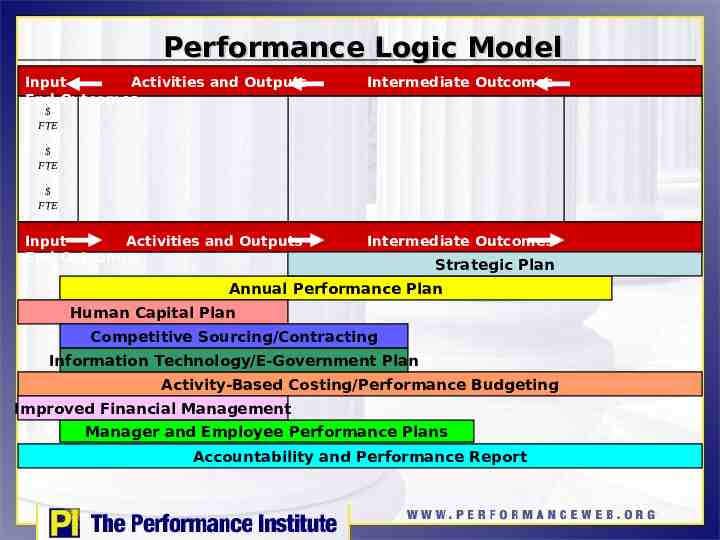
Performance Logic Model Input Activities and Outputs End Outcomes Intermediate Outcomes FTE FTE FTE Input Activities and Outputs End Outcomes Intermediate Outcomes Strategic Plan Annual Performance Plan Human Capital Plan Competitive Sourcing/Contracting Information Technology/E-Government Plan Activity-Based Costing/Performance Budgeting Improved Financial Management Manager and Employee Performance Plans Accountability and Performance Report
UCEED Intermediate Outcomes and Measures – Focusing on the ABC’s of Change; Not End State
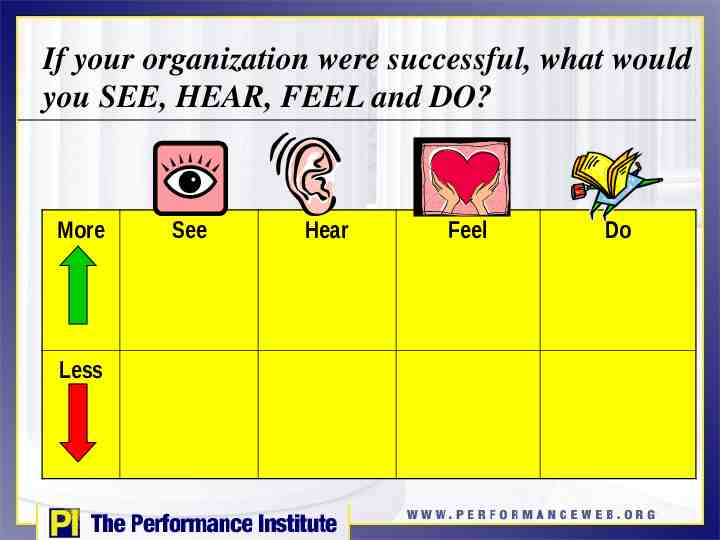
If your organization were successful, what would you SEE, HEAR, FEEL and DO? More Less See Hear Feel Do
Identifying outcomes End outcomes are grounded in mission and statute, assess progress toward strategic goals Intermediate outcomes evaluate progress toward end outcomes, assess impact of strategies; measures changes in attitudes, behaviors or conditions required to achieve end outcomes When goals and strategies are results-based, outcomes leap off the page.
Every outcome has a measure Measures are the indicators of results. Good measures align activities and resources to achieve outcomes. Measures communicate if or to what extent activities have delivered the desired outcomes. Outcome: Increase basic literacy skills in youth ages 14-17 who are basic skills deficient Measure: % of youth enrolled in basic literacy skills training programs who increase basic skills by 1 educational functioning level
Performance Measures Definitions Performance Measures: Indicators, stats, metrics used to gauge program performance Target: Quantifiable characteristic that communicates to what extent a program must accomplish a performance measure Outcome Measures: Intended result of carrying out a program. Define an event or condition external that is a direct impact the public. Output Measures: Describes the level of activity that will be provided over a period of time Efficiency Measures: Measures that capture the skillfulness in executing programs, implementing activities, and achieving results
Current state of measurement Too Many Measures Wrong Kinds of Measures – – – – Not everything that can be counted counts and not everything that counts can be counted. - Albert Einstein Too process and activity oriented No clearly defined “Logic Model” No measures of strategy Few measures of end outcome Dumbing-down of Measures – Measuring only the things you can count rather than things that are strategically important
Recommendations for Measures Balance across three arms of performance – Efficiency (e.g. reduced cost, reduced cycle time) – Effectiveness (e.g. improved customer access, awareness or satisfaction) – Quality (e.g. reduced error rate, increased compliance) Select measures for each outcome, output and activity (metrics) Validate measures – Do they pass the gut check – are they good measures? – Can you identify the data needed to calculate the measure? – Is the data readily available? Evolve measures over time as outputs change or as efficacy of measures decreases
Checking measures Is the measure results-oriented? Does it indicate achievement of outcomes? Is this measure specific and meaningful? Can this be measured? (Consider how?) Will someone be held accountable for the measure? Is the measure time bound? Does it indicate when the results will be realized?
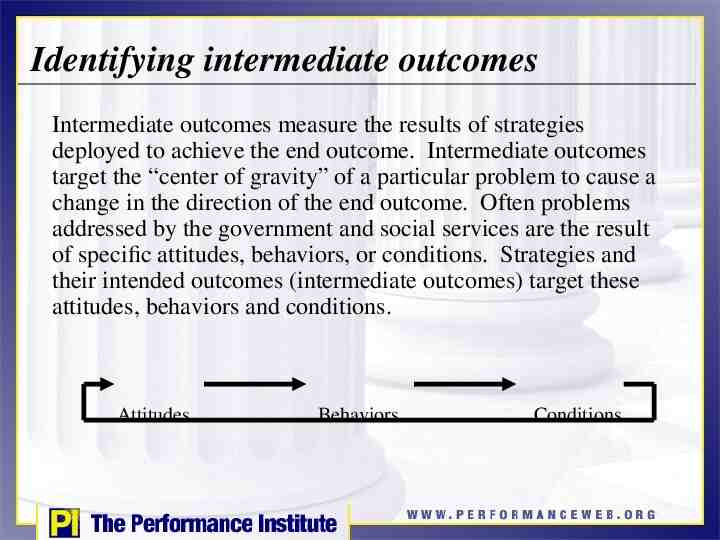
Identifying intermediate outcomes Intermediate outcomes measure the results of strategies deployed to achieve the end outcome. Intermediate outcomes target the “center of gravity” of a particular problem to cause a change in the direction of the end outcome. Often problems addressed by the government and social services are the result of specific attitudes, behaviors, or conditions. Strategies and their intended outcomes (intermediate outcomes) target these attitudes, behaviors and conditions. Attitudes Behaviors Conditions
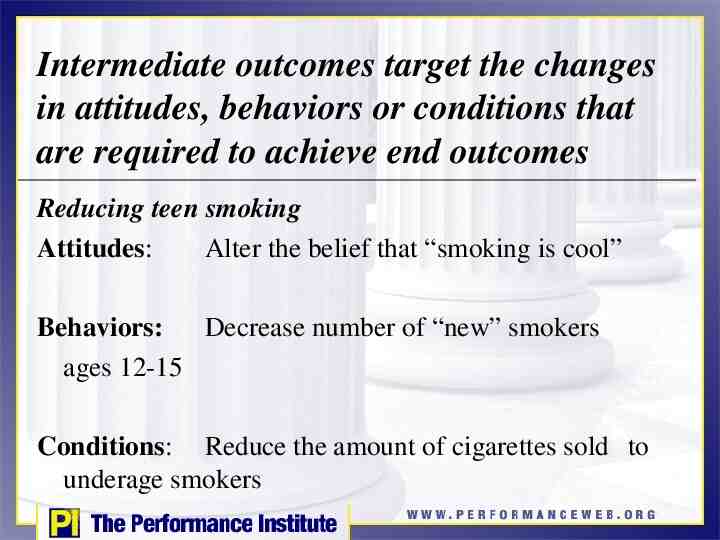
Intermediate outcomes target the changes in attitudes, behaviors or conditions that are required to achieve end outcomes Reducing teen smoking Attitudes: Alter the belief that “smoking is cool” Behaviors: Decrease number of “new” smokers ages 12-15 Conditions: Reduce the amount of cigarettes sold to underage smokers
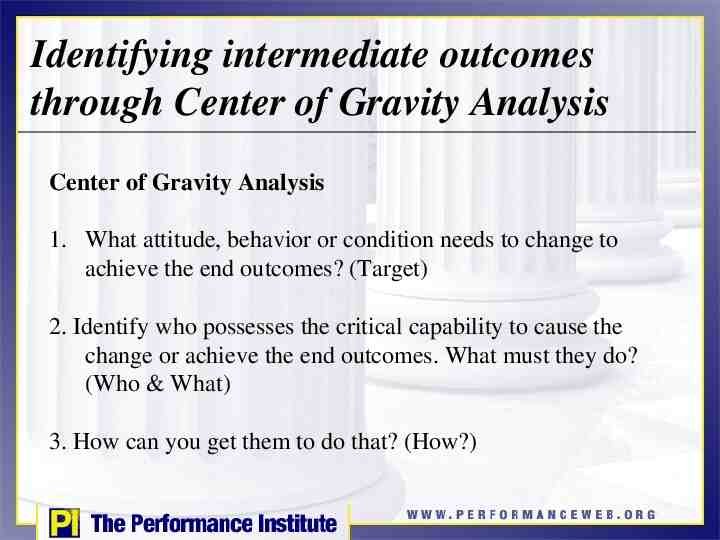
Identifying intermediate outcomes through Center of Gravity Analysis Center of Gravity Analysis 1. What attitude, behavior or condition needs to change to achieve the end outcomes? (Target) 2. Identify who possesses the critical capability to cause the change or achieve the end outcomes. What must they do? (Who & What) 3. How can you get them to do that? (How?)
Module Six: 7 Steps to Building a Performance Logic Model: Welfare to Work
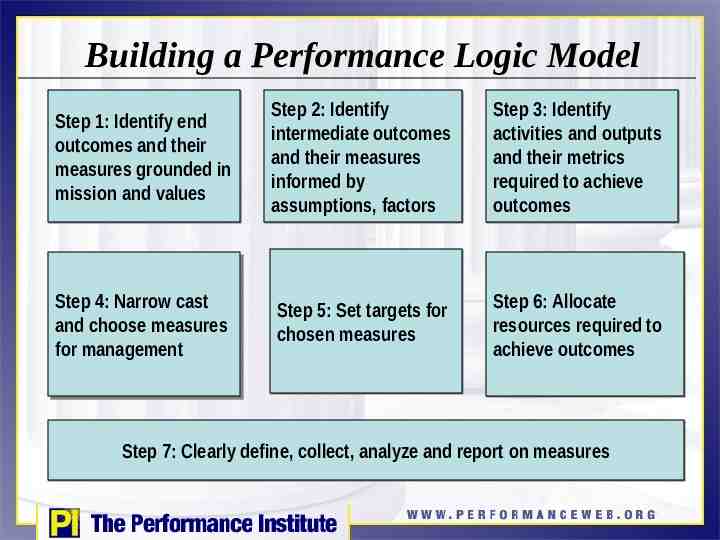
Building a Performance Logic Model Step 1: Identify end outcomes and their measures grounded in mission and values Step 2: Identify intermediate outcomes and their measures informed by assumptions, factors Step 3: Identify activities and outputs and their metrics required to achieve outcomes Step Step 4: 4: Narrow Narrow cast cast and and choose choose measures measures for for management management Step 5: Set targets for chosen measures Step 6: Allocate resources required to achieve outcomes Step 7: Clearly define, collect, analyze and report on measures
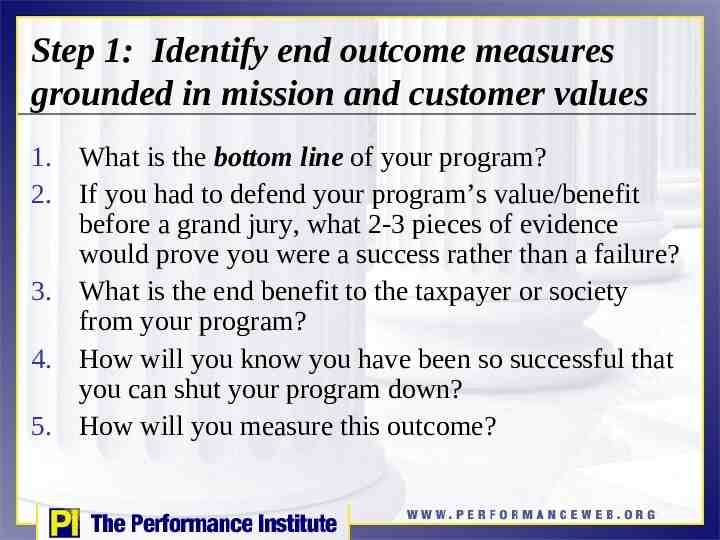
Step 1: Identify end outcome measures grounded in mission and customer values 1. What is the bottom line of your program? 2. If you had to defend your program’s value/benefit before a grand jury, what 2-3 pieces of evidence would prove you were a success rather than a failure? 3. What is the end benefit to the taxpayer or society from your program? 4. How will you know you have been so successful that you can shut your program down? 5. How will you measure this outcome?
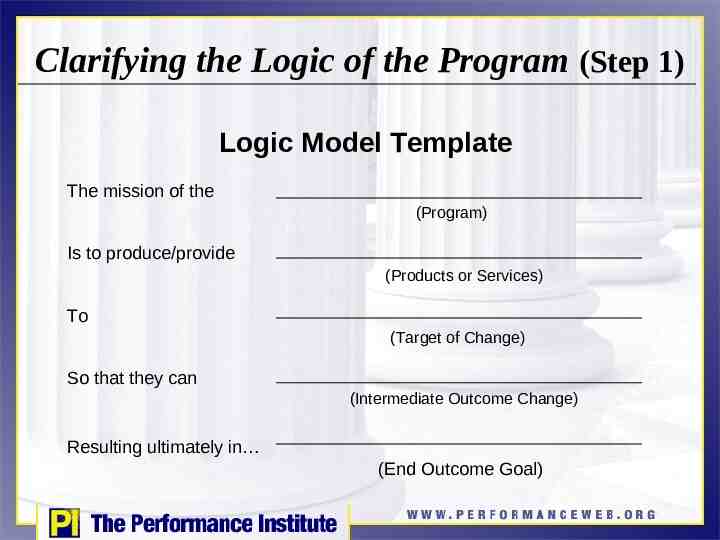
Clarifying the Logic of the Program (Step 1) Logic Model Template The mission of the (Program) Is to produce/provide (Products or Services) To (Target of Change) So that they can (Intermediate Outcome Change) Resulting ultimately in (End Outcome Goal)
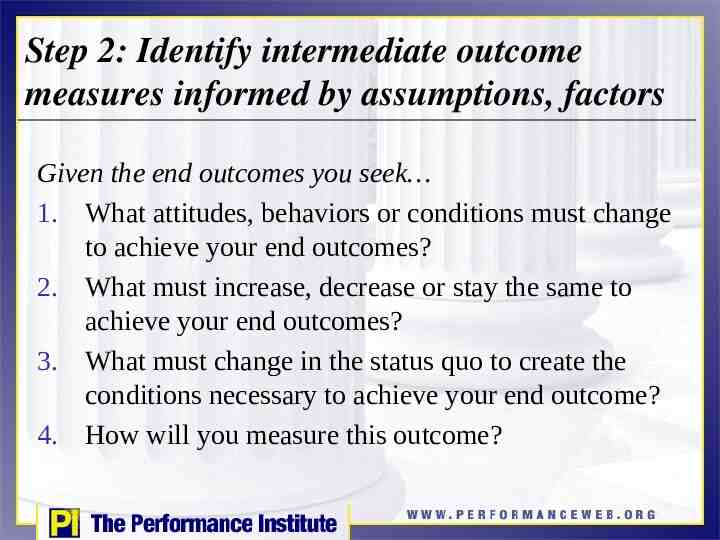
Step 2: Identify intermediate outcome measures informed by assumptions, factors Given the end outcomes you seek 1. What attitudes, behaviors or conditions must change to achieve your end outcomes? 2. What must increase, decrease or stay the same to achieve your end outcomes? 3. What must change in the status quo to create the conditions necessary to achieve your end outcome? 4. How will you measure this outcome?
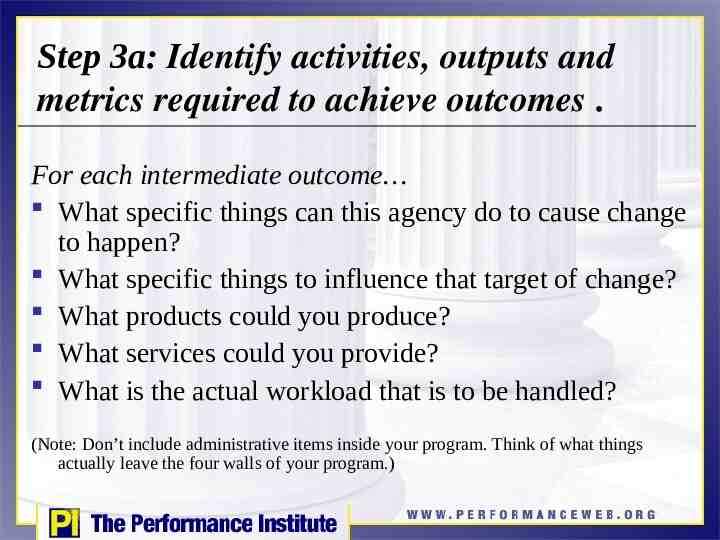
Step 3a: Identify activities, outputs and metrics required to achieve outcomes . For each intermediate outcome What specific things can this agency do to cause change to happen? What specific things to influence that target of change? What products could you produce? What services could you provide? What is the actual workload that is to be handled? (Note: Don’t include administrative items inside your program. Think of what things actually leave the four walls of your program.)
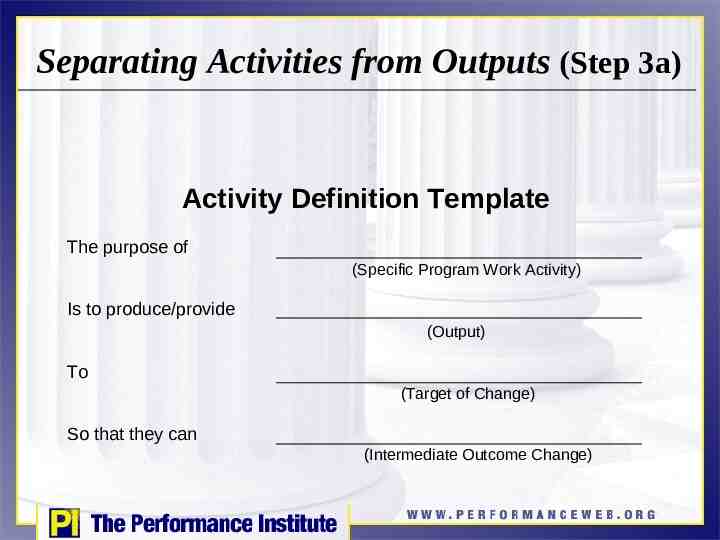
Separating Activities from Outputs (Step 3a) Activity Definition Template The purpose of (Specific Program Work Activity) Is to produce/provide (Output) To (Target of Change) So that they can (Intermediate Outcome Change)
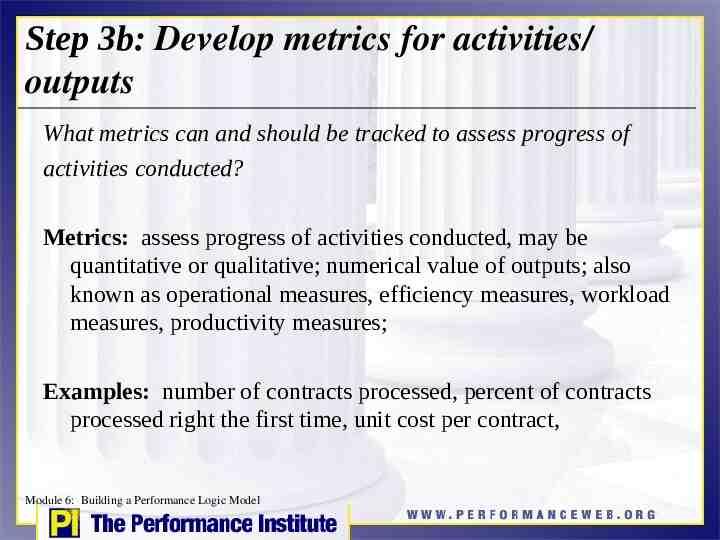
Step 3b: Develop metrics for activities/ outputs What metrics can and should be tracked to assess progress of activities conducted? Metrics: assess progress of activities conducted, may be quantitative or qualitative; numerical value of outputs; also known as operational measures, efficiency measures, workload measures, productivity measures; Examples: number of contracts processed, percent of contracts processed right the first time, unit cost per contract, Module 6: Building a Performance Logic Model
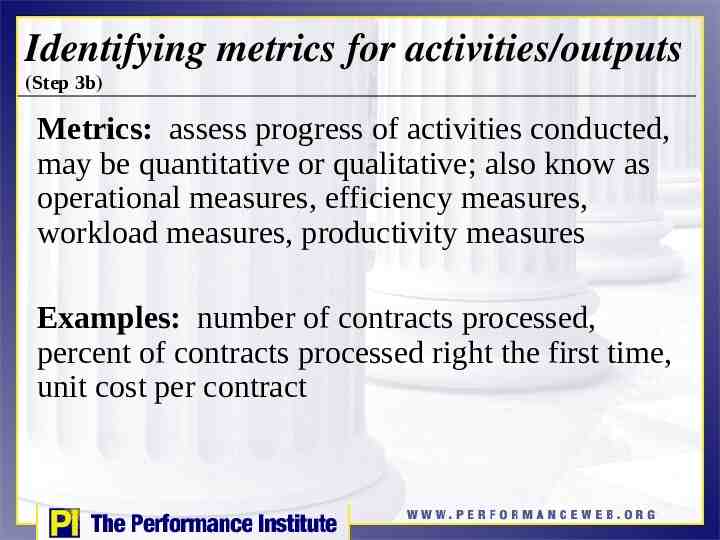
Identifying metrics for activities/outputs (Step 3b) Metrics: assess progress of activities conducted, may be quantitative or qualitative; also know as operational measures, efficiency measures, workload measures, productivity measures Examples: number of contracts processed, percent of contracts processed right the first time, unit cost per contract
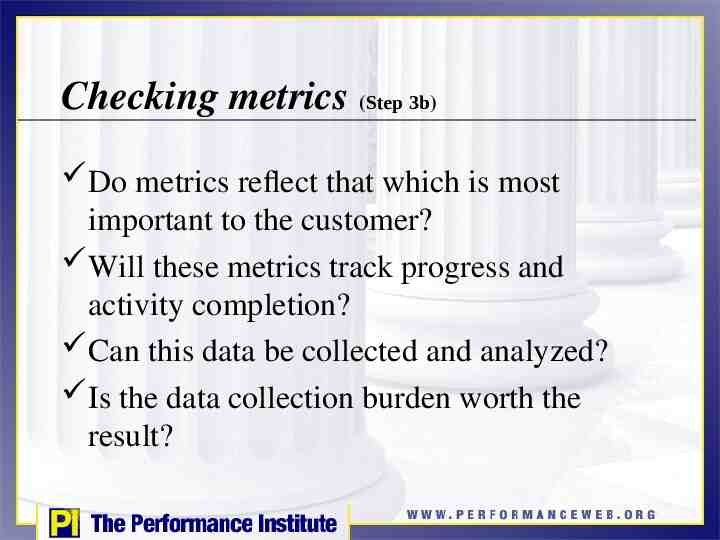
Checking metrics (Step 3b) Do metrics reflect that which is most important to the customer? Will these metrics track progress and activity completion? Can this data be collected and analyzed? Is the data collection burden worth the result?
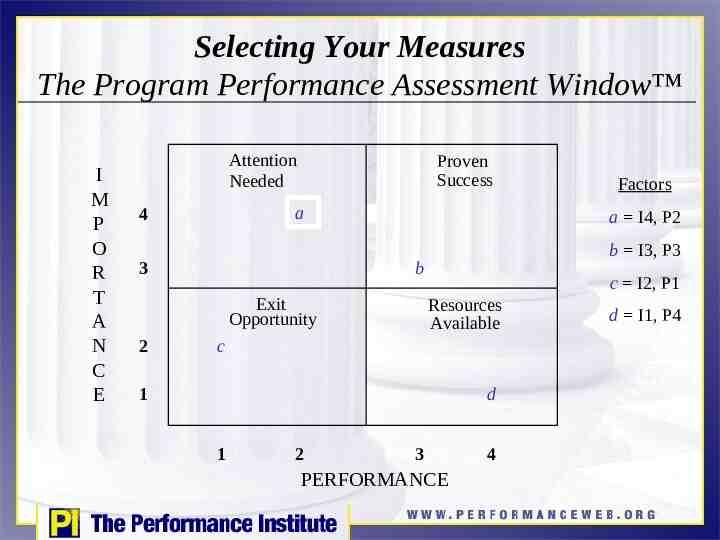
Selecting Your Measures The Program Performance Assessment Window I M P O R T A N C E Attention Needed Proven Success a 4 a I4, P2 Exit Opportunity 2 b I3, P3 b 3 c I2, P1 Resources Available c d 1 1 2 Factors 3 PERFORMANCE 4 d I1, P4
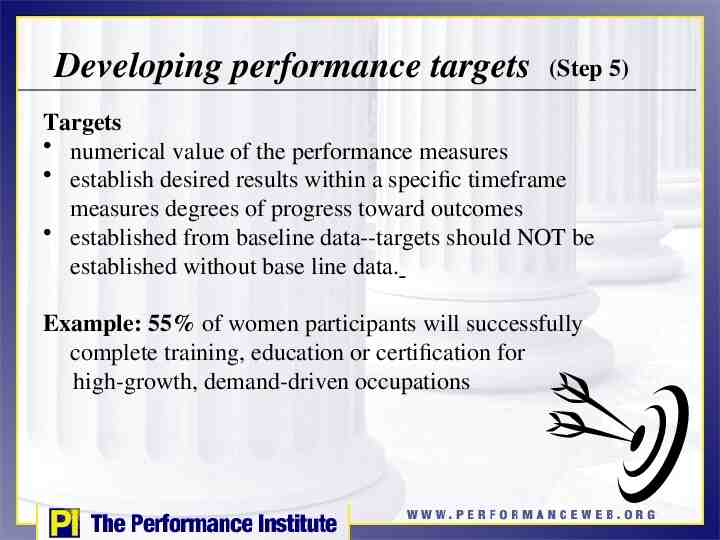
Developing performance targets (Step 5) Targets numerical value of the performance measures establish desired results within a specific timeframe measures degrees of progress toward outcomes established from baseline data--targets should NOT be established without base line data. Example: 55% of women participants will successfully complete training, education or certification for high-growth, demand-driven occupations
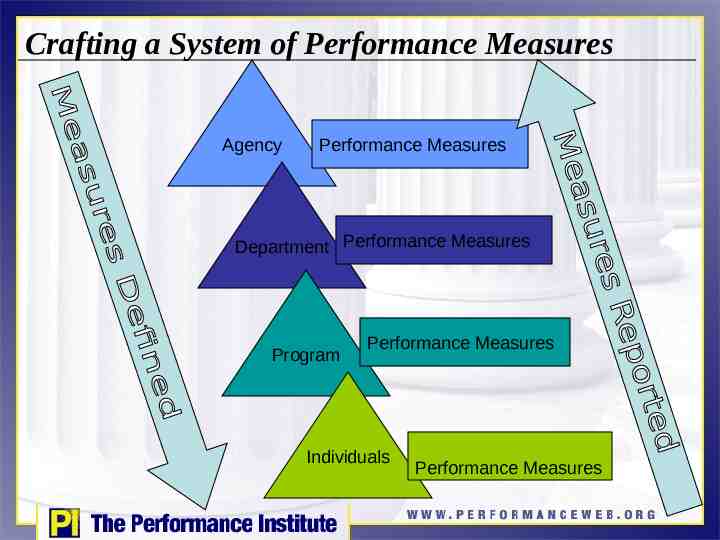
Crafting a System of Performance Measures Agency Performance Measures Department Performance Measures Program Performance Measures Individuals Performance Measures
Cascading The Performance Logic Model It is possible to use one model for all required measures from all funding sources drill-down and roll-up logic models logic model across functions and operations capture both internal and external stakeholders
Benefits of The Performance Logic Model Program Integration: Tracks and coordinates the contributions of multiple programs, bureaus, agencies, levels of government, and sectors of society (non-profits, for-profits, etc.) Systems Integration: Allows for the comprehensive integration of different elements of the management agenda, such as IT, acquisition, human resources, etc. Accountability: Links program goals to individual achievement and vendor/contractor performance
2005 UCEDD Logic Model End Outcome – More Individuals with developmental disabilities are independent and selfsufficient. More individuals with developmental disabilities participate in and contribute to the life of their communities Is this the vision? The Ultimate Goal? Can we measure it?
2005 UCEDD Logic Model Intermediate Outcomes – More models are field tested and expert knowledge relevant to the DD field is gained and disseminated More students & leaders are trained and remain in the field of DD. More individuals with DD receive services from trained individuals. More communities and policymakers are knowledgeable about DD issues. More individuals with DD receive high quality services from trained individuals and through improved access and expanded capacity Are these outcomes, outputs or a little of both?
2005 UCEDD Logic Model Outputs – # of trainees who gained knowledge & skills # of individuals in the community who gained # who received services and support # of research and evaluation activities conducted # who remain in the field # of products developed & disseminated # of recipients of products disseminated Do these overlap or align with the intermediate outcomes?