Developing data skills for the Quality Practitioner Paula Keys, Head


40 Slides5.40 MB
Developing data skills for the Quality Practitioner Paula Keys, Head of Planning & Performance Chris Laity, Associate Registrar University of South Wales (slides redacted in some areas)
Content Why? What and How? Challenges Approaches (tried and tested) Examples Discussion
Why? The increasing use of metrics, data, measures in HE
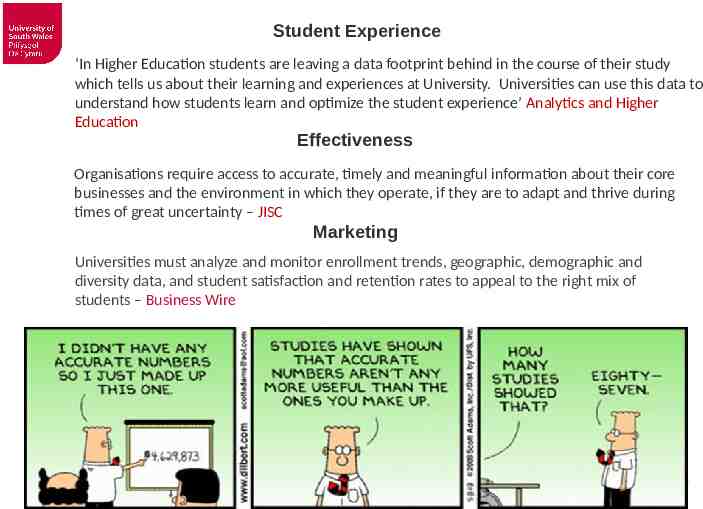
Student Experience ‘In Higher Education students are leaving a data footprint behind in the course of their study which tells us about their learning and experiences at University. Universities can use this data to understand how students learn and optimize the student experience’ Analytics and Higher Education Effectiveness Organisations require access to accurate, timely and meaningful information about their core businesses and the environment in which they operate, if they are to adapt and thrive during times of great uncertainty – JISC Marketing Universities must analyze and monitor enrollment trends, geographic, demographic and diversity data, and student satisfaction and retention rates to appeal to the right mix of students – Business Wire University of South Wales
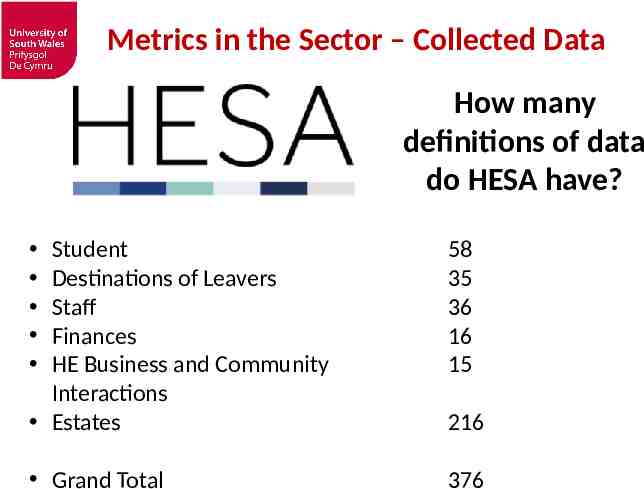
Metrics in the Sector – Collected Data How many definitions of data do HESA have? Student Destinations of Leavers Staff Finances HE Business and Community Interactions Estates 58 35 36 16 15 Grand Total 376 216
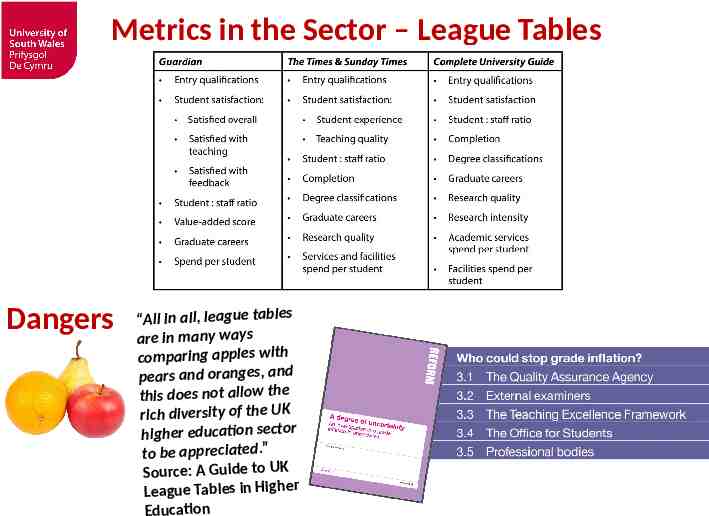
Metrics in the Sector – League Tables Dangers “All in all, league tables are in many ways comparing apples with pears and oranges, and this does not allow the rich diversity of the UK higher education sector to be appreciated.” Source: A Guide to UK League Tables in Higher Education
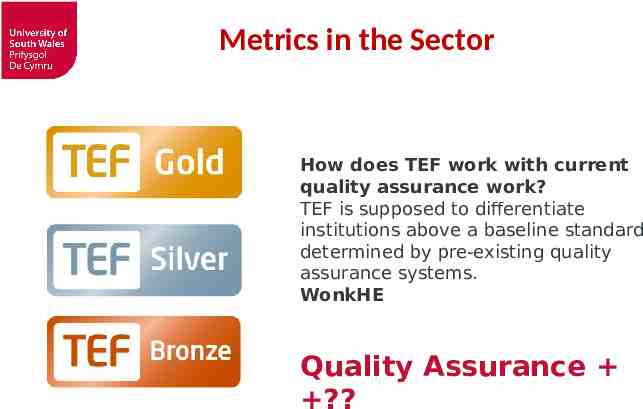
Metrics in the Sector How does TEF work with current quality assurance work? TEF is supposed to differentiate institutions above a baseline standard determined by pre-existing quality assurance systems. WonkHE Quality Assurance ?
Other Drivers – Value for Money? The Telegraph The Guardian
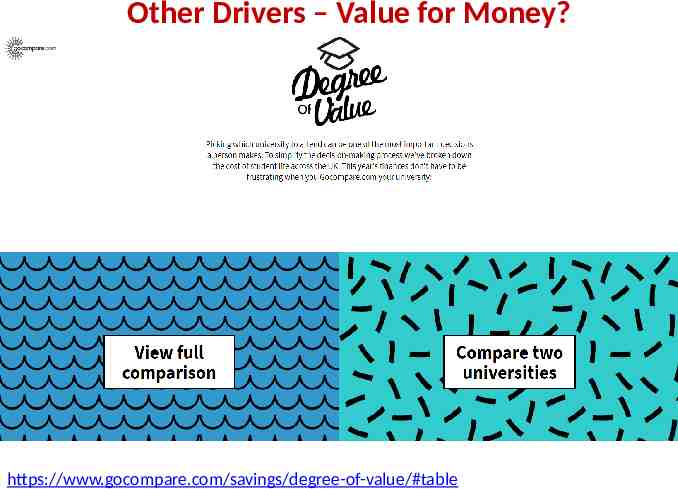
Other Drivers – Value for Money? https://www.gocompare.com/savings/degree-of-value/#table
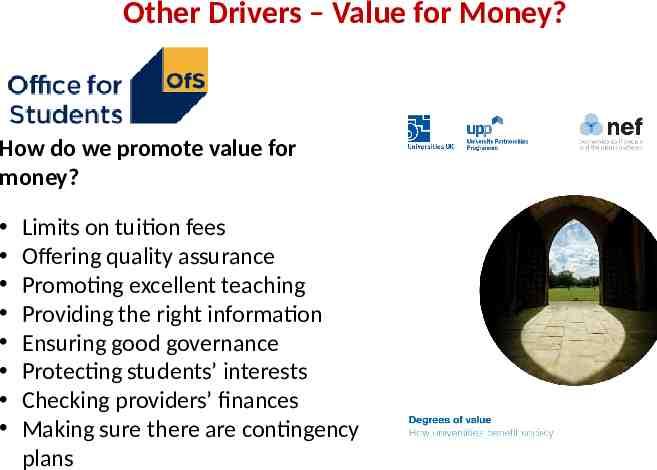
Other Drivers – Value for Money? How do we promote value for money? Limits on tuition fees Offering quality assurance Promoting excellent teaching Providing the right information Ensuring good governance Protecting students’ interests Checking providers’ finances Making sure there are contingency plans
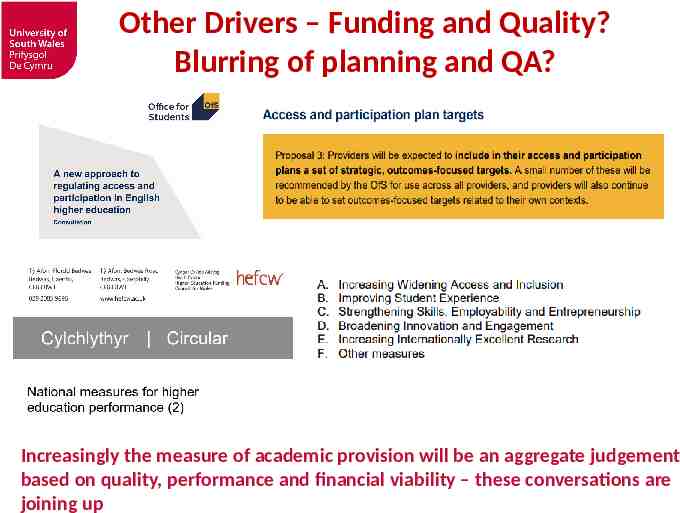
Other Drivers – Funding and Quality? Blurring of planning and QA? Increasingly the measure of academic provision will be an aggregate judgement based on quality, performance and financial viability – these conversations are joining up
What? How?
Focus - Linked to Strategy and Vision University of South Wales
And we need to understand our own performance in the context of the wider UK sector
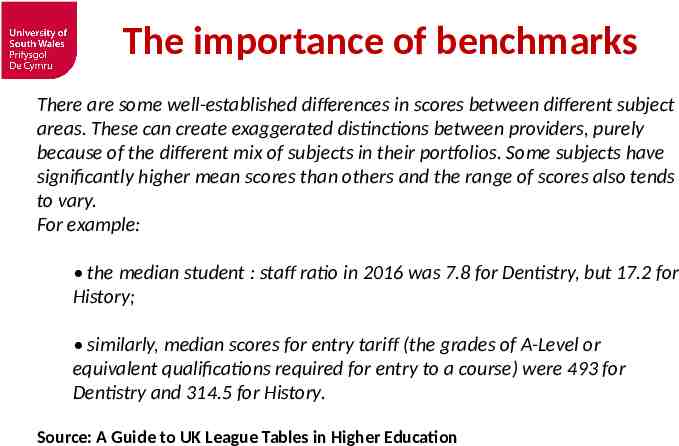
The importance of benchmarks There are some well-established differences in scores between different subject areas. These can create exaggerated distinctions between providers, purely because of the different mix of subjects in their portfolios. Some subjects have significantly higher mean scores than others and the range of scores also tends to vary. For example: the median student : staff ratio in 2016 was 7.8 for Dentistry, but 17.2 for History; similarly, median scores for entry tariff (the grades of A-Level or equivalent qualifications required for entry to a course) were 493 for Dentistry and 314.5 for History. Source: A Guide to UK League Tables in Higher Education
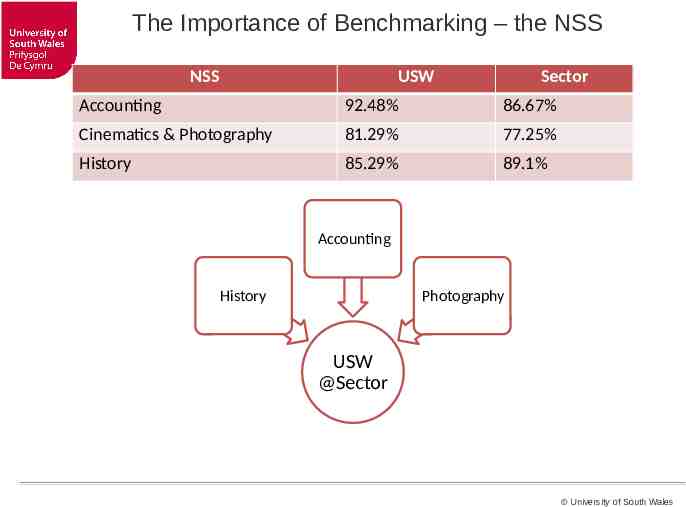
The Importance of Benchmarking – the NSS NSS USW Sector Accounting 92.48% 86.67% Cinematics & Photography 81.29% 77.25% History 85.29% 89.1% Accounting History Photography USW @Sector University of South Wales
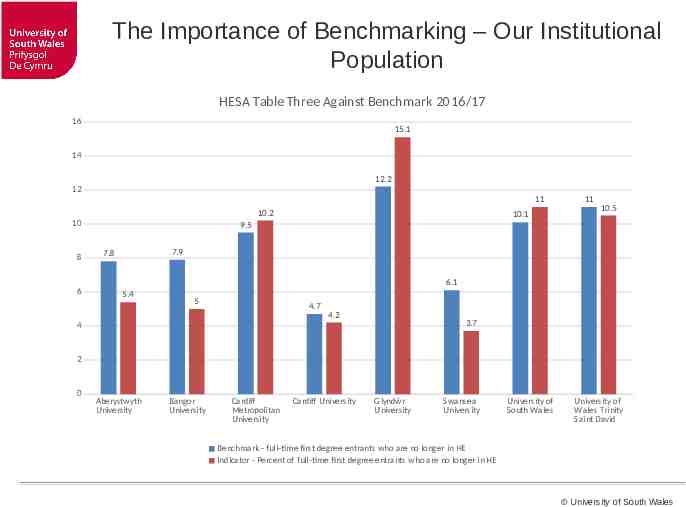
The Importance of Benchmarking – Our Institutional Population HESA Table Three Against Benchmark 2016/17 16 15.1 14 12.2 12 11 10.2 10 8 6 10.1 11 10.5 9.5 7.9 7.8 6.1 5.4 5 4.7 4.2 3.7 4 2 0 Aberystwyth University Bangor University Cardiff Metropolitan University Cardiff University Glyndŵr University Swansea University University of South Wales University of Wales Trinity Saint David Benchmark - full-time first degree entrants who are no longer in HE Indicator - Percent of full-time first degree entrants who are no longer in HE University of South Wales
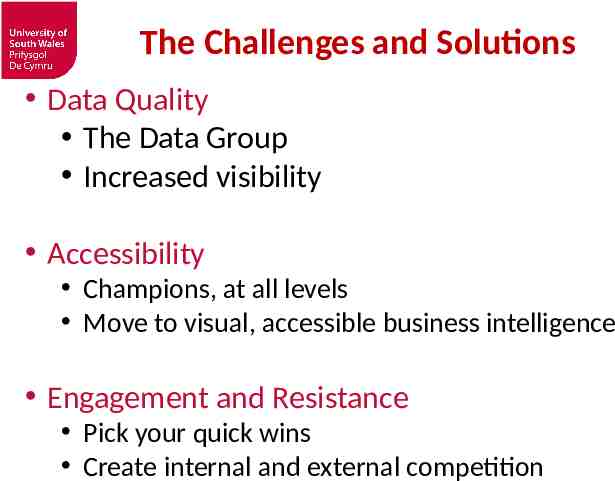
The Challenges and Solutions Data Quality The Data Group Increased visibility Accessibility Champions, at all levels Move to visual, accessible business intelligence Engagement and Resistance Pick your quick wins Create internal and external competition
Examples. What works .
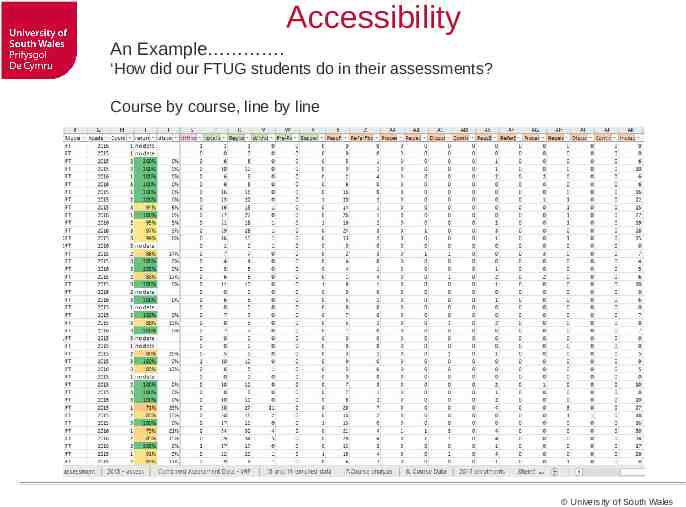
Accessibility An Example . ‘How did our FTUG students do in their assessments? Course by course, line by line University of South Wales
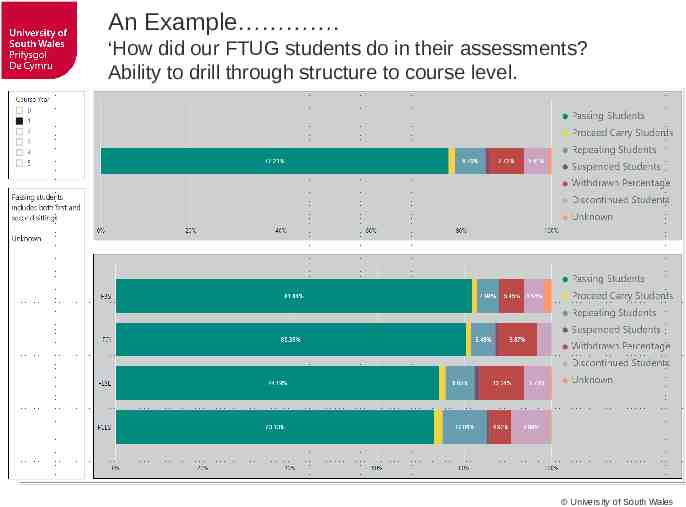
An Example . ‘How did our FTUG students do in their assessments? Ability to drill through structure to course level. University of South Wales
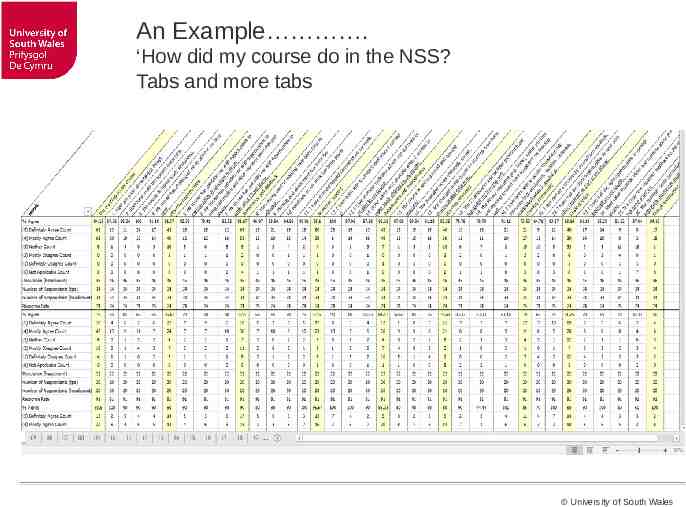
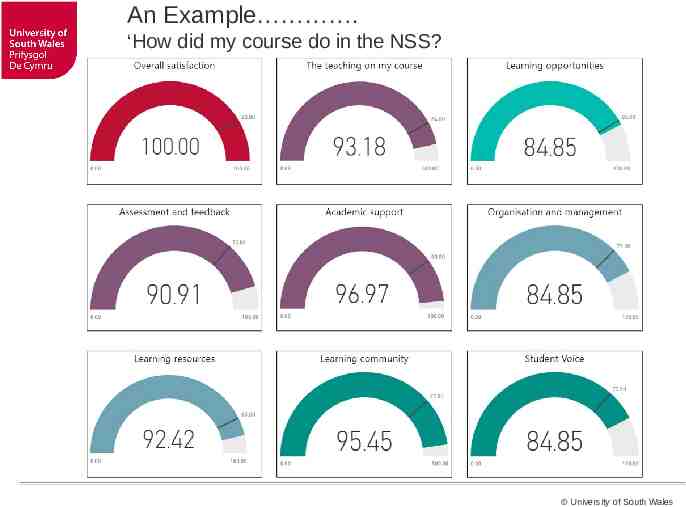
An Example . ‘How did my course do in the NSS? Tabs and more tabs University of South Wales
An Example . ‘How did my course do in the NSS? University of South Wales
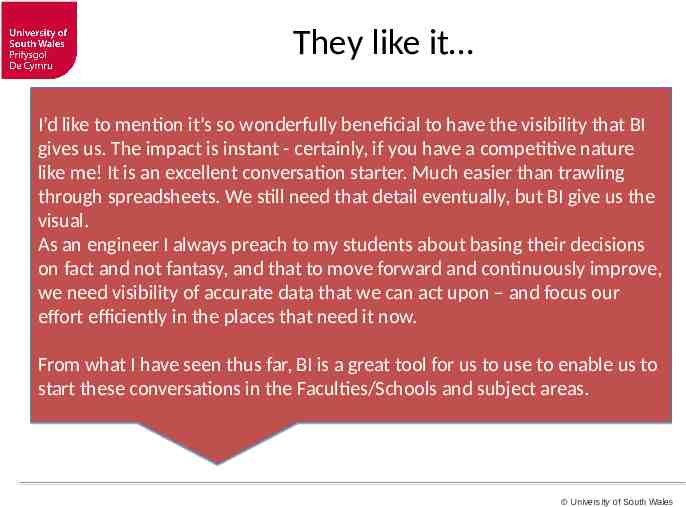
They like it I’d like to mention it’s so wonderfully beneficial to have the visibility that BI gives us. The impact is instant - certainly, if you have a competitive nature like me! It is an excellent conversation starter. Much easier than trawling through spreadsheets. We still need that detail eventually, but BI give us the visual. As an engineer I always preach to my students about basing their decisions on fact and not fantasy, and that to move forward and continuously improve, we need visibility of accurate data that we can act upon – and focus our effort efficiently in the places that need it now. From what I have seen thus far, BI is a great tool for us to use to enable us to start these conversations in the Faculties/Schools and subject areas. University of South Wales
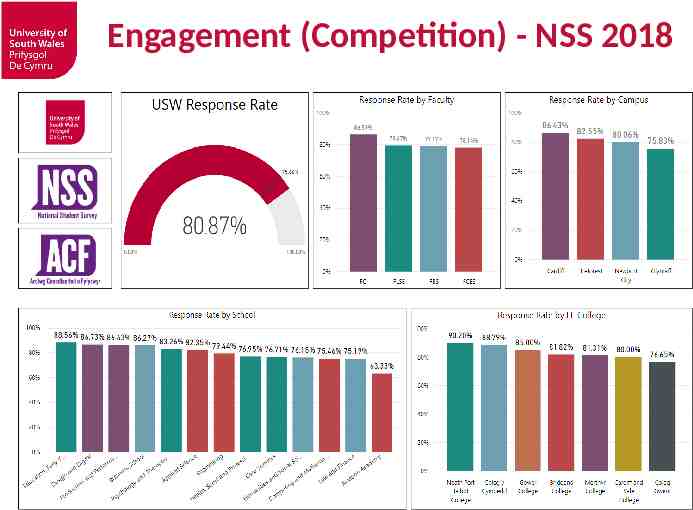
Engagement (Competition) - NSS 2018
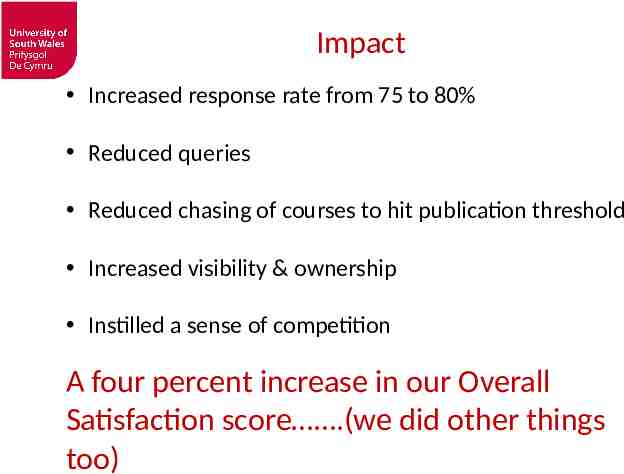
Impact Increased response rate from 75 to 80% Reduced queries Reduced chasing of courses to hit publication threshold Increased visibility & ownership Instilled a sense of competition A four percent increase in our Overall Satisfaction score .(we did other things too)
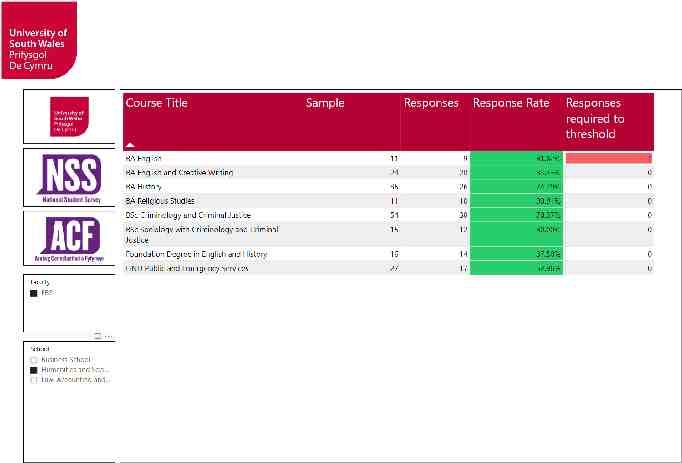
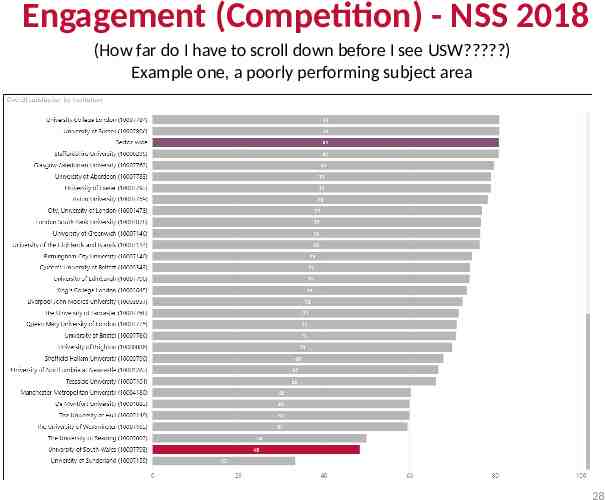
Engagement (Competition) - NSS 2018 (How far do I have to scroll down before I see USW?) Example one, a poorly performing subject area 28
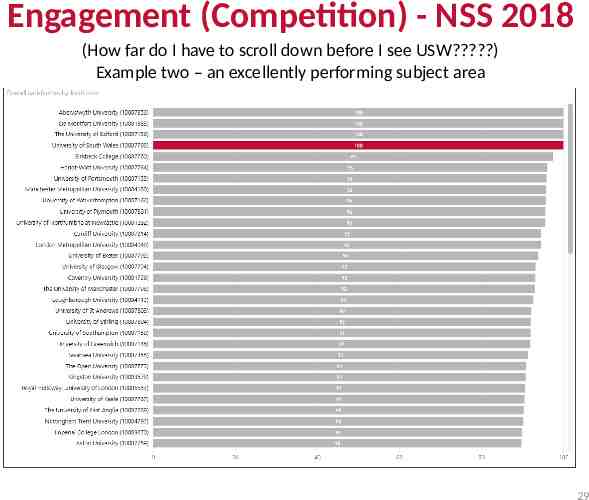
Engagement (Competition) - NSS 2018 (How far do I have to scroll down before I see USW?) Example two – an excellently performing subject area 29
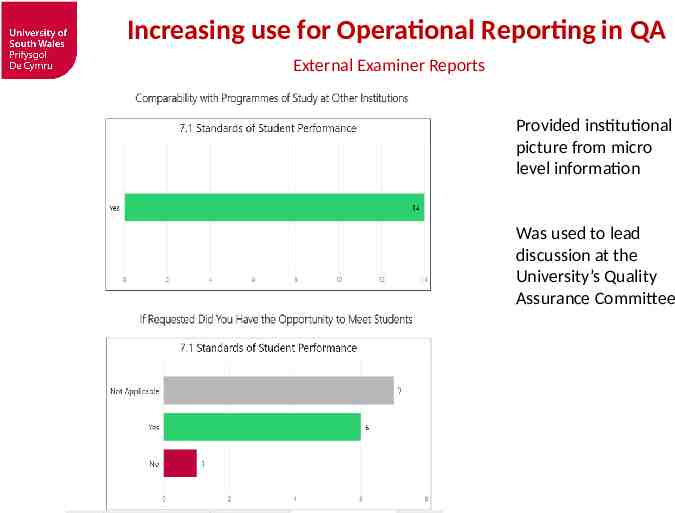
Increasing use for Operational Reporting in QA External Examiner Reports Provided institutional picture from micro level information Was used to lead discussion at the University’s Quality Assurance Committee
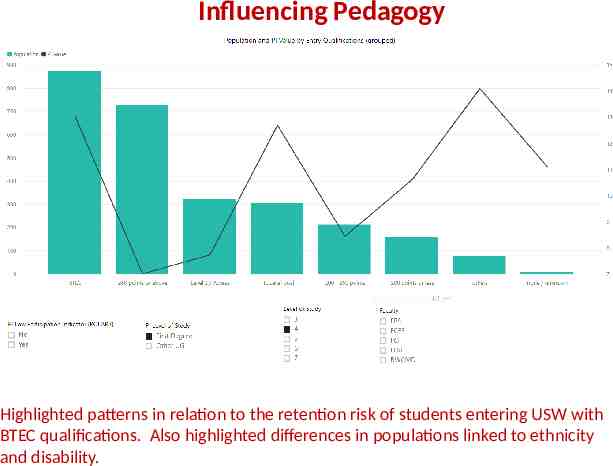
Influencing Pedagogy Highlighted patterns in relation to the retention risk of students entering USW with BTEC qualifications. Also highlighted differences in populations linked to ethnicity and disability.
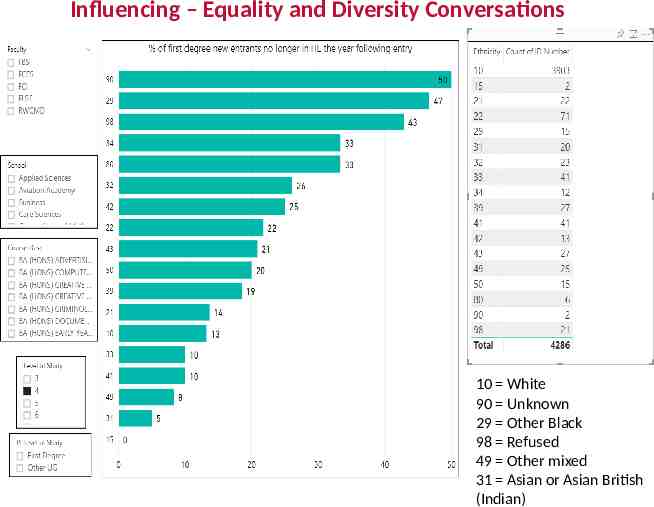
Influencing – Equality and Diversity Conversations 10 White 90 Unknown 29 Other Black 98 Refused 49 Other mixed 31 Asian or Asian British (Indian)
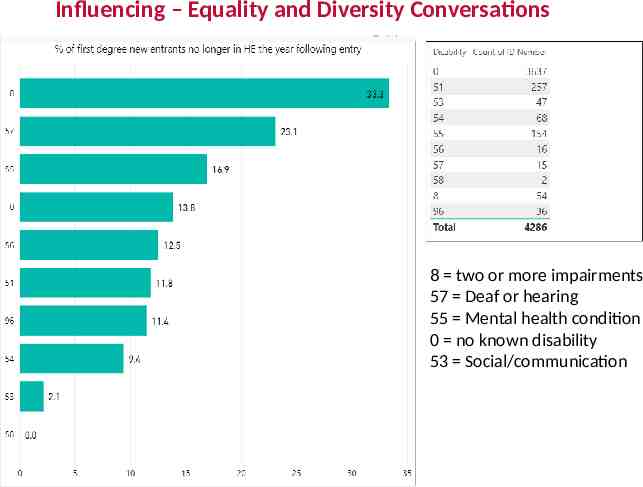
Influencing – Equality and Diversity Conversations 8 two or more impairments 57 Deaf or hearing 55 Mental health condition 0 no known disability 53 Social/communication
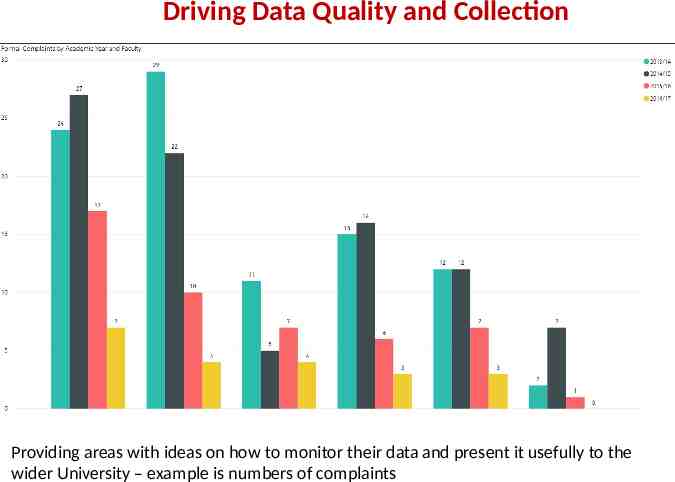
Driving Data Quality and Collection Providing areas with ideas on how to monitor their data and present it usefully to the wider University – example is numbers of complaints
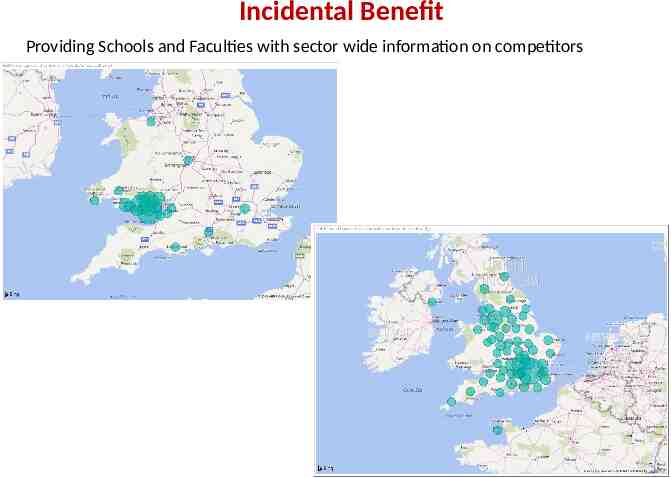
Incidental Benefit Providing Schools and Faculties with sector wide information on competitors
But none of this is about data
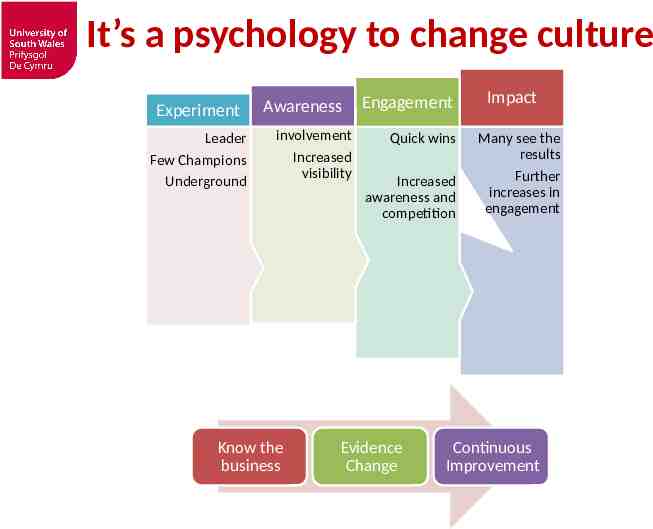
It’s a psychology to change culture Experiment Leader Few Champions Underground Awareness Minority involvement Increased visibility Know the business Engagement Quick wins Increased awareness and competition Evidence Change Impact Many see the results Further increases in engagement Continuous Improvement
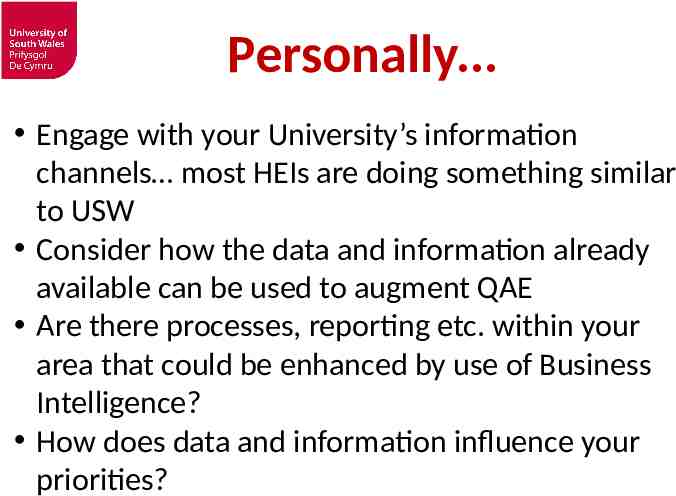
Personally. Engage with your University’s information channels most HEIs are doing something similar to USW Consider how the data and information already available can be used to augment QAE Are there processes, reporting etc. within your area that could be enhanced by use of Business Intelligence? How does data and information influence your priorities?
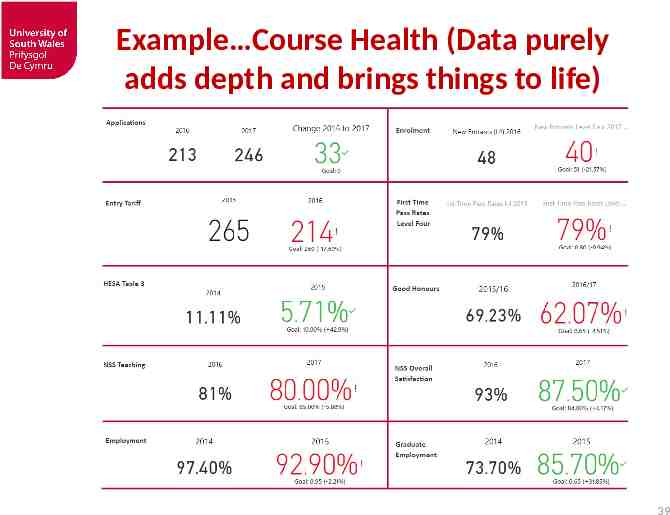
Example Course Health (Data purely adds depth and brings things to life) 39
Questions? Discussion .