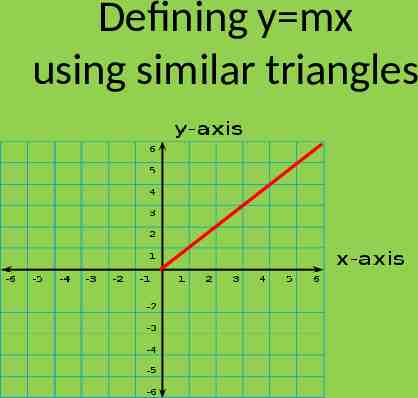
Defining y=mx using similar triangles
25 Slides448.00 KB
Defining y mx using similar triangles
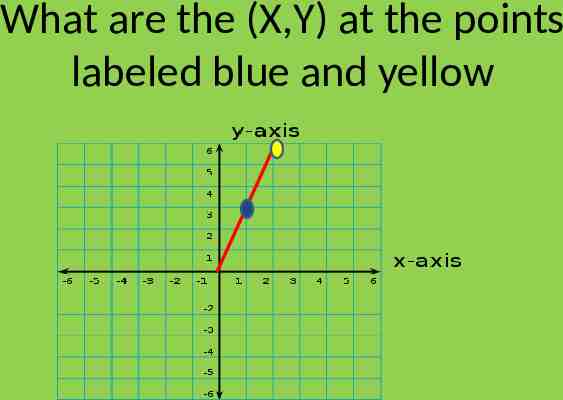
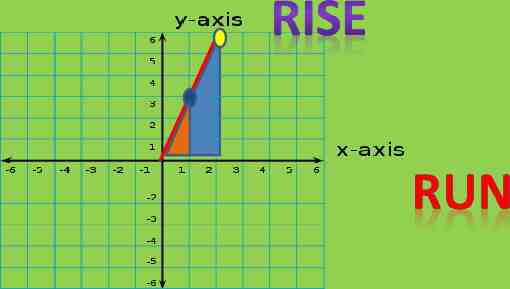
What are the (X,Y) at the points labeled blue and yellow
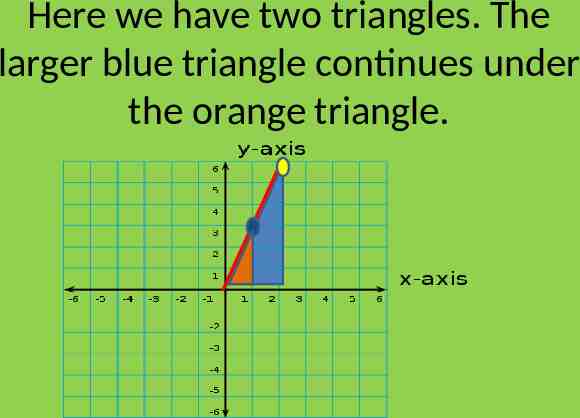
Here we have two triangles. The larger blue triangle continues under the orange triangle.
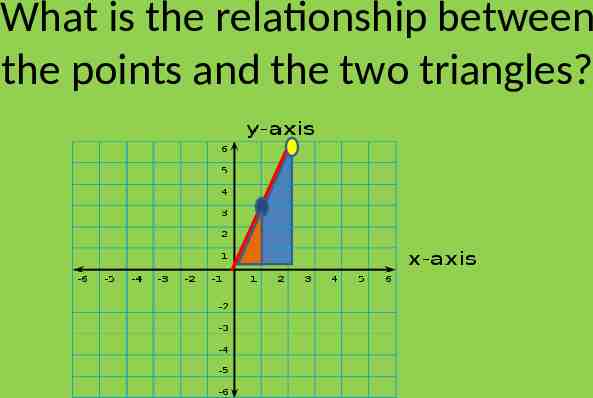
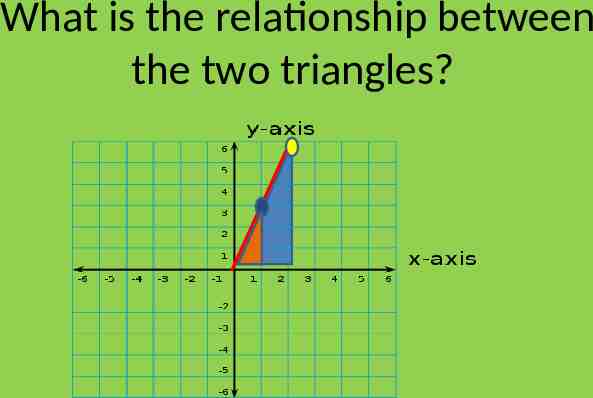
What is the relationship between the points and the two triangles?
What is the relationship between the two triangles?
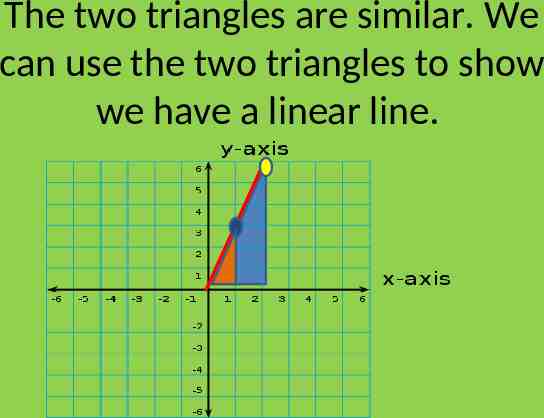
The two triangles are similar. We can use the two triangles to show we have a linear line.
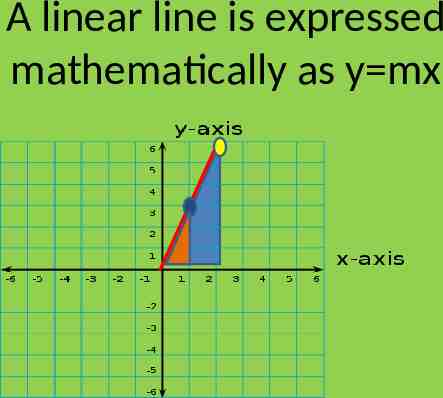
A linear line is expressed mathematically as y mx
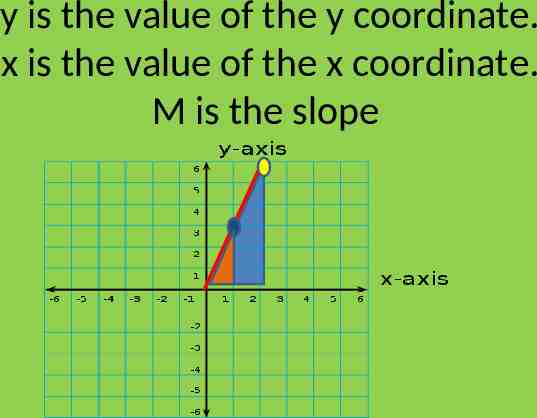
y is the value of the y coordinate. x is the value of the x coordinate. M is the slope
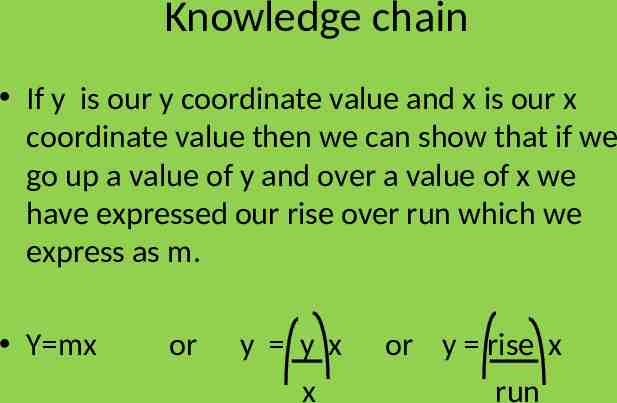
Knowledge chain If y is our y coordinate value and x is our x coordinate value then we can show that if we go up a value of y and over a value of x we have expressed our rise over run which we express as m. Y mx or y y x x or y rise x run
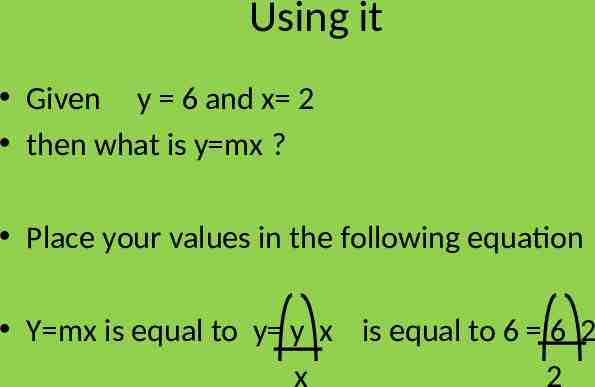
Using it Given y 6 and x 2 then what is y mx ? Place your values in the following equation Y mx is equal to y y x is equal to 6 6 2 x 2
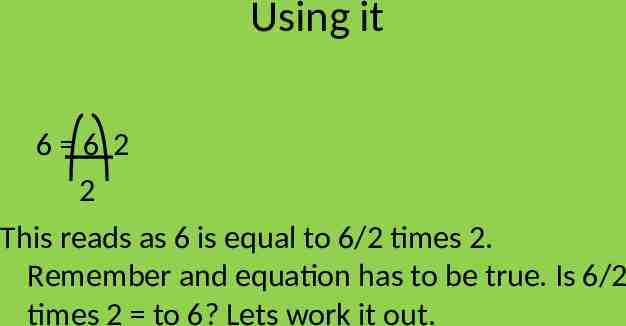
Using it 6 6 2 2 This reads as 6 is equal to 6/2 times 2. Remember and equation has to be true. Is 6/2 times 2 to 6? Lets work it out.
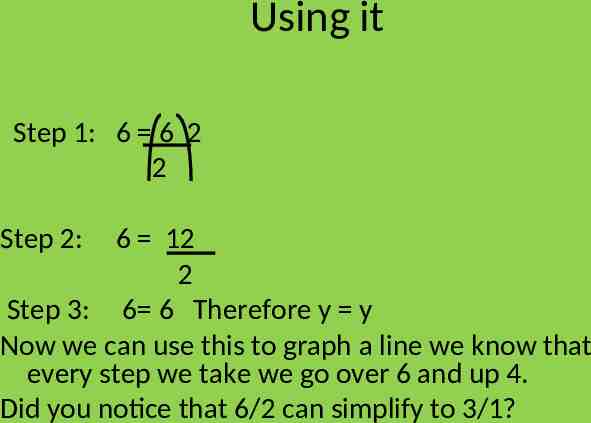
Using it Step 1: 6 6 2 2 Step 2: 6 12 2 Step 3: 6 6 Therefore y y Now we can use this to graph a line we know that every step we take we go over 6 and up 4. Did you notice that 6/2 can simplify to 3/1?
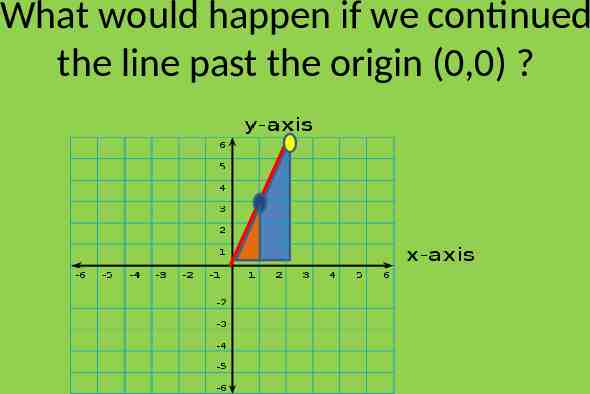
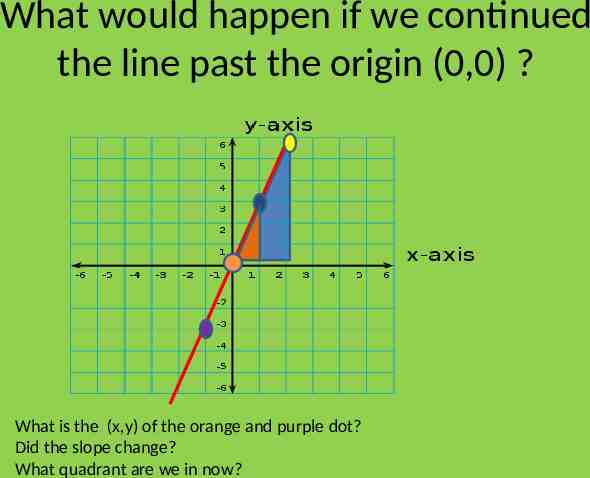
What would happen if we continued the line past the origin (0,0) ?
What would happen if we continued the line past the origin (0,0) ? What is the (x,y) of the orange and purple dot? Did the slope change? What quadrant are we in now?
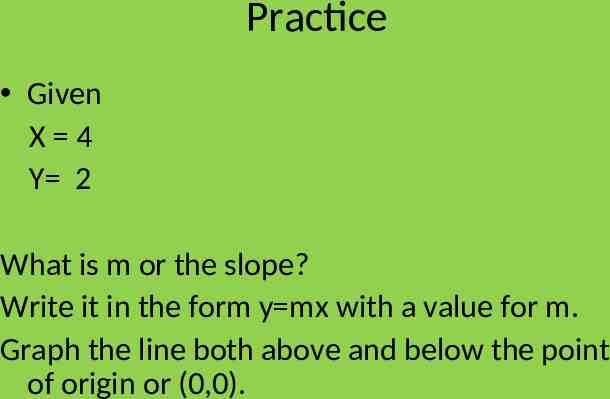
Practice Given X 4 Y 2 What is m or the slope? Write it in the form y mx with a value for m. Graph the line both above and below the point of origin or (0,0).
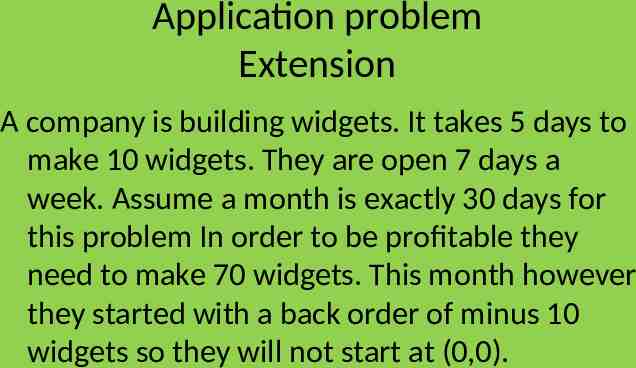
Application problem Extension A company is building widgets. It takes 5 days to make 10 widgets. They are open 7 days a week. Assume a month is exactly 30 days for this problem In order to be profitable they need to make 70 widgets. This month however they started with a back order of minus 10 widgets so they will not start at (0,0).
Solve Find the slope and line of where they will start and end the month and present production. Place the point where they want to be on the graph as well. Assume days are your x and production our y.
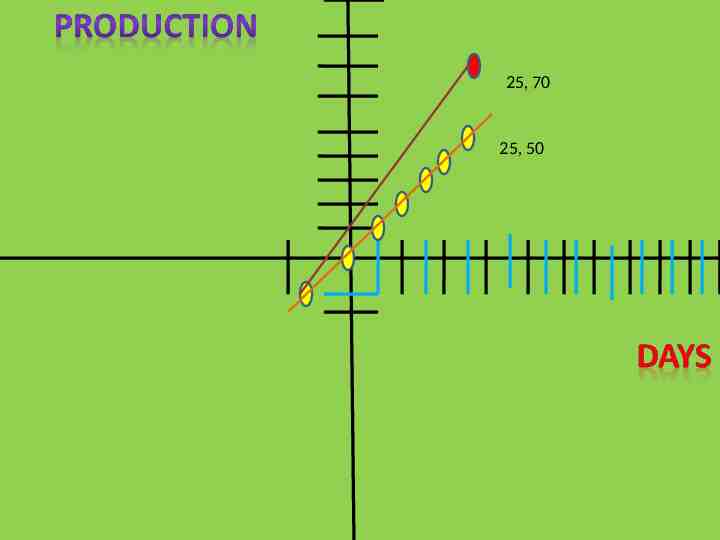
25, 70 25, 50
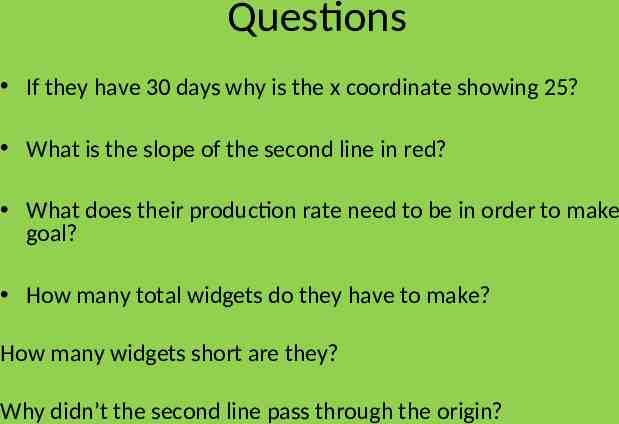
Questions If they have 30 days why is the x coordinate showing 25? What is the slope of the second line in red? What does their production rate need to be in order to make goal? How many total widgets do they have to make? How many widgets short are they? Why didn’t the second line pass through the origin?
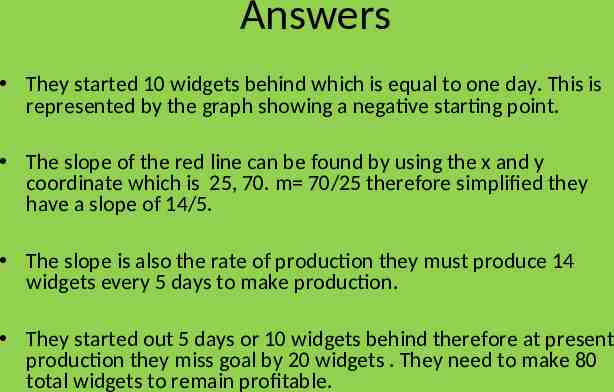
Answers They started 10 widgets behind which is equal to one day. This is represented by the graph showing a negative starting point. The slope of the red line can be found by using the x and y coordinate which is 25, 70. m 70/25 therefore simplified they have a slope of 14/5. The slope is also the rate of production they must produce 14 widgets every 5 days to make production. They started out 5 days or 10 widgets behind therefore at present production they miss goal by 20 widgets . They need to make 80 total widgets to remain profitable.
Y mx b The reason the second line did not go through the point of origin was because the linear line from the starting point to the ending point was not in the path of the point of origin. In this situation we now have another element we must take into account. The point at which a line passes though Y axis is known as b.
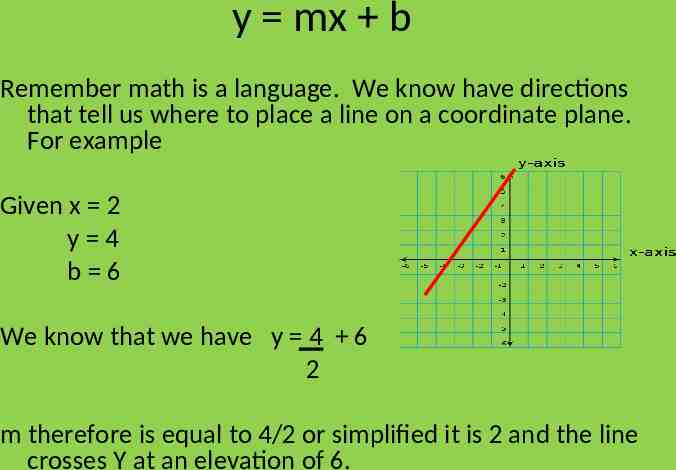
y mx b Remember math is a language. We know have directions that tell us where to place a line on a coordinate plane. For example Given x 2 y 4 b 6 We know that we have y 4 6 2 m therefore is equal to 4/2 or simplified it is 2 and the line crosses Y at an elevation of 6.
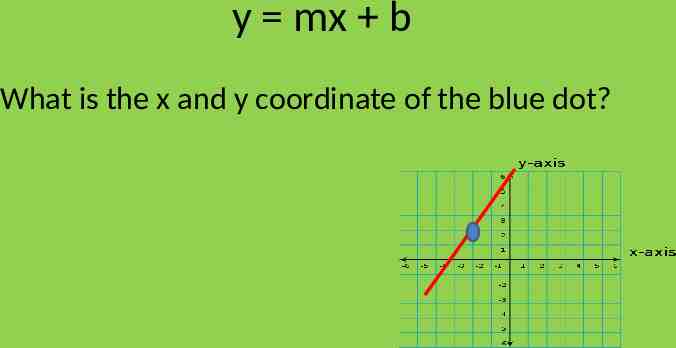
y mx b What is the x and y coordinate of the blue dot?
Practice Graph and write in y mx b form. If x 8 y 9 b 2