Database Principles Constructed by Hanh Pham based on slides from:


60 Slides6.11 MB
Database Principles Constructed by Hanh Pham based on slides from: “Database Processing, Fundamentals, Design, and Implementation”, D. Kroenke, D. Auer, Prentice Hall “Database Principles: Fundamentals of Design, Implementation, and Management”, C. Coronel, S. Morris, P.Rob Data Analytics, Data Mining, OLAP, Reporting Systems
Outlines data analytics and predictive analytics data mining online analytical processing (OLAP) How SQL extensions are used to support OLAP-type data manipulations Reporting Systems
Outlines data analytics and predictive analytics
The Need for Data Analysis Managers track daily transactions to evaluate how the business is performing Strategies should be developed to meet organizational goals using operational databases Data analysis provides information about short-term tactical evaluations and strategies
Data Analytics Subset of BI functionality Encompasses a wide range of mathematical, statistical, and modeling techniques – Purpose of extracting knowledge from data Tools can be grouped into two separate areas: – Explanatory analytics – Predictive analytics
Predictive Analytics Employs mathematical and statistical algorithms, neural networks, artificial intelligence, and other advanced modeling tools Create actionable predictive models based on available data Models are used in areas such as: – Customer relationships, customer service, customer retention, fraud detection, targeted marketing, and optimized pricing
Outlines data mining
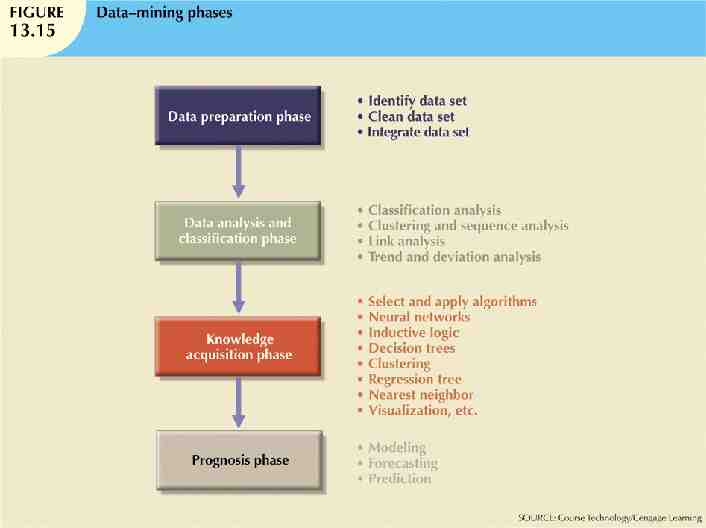
Data Mining Data-mining tools do the following: – – – – Analyze data Uncover problems or opportunities hidden in data relationships Form computer models based on their findings Use models to predict business behavior Runs in two modes – Guided – Automated
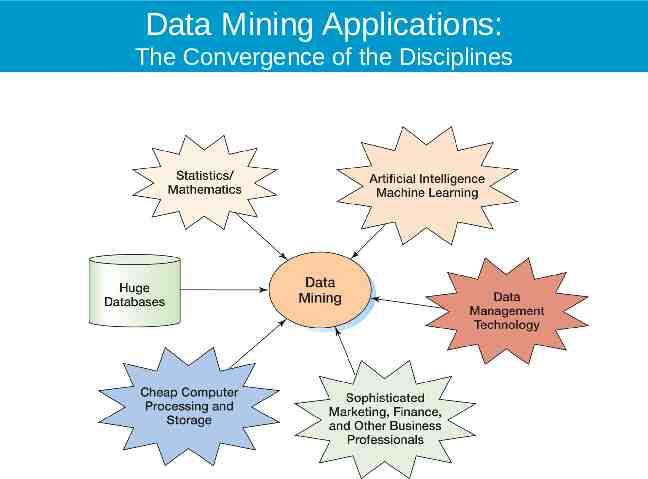
Data Mining Applications: The Convergence of the Disciplines
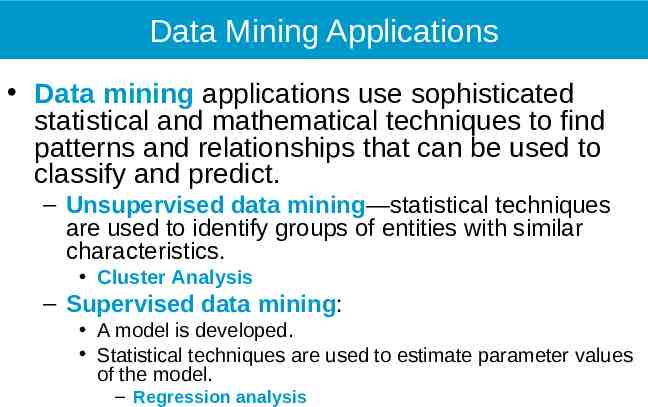
Data Mining Applications Data mining applications use sophisticated statistical and mathematical techniques to find patterns and relationships that can be used to classify and predict. – Unsupervised data mining—statistical techniques are used to identify groups of entities with similar characteristics. Cluster Analysis – Supervised data mining: A model is developed. Statistical techniques are used to estimate parameter values of the model. – Regression analysis
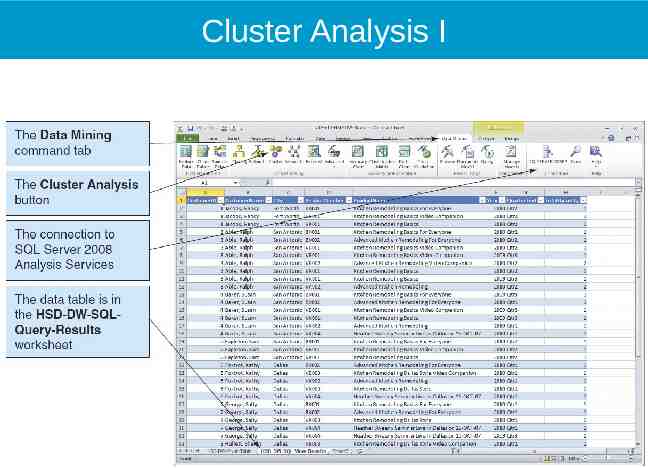
Cluster Analysis I
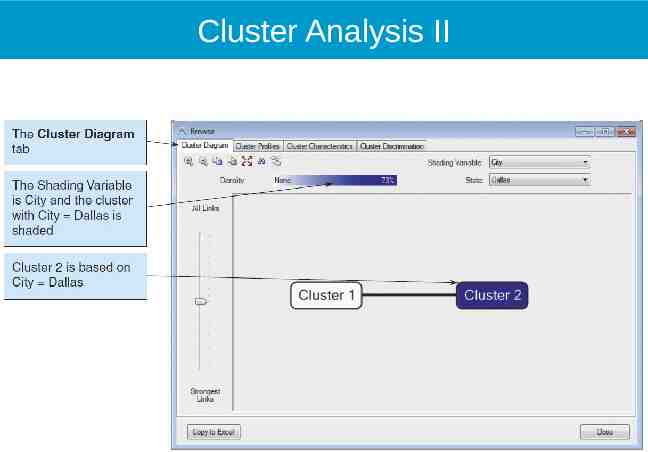
Cluster Analysis II
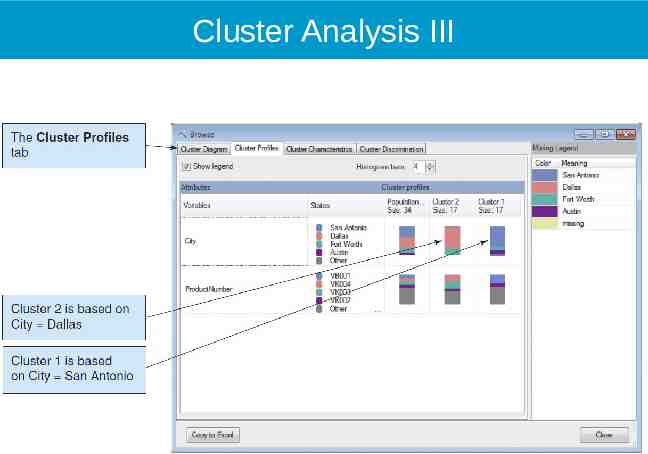
Cluster Analysis III
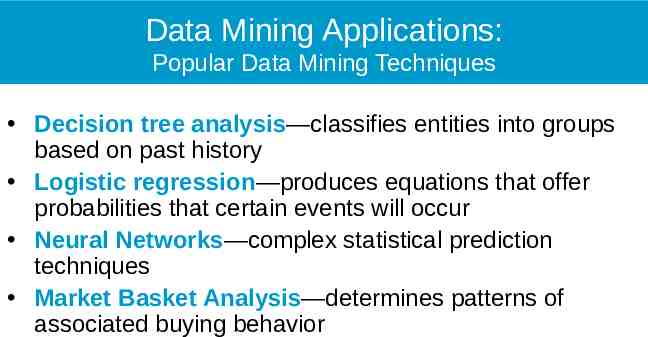
Data Mining Applications: Popular Data Mining Techniques Decision tree analysis—classifies entities into groups based on past history Logistic regression—produces equations that offer probabilities that certain events will occur Neural Networks—complex statistical prediction techniques Market Basket Analysis—determines patterns of associated buying behavior
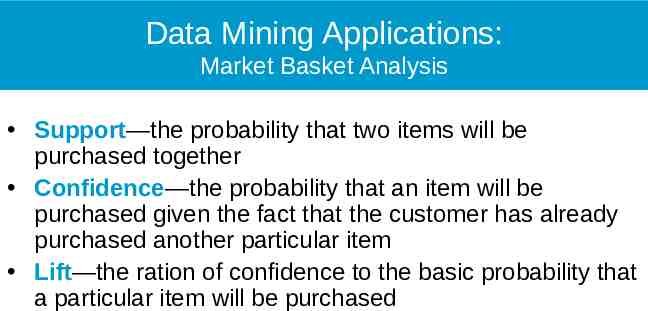
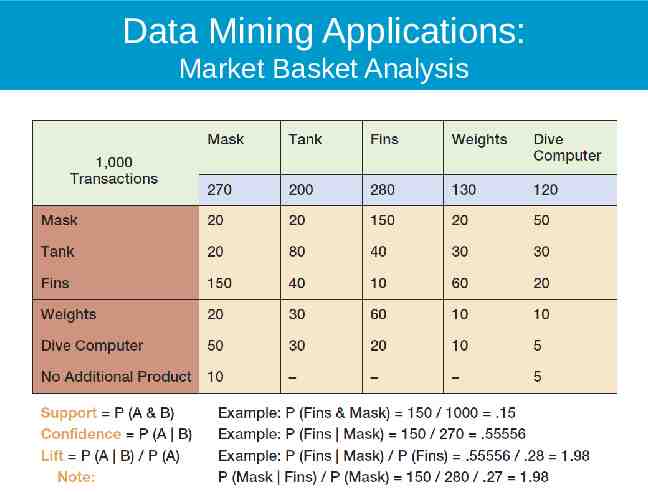
Data Mining Applications: Market Basket Analysis Support—the probability that two items will be purchased together Confidence—the probability that an item will be purchased given the fact that the customer has already purchased another particular item Lift—the ration of confidence to the basic probability that a particular item will be purchased
Data Mining Applications: Market Basket Analysis
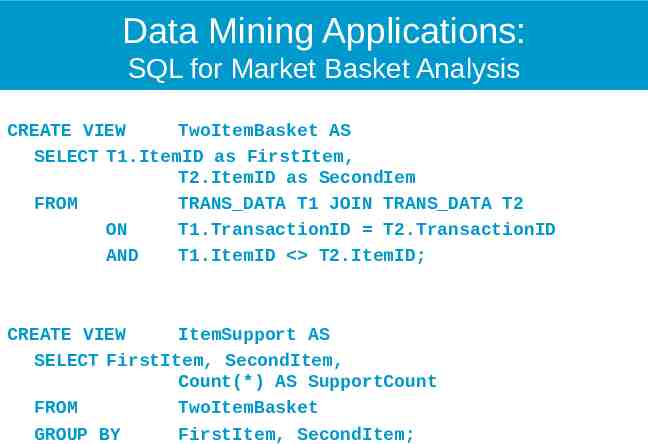
Data Mining Applications: SQL for Market Basket Analysis CREATE VIEW TwoItemBasket AS SELECT T1.ItemID as FirstItem, T2.ItemID as SecondIem FROM TRANS DATA T1 JOIN TRANS DATA T2 ON T1.TransactionID T2.TransactionID AND T1.ItemID T2.ItemID; CREATE VIEW ItemSupport AS SELECT FirstItem, SecondItem, Count(*) AS SupportCount FROM TwoItemBasket GROUP BY FirstItem, SecondItem;
Outlines online analytical processing (OLAP)
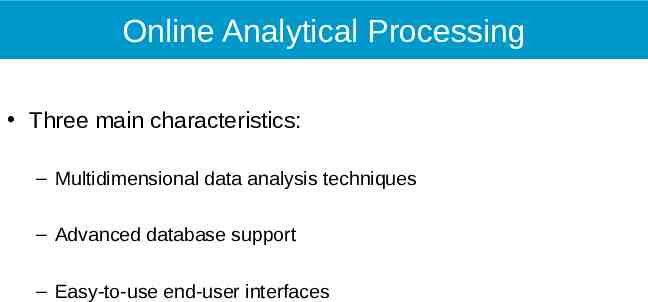
Online Analytical Processing Three main characteristics: – Multidimensional data analysis techniques – Advanced database support – Easy-to-use end-user interfaces
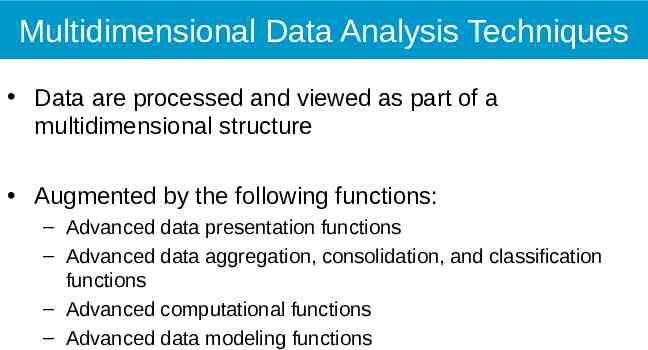
Multidimensional Data Analysis Techniques Data are processed and viewed as part of a multidimensional structure Augmented by the following functions: – Advanced data presentation functions – Advanced data aggregation, consolidation, and classification functions – Advanced computational functions – Advanced data modeling functions
Advanced Database Support Advanced data access features include: – Access to many different kinds of DBMSs, flat files, and internal and external data sources – Access to aggregated data warehouse data – Advanced data navigation – Rapid and consistent query response times – Maps end-user requests to appropriate data source and to proper data access language – Support for very large databases
Easy-to-Use End-User Interface Advanced OLAP features are more useful when access is simple Many interface features are “borrowed” from previous generations of data analysis tools – Already familiar to end users – Makes OLAP easily accepted and readily used
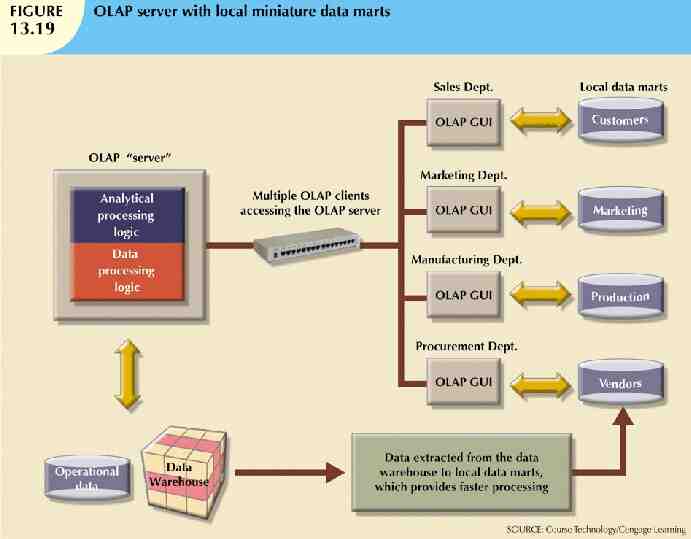
OLAP Architecture Three main architectural components: – Graphical user interface (GUI) – Analytical processing logic – Data-processing logic
OLAP Architecture (cont’d.) Designed to use both operational and data warehouse data In most implementations, data warehouse and OLAP are interrelated and complementary OLAP systems merge data warehouse and data mart approaches
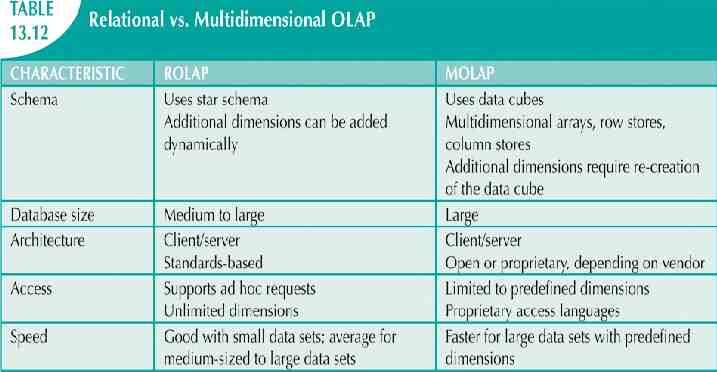
Relational OLAP Relational online analytical processing (ROLAP) provides the following extensions: – Multidimensional data schema support within the RDBMS – Data access language and query performance optimized for multidimensional data – Support for very large databases (VLDBs)
Multidimensional OLAP Multidimensional online analytical processing (MOLAP) extends OLAP functionality to multidimensional database management systems (MDBMSs) – MDBMS end users visualize stored data as a 3D data cube – Data cubes can grow to n dimensions, becoming hypercubes – To speed access, data cubes are held in memory in a cube cache
Relational vs. Multidimensional OLAP Selection of one or the other depends on evaluator’s vantage point Proper evaluation must include supported hardware, compatibility with DBMS, etc. ROLAP and MOLAP vendors working toward integration within unified framework Relational databases use star schema design to handle multidimensional data
Outlines How SQL extensions are used to support OLAP-type data manipulations
SQL Extensions for OLAP Proliferation of OLAP tools fostered development of SQL extensions Many innovations have become part of standard SQL All SQL commands will work in data warehouse as expected Most queries include many data groupings and aggregations over multiple columns
The ROLLUP Extension Used with GROUP BY clause to generate aggregates by different dimensions GROUP BY generates only one aggregate for each new value combination of attributes ROLLUP extension enables subtotal for each column listed except for the last one – Last column gets grand total Order of column list important
The CUBE Extension CUBE extension used with GROUP BY clause to generate aggregates by listed columns – Includes the last column Enables subtotal for each column in addition to grand total for last column – Useful when you want to compute all possible subtotals within groupings Cross-tabulations are good candidates for application of CUBE extension
Materialized Views A dynamic table that contains SQL query command to generate rows – Also contains the actual rows Created the first time query is run and summary rows are stored in table Automatically updated when base tables are updated
Outlines Reporting Systems
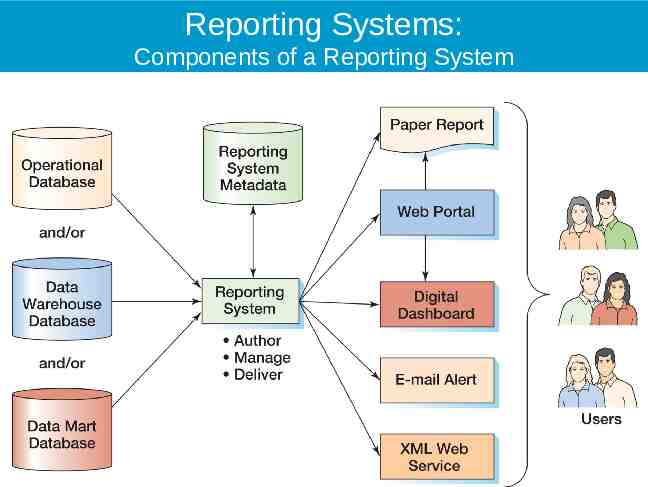
Reporting Systems: Components of a Reporting System
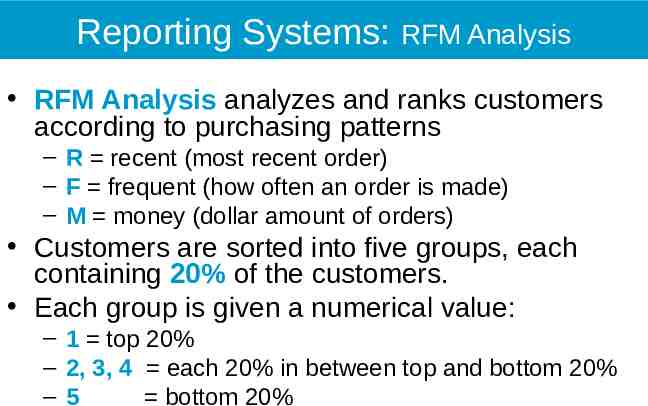
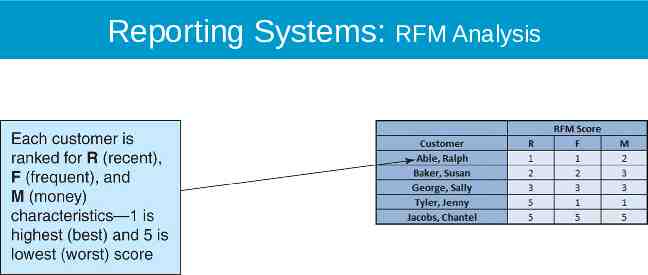
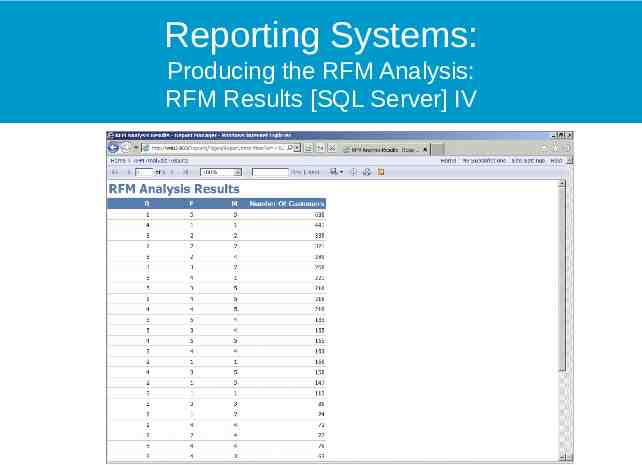
Reporting Systems: RFM Analysis RFM Analysis analyzes and ranks customers according to purchasing patterns – R recent (most recent order) – F frequent (how often an order is made) – M money (dollar amount of orders) Customers are sorted into five groups, each containing 20% of the customers. Each group is given a numerical value: – 1 top 20% – 2, 3, 4 each 20% in between top and bottom 20% –5 bottom 20%
Reporting Systems: RFM Analysis
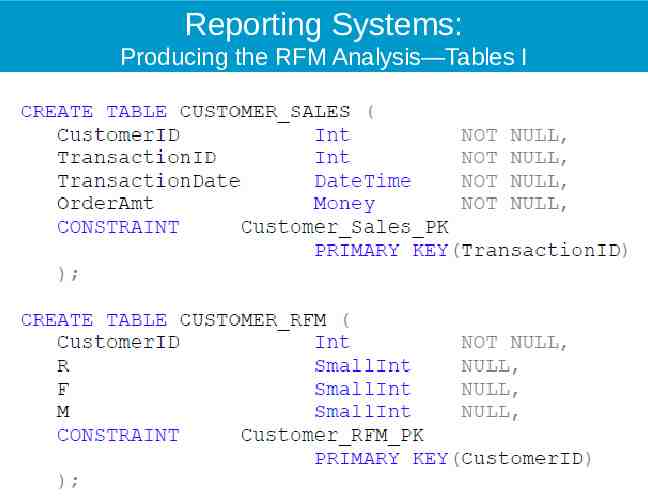
Reporting Systems: Producing the RFM Analysis—Tables I
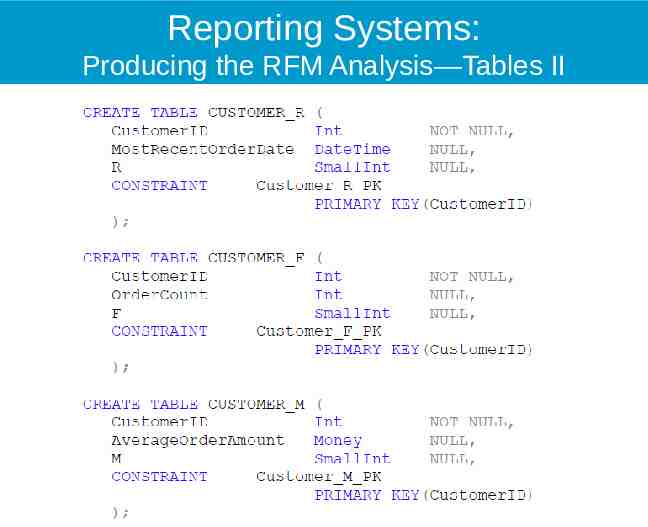
Reporting Systems: Producing the RFM Analysis—Tables II
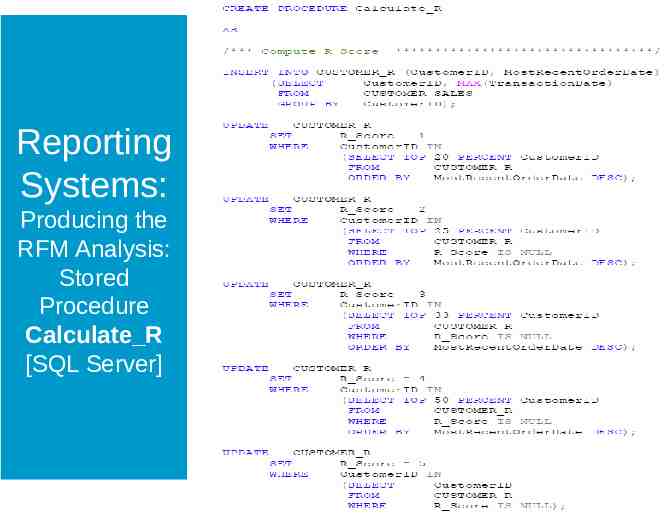
Reporting Systems: Producing the RFM Analysis: Stored Procedure Calculate R [SQL Server]
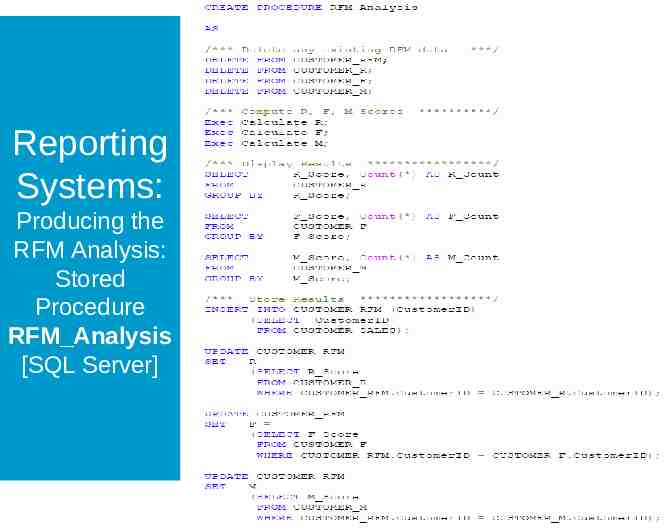
Reporting Systems: Producing the RFM Analysis: Stored Procedure RFM Analysis [SQL Server]
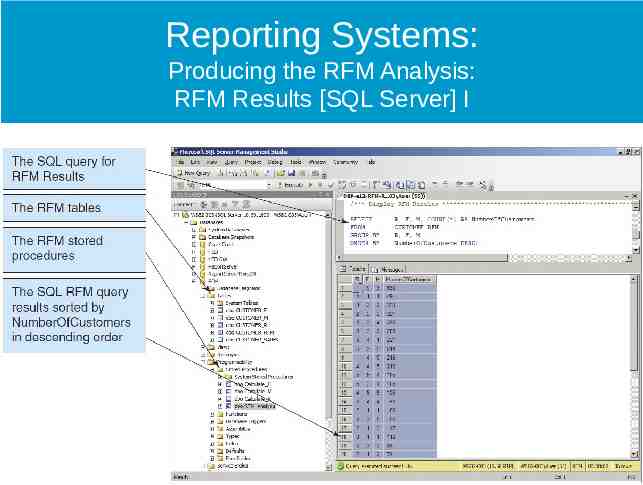
Reporting Systems: Producing the RFM Analysis: RFM Results [SQL Server] I
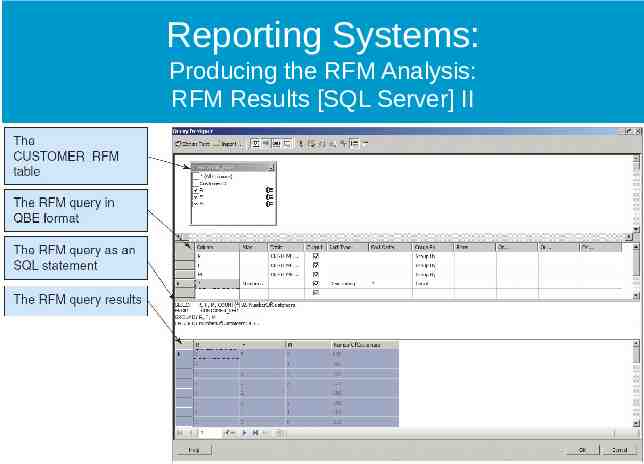
Reporting Systems: Producing the RFM Analysis: RFM Results [SQL Server] II
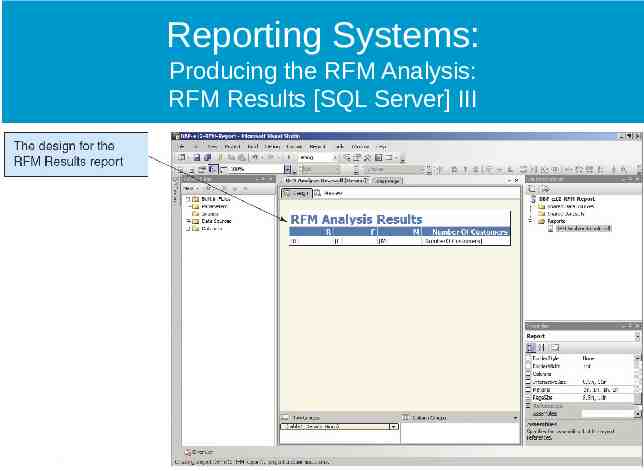
Reporting Systems: Producing the RFM Analysis: RFM Results [SQL Server] III
Reporting Systems: Producing the RFM Analysis: RFM Results [SQL Server] IV
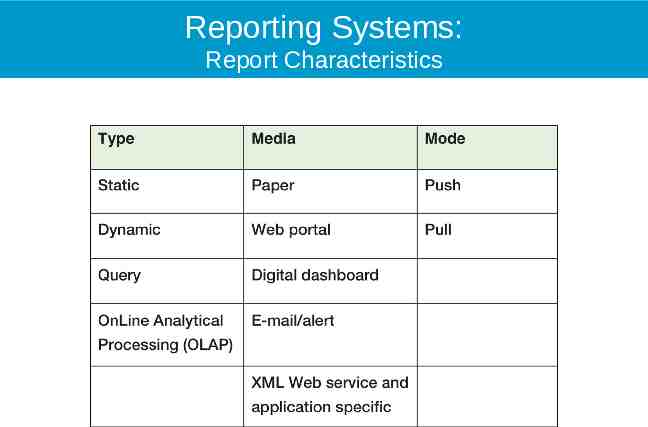
Reporting Systems: Report Characteristics
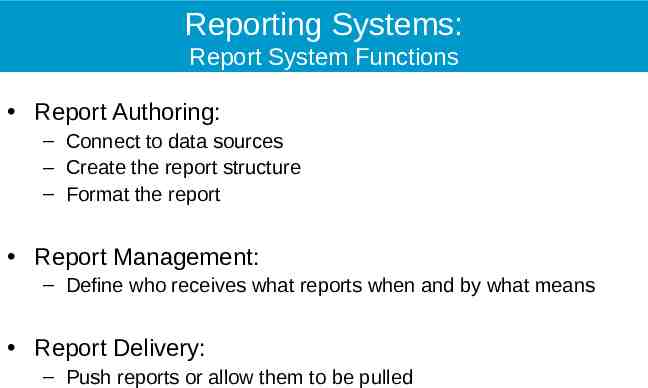
Reporting Systems: Report System Functions Report Authoring: – Connect to data sources – Create the report structure – Format the report Report Management: – Define who receives what reports when and by what means Report Delivery: – Push reports or allow them to be pulled
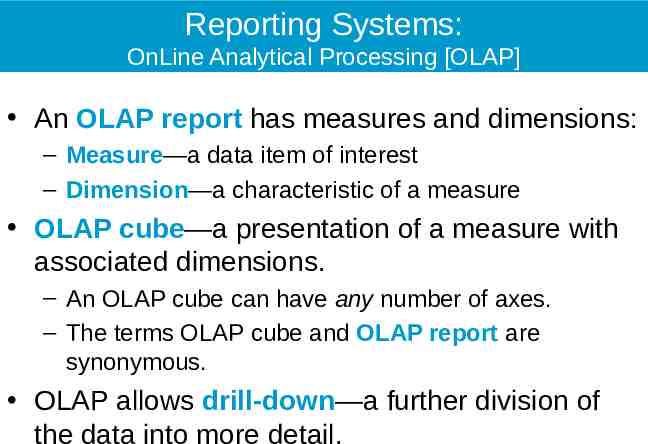
Reporting Systems: OnLine Analytical Processing [OLAP] An OLAP report has measures and dimensions: – Measure—a data item of interest – Dimension—a characteristic of a measure OLAP cube—a presentation of a measure with associated dimensions. – An OLAP cube can have any number of axes. – The terms OLAP cube and OLAP report are synonymous. OLAP allows drill-down—a further division of the data into more detail.
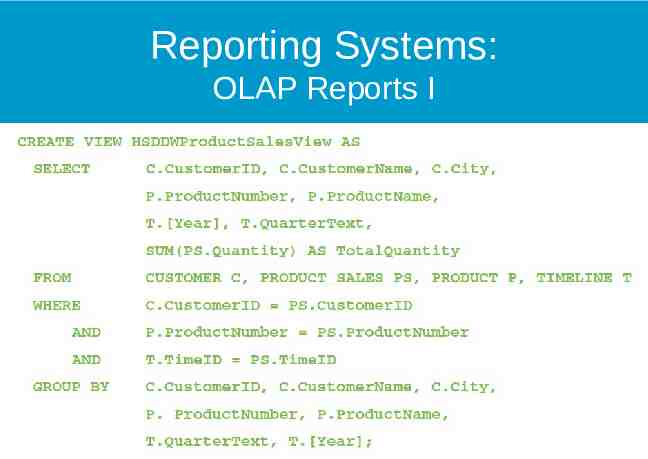
Reporting Systems: OLAP Reports I
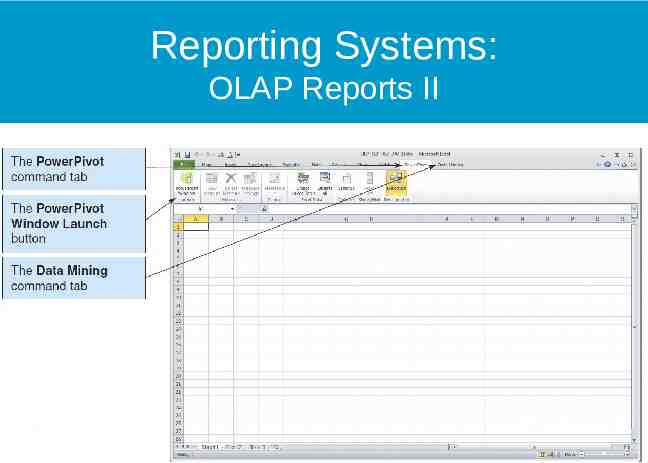
Reporting Systems: OLAP Reports II
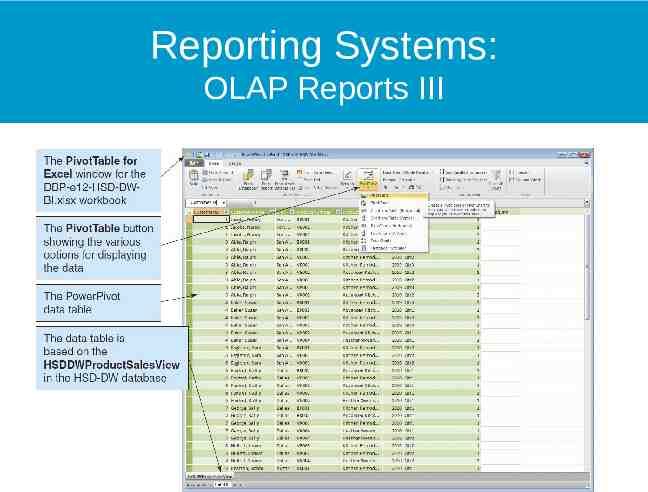
Reporting Systems: OLAP Reports III
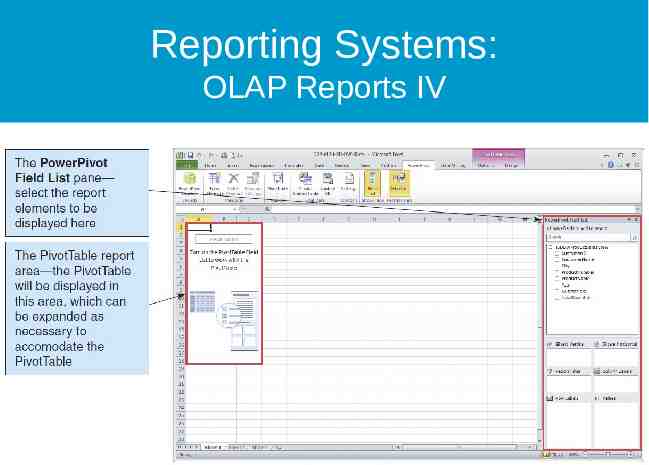
Reporting Systems: OLAP Reports IV
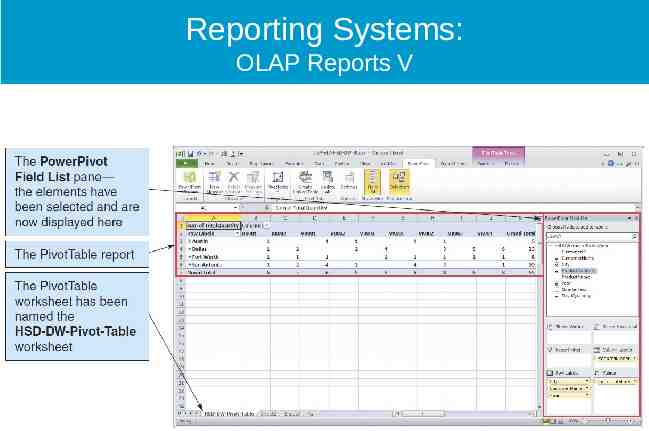
Reporting Systems: OLAP Reports V
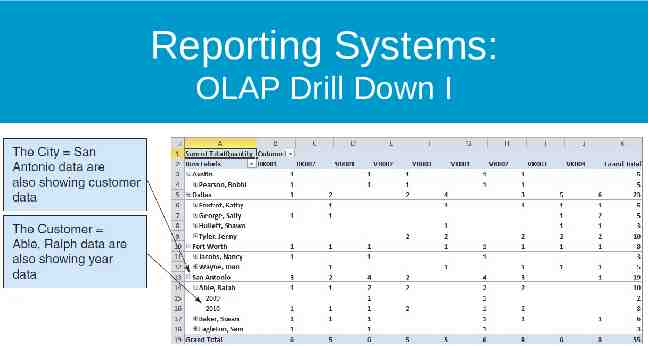
Reporting Systems: OLAP Drill Down I
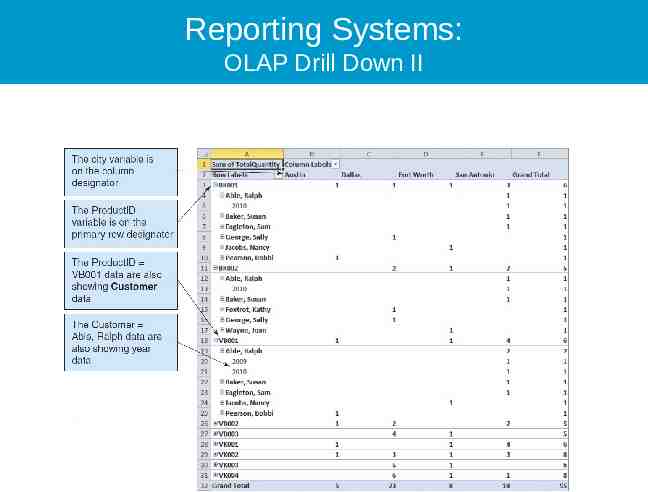
Reporting Systems: OLAP Drill Down II
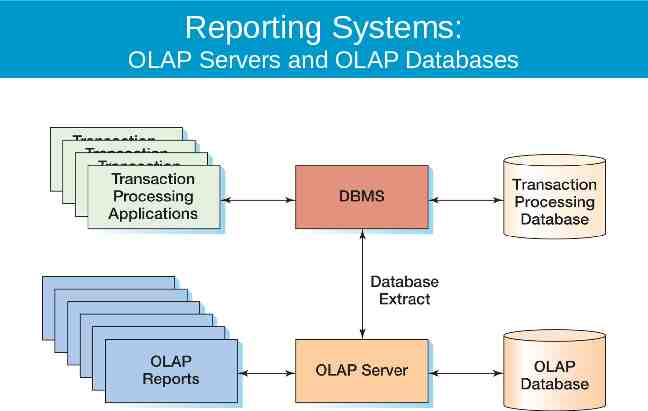
Reporting Systems: OLAP Servers and OLAP Databases
Summary Data analytics – Provides advanced data analysis tools to extract knowledge from business data Data mining – Automates the analysis of operational data to find previously unknown data characteristics, relationships, dependencies, and trends Predictive analytics – Uses information generated in the data-mining phase to create advanced predictive models
Summary (cont’d.) Online analytical processing (OLAP) – Advanced data analysis environment that supports decision making, business modeling, and operations research SQL has been enhanced with extensions that support OLAP-type processing and data generation