CSC 2515 2008 Lecture 10 Support Vector Machines Geoffrey Hinton


35 Slides410.50 KB
CSC 2515 2008 Lecture 10 Support Vector Machines Geoffrey Hinton
Getting good generalization on big datasets If we have a big data set that needs a complicated model, the full Bayesian framework is very computationally expensive. Is there a frequentist method that is faster but still generalizes well?
Preprocessing the input vectors Instead of trying to predict the answer directly from the raw inputs we could start by extracting a layer of “features”. – Sensible if we already know that certain combinations of input values would be useful (e.g. edges or corners in an image). Instead of learning the features we could design them by hand. – The hand-coded features are equivalent to a layer of non-linear neurons that do not need to be learned. – If we use a very big set of features for a two-class problem, the classes will almost certainly be linearly separable. But surely the linear separator will give poor generalization.
Is preprocessing cheating? Its cheating if we use a carefully designed set of taskspecific, hand-coded features and then claim that the learning algorithm solved the whole problem. – The really hard bit is done by designing the features. Its not cheating if we learn the non-linear preprocessing. – This makes learning much more difficult and much more interesting (e.g. backpropagation after pre-training) Its not cheating if we use a very big set of non-linear features that is task-independent. – Support Vector Machines do this. – They have a clever way to prevent overfitting (first half of lecture) – They have a very clever way to use a huge number of features without requiring nearly as much computation as seems to be necessary (second half of lecture).
A hierarchy of model classes Some model classes can be arranged in a hierarchy of increasing complexity. How do we pick the best level in the hierarchy for modeling a given dataset?
A way to choose a model class We want to get a low error rate on unseen data. – This is called “structural risk minimization” It would be really helpful if we could get a guarantee of the following form: Test error rate train error rate f(N, h, p) Where N size of training set, h measure of the model complexity, p the probability that this bound fails We need p to allow for really unlucky test sets. Then we could choose the model complexity that minimizes the bound on the test error rate.
A weird measure of model complexity Suppose that we pick n datapoints and assign labels of or – to them at random. If our model class (e.g. a neural net with a certain number of hidden units) is powerful enough to learn any association of labels with the data, its too powerful! Maybe we can characterize the power of a model class by asking how many datapoints it can “shatter” i.e. learn perfectly for all possible assignments of labels. – This number of datapoints is called the VapnikChervonenkis dimension. – The model does not need to shatter all sets of datapoints of size h. One set is sufficient. For planes in 3-D, h 4 even though 4 co-planar points cannot be shattered.
An example of VC dimension Suppose our model class is a hyperplane. In 2-D, we can find a plane (i.e. a line) to deal with any labeling of three points. A 2-D hyperplane shatters 3 points But we cannot deal with some of the possible labelings of four points. A 2-D hyperplane (i.e. a line) does not shatter 4 points.
Some examples of VC dimension The VC dimension of a hyperplane in 2-D is 3. – In k dimensions it is k 1. Its just a coincidence that the VC dimension of a hyperplane is almost identical to the number of parameters it takes to define a hyperplane. A sine wave has infinite VC dimension and only 2 parameters! By choosing the phase and period carefully we can shatter any random collection of one-dimensional datapoints (except for nasty special cases). f ( x) a sin(b x)
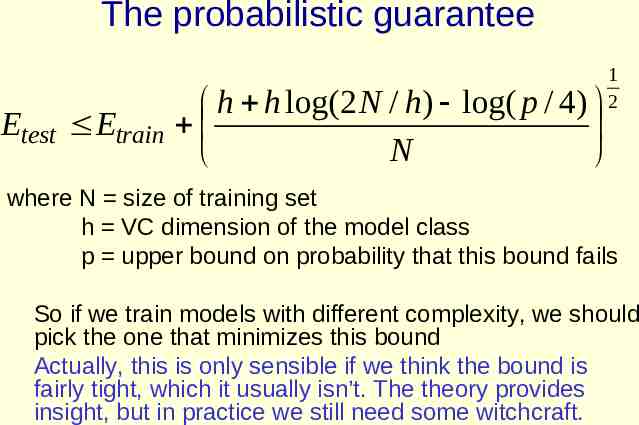
The probabilistic guarantee Etest h h log(2 N / h) log( p / 4) Etrain N 1 2 where N size of training set h VC dimension of the model class p upper bound on probability that this bound fails So if we train models with different complexity, we should pick the one that minimizes this bound Actually, this is only sensible if we think the bound is fairly tight, which it usually isn’t. The theory provides insight, but in practice we still need some witchcraft.
Preventing overfitting when using big sets of features Suppose we use a big set of features to ensure that the two classes are linearly separable. What is the best separating line to use? The Bayesian answer is to use them all (including ones that do not quite separate the data.) Weight each line by its posterior probability (i.e. by a combination of how well it fits the data and how well it fits the prior). Is there an efficient way to approximate the correct Bayesian answer?
Support Vector Machines The line that maximizes the minimum margin is a good bet. – The model class of “hyper-planes with a margin of m” has a low VC dimension if m is big. This maximum-margin separator is determined by a subset of the datapoints. – Datapoints in this subset are called “support vectors”. – It will be useful computationally if only a small fraction of the datapoints are support vectors, because we use the support vectors to decide which side of the separator a test case is on. The support vectors are indicated by the circles around them.
Training a linear SVM To find the maximum margin separator, we have to solve the following optimization problem: w.x c b 1 for positive cases w.x c b 1 for negative cases and w 2 is as small as possible This is tricky but it’s a convex problem. There is only one optimum and we can find it without fiddling with learning rates or weight decay or early stopping. – Don’t worry about the optimization problem. It has been solved. Its called quadratic programming. – It takes time proportional to N 2 which is really bad for very big datasets so for big datasets we end up doing approximate optimization!
Testing a linear SVM The separator is defined as the set of points for which: w.x b 0 so if w.x c b 0 say its a positive case and if w.x c b 0 say its a negative case
A Bayesian Interpretation Using the maximum margin separator often gives a pretty good approximation to using all separators weighted by their posterior probabilities.
What to do if there is no separating plane Use a much bigger set of features. – This looks as if it would make the computation hopelessly slow, but in the next part of the lecture we will see how to use the “kernel” trick to make the computation fast even with huge numbers of features. Extend the definition of maximum margin to allow non-separating planes. – This can be done by using “slack” variables
Introducing slack variables Slack variables are constrained to be non-negative. When they are greater than zero they allow us to cheat by putting the plane closer to the datapoint than the margin. So we need to minimize the amount of cheating. This means we have to pick a value for lamba (this sounds familiar!) w.x c b 1 c for positive cases w.x c b 1 c for negative cases with c 0 for all c w 2 and c 2 c as small as possible
A picture of the best plane with a slack variable
The story so far If we use a large set of non-adaptive features, we can often make the two classes linearly separable. – But if we just fit any old separating plane, it will not generalize well to new cases. If we fit the separating plane that maximizes the margin (the minimum distance to any of the data points), we will get much better generalization. – Intuitively, by maximizing the margin we are squeezing out all the surplus capacity that came from using a high-dimensional feature space. This can be justified by a whole lot of clever mathematics which shows that – large margin separators have lower VC dimension. – models with lower VC dimension have a smaller gap between the training and test error rates.
Why do large margin separators have lower VC dimension? Consider a random set of N points that all fit inside a unit hypercube. If the number of dimensions is bigger than N-2, it is easy to find a separating plane for any labeling of the points. – So the fact that there is a separating plane doesn’t tell us much. It like putting a straight line through 2 data points. But there is unlikely to be a separating plane with a margin that is big – If we find such a plane its unlikely to be a coincidence. So it will probably apply to the test data too.
How to make a plane curved Fitting hyperplanes as separators is mathematically easy. – The mathematics is linear. By replacing the raw input variables with a much larger set of features we get a nice property: – A planar separator in the high-dimensional space of feature vectors is a curved separator in the low dimensional space of the raw input variables. A planar separator in a 20-D feature space projected back to the original 2-D space
A potential problem and a magic solution If we map the input vectors into a very high-dimensional feature space, surely the task of finding the maximummargin separator becomes computationally intractable? – The mathematics is all linear, which is good, but the vectors have a huge number of components. – So taking the scalar product of two vectors is very expensive. The way to keep things tractable is to use “the kernel trick” The kernel trick makes your brain hurt when you first learn about it, but its actually very simple.
What the kernel trick achieves All of the computations that we need to do to find the maximum-margin separator can be expressed in terms of scalar products between pairs of datapoints (in the highdimensional feature space). These scalar products are the only part of the computation that depends on the dimensionality of the high-dimensional space. – So if we had a fast way to do the scalar products we would not have to pay a price for solving the learning problem in the high-D space. The kernel trick is just a magic way of doing scalar products a whole lot faster than is usually possible. – It relies on choosing a way of mapping to the highdimensional feature space that allows fast scalar products.
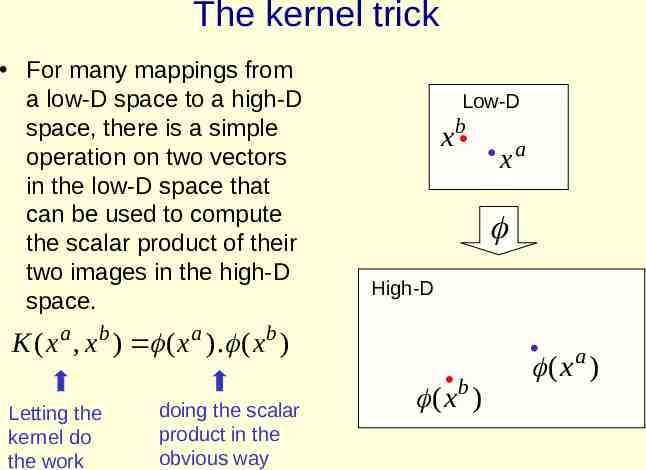
The kernel trick For many mappings from a low-D space to a high-D space, there is a simple operation on two vectors in the low-D space that can be used to compute the scalar product of their two images in the high-D space. Low-D xb High-D K ( x a , x b ) ( x a ) . ( x b ) Letting the kernel do the work doing the scalar product in the obvious way xa ( xb ) (xa )
Dealing with the test data If we choose a mapping to a high-D space for which the kernel trick works, we do not have to pay a computational price for the highdimensionality when we find the best hyper-plane. – We cannot express the hyperplane by using its normal vector in the high-dimensional space because this vector would have a huge number of components. – Luckily, we can express it in terms of the support vectors. But what about the test data. We cannot compute the scalar product w . (x) because its in the high-D space.
Dealing with the test data We need to decide which side of the separating hyperplane a test point lies on and this requires us to compute a scalar product. We can express this scalar product as a weighted average of scalar products with the stored support vectors – This could still be slow if there are a lot of support vectors .
The classification rule The final classification rule is quite simple: bias ws K ( x test s ,x ) 0 s SV The set of support vectors All the cleverness goes into selecting the support vectors that maximize the margin and computing the weight to use on each support vector. We also need to choose a good kernel function and we may need to choose a lambda for dealing with nonseparable cases.
Some commonly used kernels Polynomial: K (x, y ) (x.y 1) p Gaussian radial basis function K (x, y ) e Neural net: K (x, y ) tanh ( k x.y ) x y 2 / 2 2 Parameters that the user must choose For the neural network kernel, there is one “hidden unit” per support vector, so the process of fitting the maximum margin hyperplane decides how many hidden units to use. Also, it may violate Mercer’s condition.
Performance Support Vector Machines work very well in practice. – The user must choose the kernel function and its parameters, but the rest is automatic. – The test performance is very good. They can be expensive in time and space for big datasets – The computation of the maximum-margin hyper-plane depends on the square of the number of training cases. – We need to store all the support vectors. SVM’s are very good if you have no idea about what structure to impose on the task. The kernel trick can also be used to do PCA in a much higher-dimensional space, thus giving a non-linear version of PCA in the original space.
Support Vector Machines are Perceptrons! SVM’s use each training case, x, to define a feature K(x, .) where K is chosen by the user. – So the user designs the features. Then they do “feature selection” by picking the support vectors, and they learn how to weight the features by solving a big optimization problem. So an SVM is just a very clever way to train a standard perceptron. – All of the things that a perceptron cannot do cannot be done by SVM’s (but it’s a long time since 1969 so people have forgotten this).
A problem that cannot be solved using a kernel that computes the similarity of a test image to a training case Suppose we have images that may contain a tank, but with a cluttered background. To recognize which ones contain a tank, it is no good computing a global similarity – A non-tank test image may have a very similar background to a tank training image, so it will have very high similarity if the tanks are only a small fraction of the image. We need local features that are appropriate for the task. So they must be learned, not pre-specified. Its very appealing to convert a learning problem to a convex optimization problem – but we may end up by ignoring aspects of the real learning problem in order to make it convex.
A hybrid approach If we use a neural net to define the features, maybe we can use convex optimization for the final layer of weights and then backpropagate derivatives to “learn the kernel”. The convex optimization is quadratic in the number of training cases. So this approach works best when most of the data is unlabelled. – Unsupervised pre-training can then use the unlabelled data to learn features that are appropriate for the domain. – The final convex optimization can use these features as well as possible and also provide derivatives that allow them to be fine-tuned. – This seems better than just trying lots of kernels and selecting the best ones (which is the current method).
Learning to extract the orientation of a face patch (Ruslan Salakhutdinov)
The training and test sets 100, 500, or 1000 labeled cases 11,000 unlabeled cases face patches from new people
The root mean squared error in the orientation when combining GP’s with deep belief nets GP on the pixels GP on top-level features GP on top-level features with fine-tuning 100 labels 22.2 17.9 15.2 500 labels 17.2 12.7 7.2 1000 labels 16.3 11.2 6.4 Conclusion: The deep features are much better than the pixels. Fine-tuning helps a lot.