CPSC 695 Data Quality Issues M. L. Gavrilova 1


29 Slides1.74 MB
CPSC 695 Data Quality Issues M. L. Gavrilova 1
Decisions Decisions 2
Topics Data quality issues Factors affecting data quality Types of GIS errors Methods to deal with errors Estimating degree of errors 3
Development of computer methods for handling spatial data Computer cartography Spatial statistics Computer cartography (digital mapping) is the generation, storage and editing of maps using a computer. Initially, developments were in areas such as measures of spatial distribution, three-dimensional analysis, network analysis and modeling techniques. CAD Computer-aided design (CAD) is used to enter and manipulate graphics data, whereas GIS is used to store and analise spatial data. Traditional users of CAD used CAD for the production, maintenance and analysis of design graphics. 4
Causes of errors in spatial data Measurement errors: accuracy (ex. altitude measurement or soil samples, usually related to instruments) Computational errors: precision (ex. to what decimal point the data is represented?) Human error: error in using instruments, selecting scale, location of samples Data model representation errors Errors in derived data 5
What type of error? 6
Factors affecting reliability of GIS data Age of data – collected at different times Arial coverage Map scale and resolution Density of observations Data formats and exchanges in formats Accessibility 7
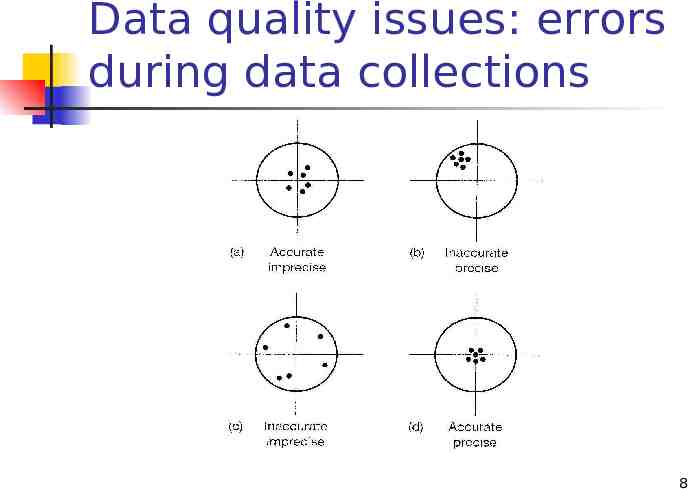
Data quality issues: errors during data collections 8
Data quality issues: Sources of error in GIS Errors arising from our understanding and modeling of reality The different ways in which people perceive reality can have effects on how they model the world using GIS. Errors in source data for GIS Survey data can contain errors due to mistakes made by people operating equipment, or due to technical problems with equipment. Remotely sensed, and aerial photography data could have spatial errors if they were referenced wrongly, and mistakes in classification and interpretation would create attribute errors. 9
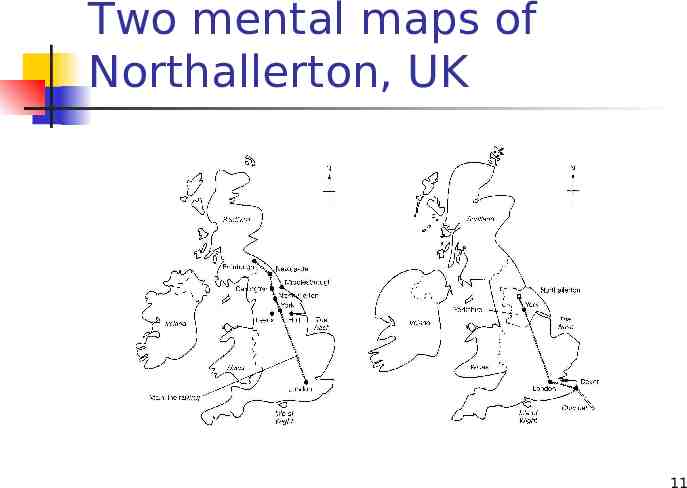
Data quality issues: Sources of error in GIS Perceptions or reality – mental mapping Your mental map of your home town or local area is your personal representation. You could commit this to paper as a sketch map if required. Figure in next slide shows two sketch map describing the location of Northallerton in the UK. They would be flawed as cartographic products, but nevertheless are a valid model of reality. Keates (1982) considers these maps to be personal, fragmentary, incomplete and frequently erroneous. In all cases, distance and shape would be distorted in inconsistent ways and the final product would be influenced by the personality and experience of the ‘cartographer’. 10
Two mental maps of Northallerton, UK 11
Operational errors introduced during manual digitizing Psychological errors: Difficulties in perceiving the true centre of the line being digitized and inability to move the cursor cross-hairs accurately along it. Physiological errors: It result from involuntary muscle spasms that give rise to random displacement. Line thickness: The thickness of lines on a map is determined by the cartographic generation employed. Method of digitizing: Point mode and stream mode 12
Topological errors in vector GIS (a) Effects of tolerance on topological cleaning (b) Topological ambiguities in raster to vector conversion 13
Vector to raster classification error 14
Rasterization errors Vector to raster conversion can cause an interesting assortment of errors in the resulting data. For example Topological errors Loss of small polygons Topological error in vector Effects of grid GIS: (a) loss of connectivity orientation and creation of false Variations in grid connectivity (b) loss of origin and datum information 15
Errors in data processing and analysis GIS operations that can introduce errors include the classification of data, aggregation or disaggregation of area data and the integration of data using overlay technique. Where a certain level of spatial resolution or a certain set of polygon boundaries are required, data sets that are not mapped with these may need to be aggregated or disaggregated to the required level. 16
Attribute error due to processing Attribute error result from positional error (such as the missing ‘hole’ feature in map A that is present as an island in map B). If one of the two maps that overlaid contains an error, then a classification error will result in the composite map (polygon BA). 17
GIS project design and management errors 18
Project management and human error Measuring error Typos/drawing errors Incorrect implementation error Planning/coordination error Incorrect use of devices error Erroneous methodology error Other human errors 19
Geometry related errors Rounding errors Processing errors Geometric coordinate transformation Map scanning, geometric approximations Vector to fine raster errors 20
Numerical modeling propagating errors In numerical modeling and simulation errors propagate due to the multiplication of numerical error and initial measurement error. This presents additional challenges. 21
How errors can be controlled? Estimating degree of an error is an interesting area of GIS and computational science. 22
Methods to deal with errors Initial data: control quality of measurement, develop standards, prevent human error. Data models: select correct data models based on experience or model appropriateness, reduce errors during conversion from one to another. 23
Finding and modeling errors in GIS Checking for errors Probably the simplest means of checking for data errors is by visual inspection. Various statistical methods can be employed to help pinpoint potential errors. Estimating degree of an error helps in controlling and correcting errors 24
Estimating degree of an error - map digitizing errors Map digitizing – errors in digitizing a line or a geometric shape are estimated by studying the number of segments for curve approximation and map properties (distorted, rotated map). Perkal’s concept – there is an epsilon error band around a digitized line within which the data is considered to be correct. 25
Estimating degree of an error – raster to vector graphics Statistical approaches for error estimation based on probabilities of error Estimating the size of the grid and its influence on data approximation (Switzer’s method) Double-conversion method for vector to raster conversion (Bregt’s method): convert data twice, compare differences 26
Estimating degree of an error while processing data Errors associated with overlaying data and other spatial operations on data arise from inexact representation of original data and processing errors. Measurement of agreement between an original and overlaid polygons can be taken (McAlpine and Cook) 27
Estimating degree of progressing errors Two approaches to the modeling of errors in spatial data: epsilon modeling and Monte Carlo simulation. Epsilon modeling is based on a well known method of line generation (epsilon width). A Monte Carlo simulation approach has also been used to model the effects of error propagation in GIS overlays. 28
Methods to deal with progressing errors Conversion errors – develop more reliable algorithms Numerical or progressing errors: maintain consistence of data or result utilize exact computation methods 29