CHI SQUARE ANALYSIS I N T R O D U C T I O N T O N O N – P A R A M


17 Slides370.15 KB
CHI SQUARE ANALYSIS I N T R O D U C T I O N T O N O N - P A R A M E T R I C A N A LY S E S
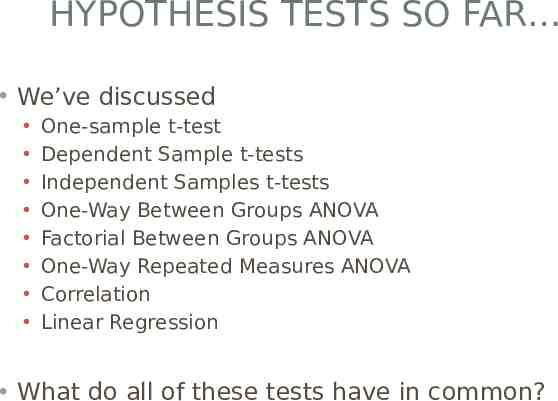
HYPOTHESIS TESTS SO FAR We’ve discussed One-sample t-test Dependent Sample t-tests Independent Samples t-tests One-Way Between Groups ANOVA Factorial Between Groups ANOVA One-Way Repeated Measures ANOVA Correlation Linear Regression What do all of these tests have in common?
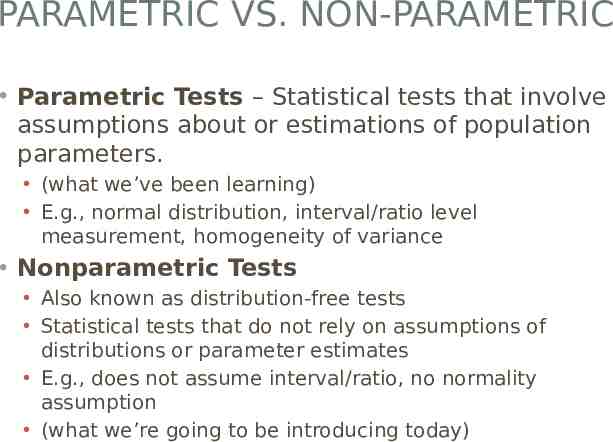
PARAMETRIC VS. NON-PARAMETRIC Parametric Tests – Statistical tests that involve assumptions about or estimations of population parameters. (what we’ve been learning) E.g., normal distribution, interval/ratio level measurement, homogeneity of variance Nonparametric Tests Also known as distribution-free tests Statistical tests that do not rely on assumptions of distributions or parameter estimates E.g., does not assume interval/ratio, no normality assumption (what we’re going to be introducing today)
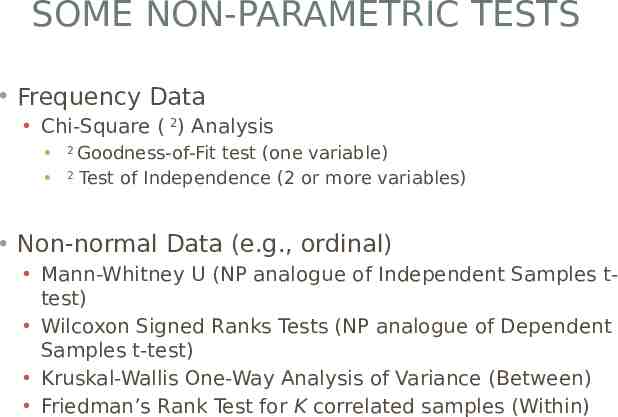
SOME NON-PARAMETRIC TESTS Frequency Data 2 Chi-Square ( ) Analysis 2 Goodness-of-Fit test (one variable) 2 Test of Independence (2 or more variables) Non-normal Data (e.g., ordinal) Mann-Whitney U (NP analogue of Independent Samples ttest) Wilcoxon Signed Ranks Tests (NP analogue of Dependent Samples t-test) Kruskal-Wallis One-Way Analysis of Variance (Between) Friedman’s Rank Test for K correlated samples (Within)
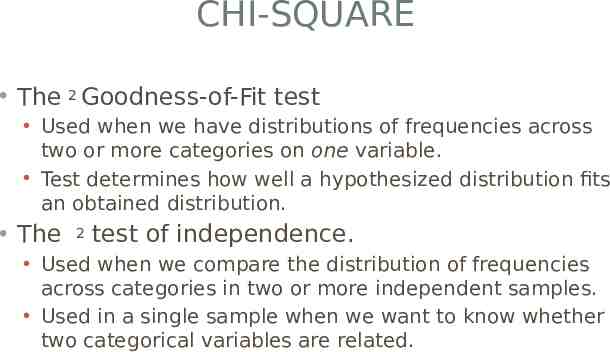
CHI-SQUARE 2 Goodness-of-Fit test The Used when we have distributions of frequencies across two or more categories on one variable. Test determines how well a hypothesized distribution fits an obtained distribution. 2 test of independence. The Used when we compare the distribution of frequencies across categories in two or more independent samples. Used in a single sample when we want to know whether two categorical variables are related.
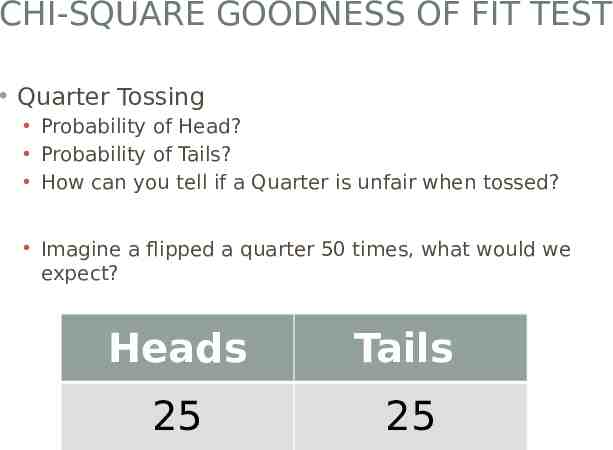
CHI-SQUARE GOODNESS OF FIT TEST Quarter Tossing Probability of Head? Probability of Tails? How can you tell if a Quarter is unfair when tossed? Imagine a flipped a quarter 50 times, what would we expect? Heads Tails 25 25
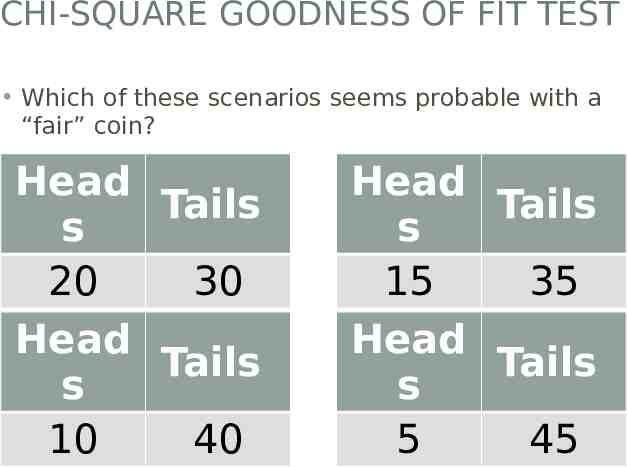
CHI-SQUARE GOODNESS OF FIT TEST Which of these scenarios seems probable with a “fair” coin? Head Tails s 20 30 Head Tails s 10 40 Head Tails s 15 35 Head Tails s 5 45
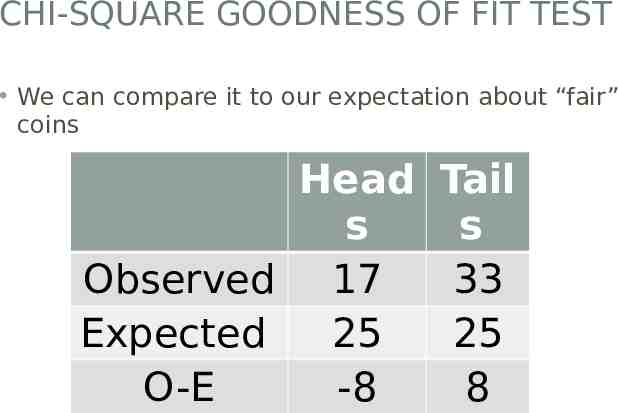
CHI-SQUARE GOODNESS OF FIT TEST We can compare it to our expectation about “fair” coins Head Tail s s Observed 17 33 Expected 25 25 O-E -8 8
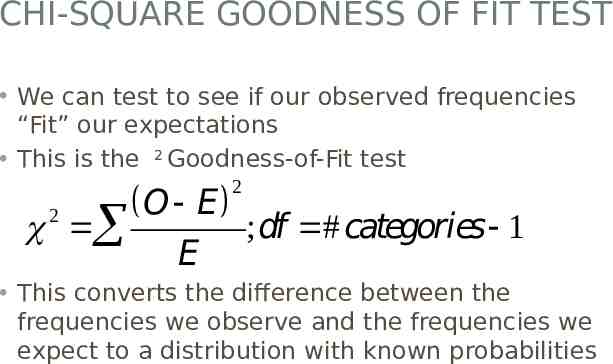
CHI-SQUARE GOODNESS OF FIT TEST We can test to see if our observed frequencies “Fit” our expectations 2 This is the Goodness-of-Fit test 2 c å ( O- E ) E 2 ;df # categories- 1 This converts the difference between the frequencies we observe and the frequencies we expect to a distribution with known probabilities
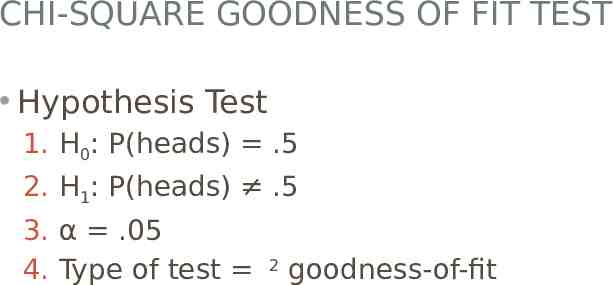
CHI-SQUARE GOODNESS OF FIT TEST Hypothesis Test 1. H0: P(heads) .5 2. H1: P(heads) .5 3. α .05 2 4. Type of test goodness-of-fit
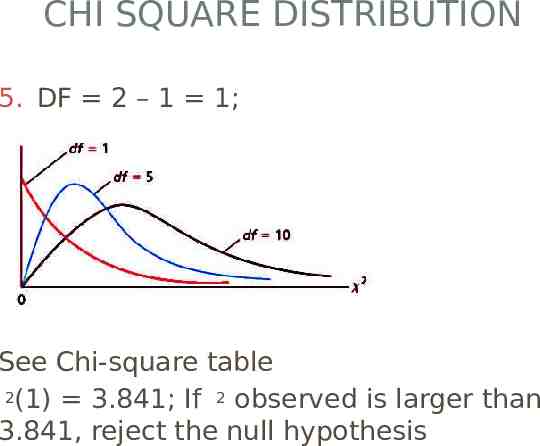
CHI SQUARE DISTRIBUTION 5. DF 2 – 1 1; See Chi-square table 2(1) 3.841; If 2 observed is larger than 3.841, reject the null hypothesis
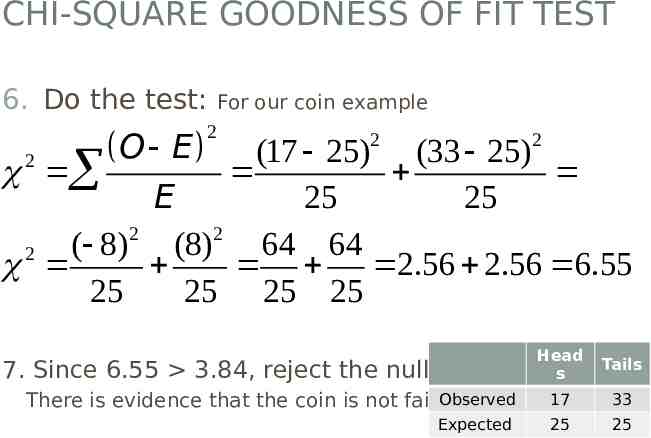
CHI-SQUARE GOODNESS OF FIT TEST 6. Do the test: For our coin example 2 2 2 OE (17 - 25) (33 - 25) ( ) 2 c å E 25 25 2 2 (- 8) (8) 64 64 2 c 2.56 2.56 6.55 25 25 25 25 Head s Tails There is evidence that the coin is not fair.Observed 17 33 Expected 25 25 7. Since 6.55 3.84, reject the null.
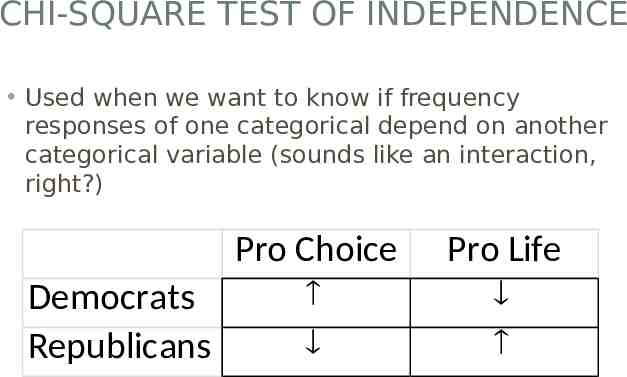
CHI-SQUARE TEST OF INDEPENDENCE Used when we want to know if frequency responses of one categorical depend on another categorical variable (sounds like an interaction, right?) Pro Choice Democrats Republicans Pro Life
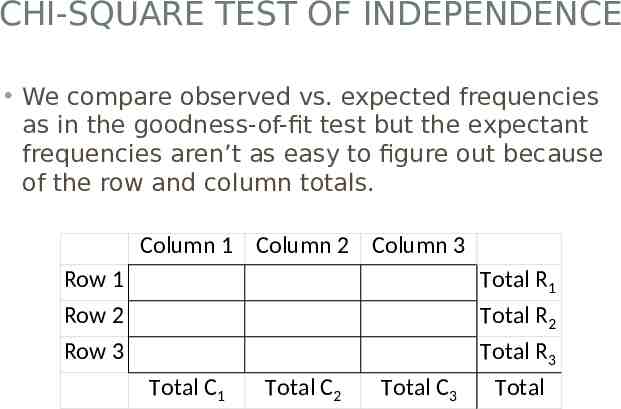
CHI-SQUARE TEST OF INDEPENDENCE We compare observed vs. expected frequencies as in the goodness-of-fit test but the expectant frequencies aren’t as easy to figure out because of the row and column totals. Column 1 Column 2 Column 3 Row 1 Row 2 Row 3 Total C1 Total C2 Total C3 Total R1 Total R2 Total R3 Total
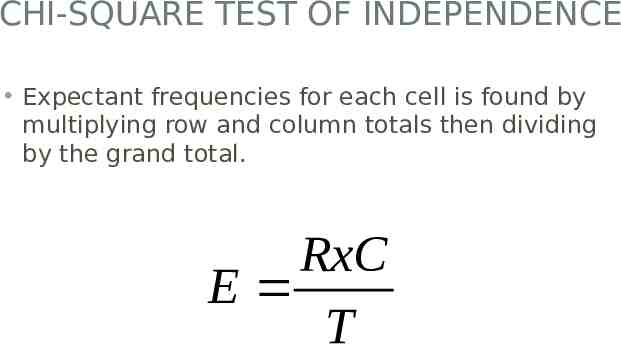
CHI-SQUARE TEST OF INDEPENDENCE Expectant frequencies for each cell is found by multiplying row and column totals then dividing by the grand total. RxC E T
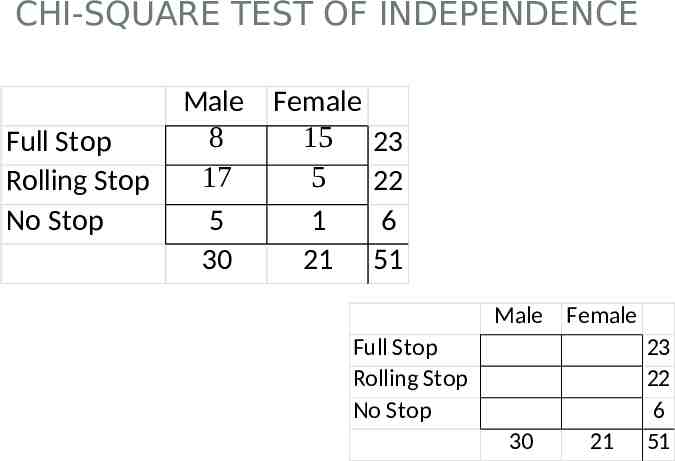
CHI-SQUARE TEST OF INDEPENDENCE Example: Researchers stood on a corner and watched drivers come to a stop sign. They noted their gender and the type of stop they made. Full Stop Rolling Stop No Stop Male 8 17 5 30 Female 15 5 1 21 23 22 6 51
CHI-SQUARE TEST OF INDEPENDENCE Full Stop Rolling Stop No Stop Male Female 8 15 23 17 5 22 5 1 6 30 21 51 Male Female Full Stop Rolling Stop No Stop 30 21 23 22 6 51