Checking Your Data With Outlier Analyses 2 0 1 6 I M P R OV I N

28 Slides1.22 MB
Checking Your Data With Outlier Analyses 2 0 1 6 I M P R OV I N G D ATA , I M P R OV I N G O U T C O M E S C O N F E R E N C E AU G . 1 5 - 1 7 , 2 0 1 6 Joy Markowitz, IDC Carolee Eslinger, IDC Sarah Walters, IDC
Agenda What is an outlier? Why are outlier analyses important for data validity and reliability? What steps should states take after an outlier analysis? How can states conduct and display an outlier analysis? Discussion 2
What Is an Outlier? “An outlier is an observation which deviates so much from the other observations as to arouse suspicions that it was generated by a different mechanism.” (Hawkins, 1980) Outlier analyses include investigating whether the data are valid or invalid. States define what value or combination of values are outside the expected norm. 3
What Is an Outlier? (cont.) Invalid outliers are the target of outlier analysis, as they represent errors in the data. Valid outliers may appear to be outside the norm, but investigation demonstrates that the data are not in error. Valid outliers may occur due to random variation, which occurs due to chance and is inherent in a system. 4
Why Are Outlier Analyses Important for Data Validity and Reliability? Help identify errors in the data Reveal systematic errors in data collection, coding, or entry Identify LEAs/LLAs that are performing better or worse than the norm Provide opportunities for understanding the factors behind high performance or providing targeted technical assistance where it is needed 5
What Steps Should States Take After an Outlier Analysis? Investigate any identified outliers to understand why the data are so different from the norm. Follow up with the LEAs/LLAs to determine the root cause of the outlying data. For more information on examining root cause, states can review Equity, Inclusion, and Opportunity: How t o Address Success Gaps, White Paper . 6
Investigative Questions 1. Are the outliers found in just one LEA or LLA? 2. Are the same outliers identified in more than one dataset? 3. Are multiple outliers commonly identified in the same LEAs/LLAs? 4. Are the LEAs/LLAs with outliers using non-standard data collection definitions? 7
Investigative Questions (cont’d) 5. Are the LEAs/LLAs with outliers using non-standard methods for aggregating the data? 6. Are the LEAs/LLAs with outliers using non-standard methods to collect the data? 7. Did the small n size affect the analysis? 8
How Can States Conduct and Display an Outlier Analysis? There are several possible approaches to conduct outlier analyses. The IDC Outlier Analyses: Step-by-Step Guide includes six different tutorials covering different methods states can use to identify and visualize outliers. IDC also created IDEA Data Quality: Outlier Analysis Tool , an Excel-based tool states can use to identify outliers using the interquartile range approach described in the step-by-step tutorials. 9
Example Outlier Analysis Steps to conduct analysis in the IDC Excel Tool Paste Here Tab Report the measures in the columns. Report the LEA/LLAs in the rows. Outlier Analysis Results will be displayed on this tab. 1 0
Review of Sample Part C Exiting Data Exiting With Referral to Other Programs Withdrawn by Parent 1 1
Discussion Questions Are the data of high quality? Did you expect outliers where there aren’t any? Might there be outliers that are not identified? 1 2
Discussion Questions (cont’d) What is occurring in these programs? Are the LEAs/LLAs with outliers using non-standard data collection definitions? Are the LEAs/LLAs with outliers using non-standard methods for aggregating the data? Are the LEAs/LLAs with outliers using non-standard methods to collect the data? Did the small n size affect the analysis? 1 3
Who Should Review the Data With the Data Manager? Part C Coordinator Program Director Service Providers 1 4
How Can You Show Outlier Analyses? Heat Maps in Excel Alternative Quick Heat Maps Dot Plots in Excel Dot Plots in Tableau 1 5
Heat Maps in Excel Use conditional formatting in conjunction with sorting Can be particularly important when you have multiple columns of data or lots of rows 1 6
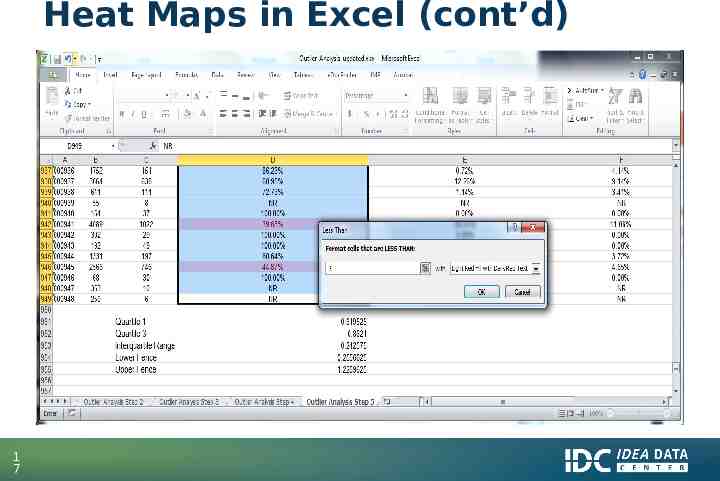
Heat Maps in Excel (cont’d) 1 7
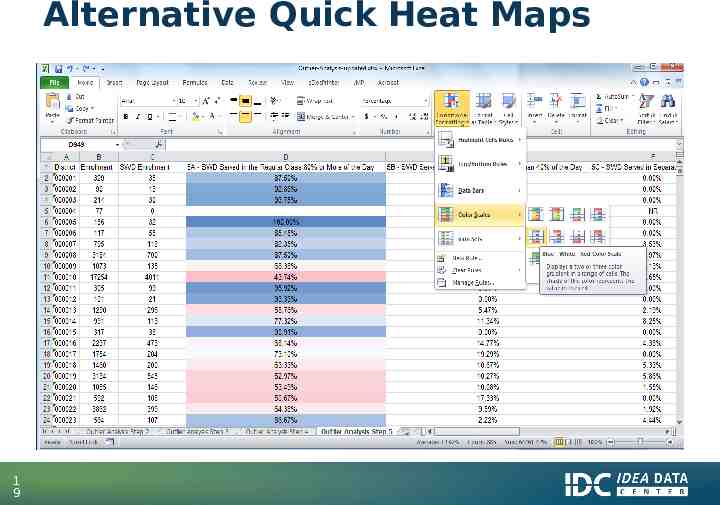
Alternative Quick Heat Maps A quicker approach to heat maps in Excel is using the Color Scales feature found under the Conditional Formatting drop-down menu. This will automatically color a set of selected cells based on the range of values. Data bars and icon sets can also be used to quickly identify possible outliers. 1 8
Alternative Quick Heat Maps 1 9
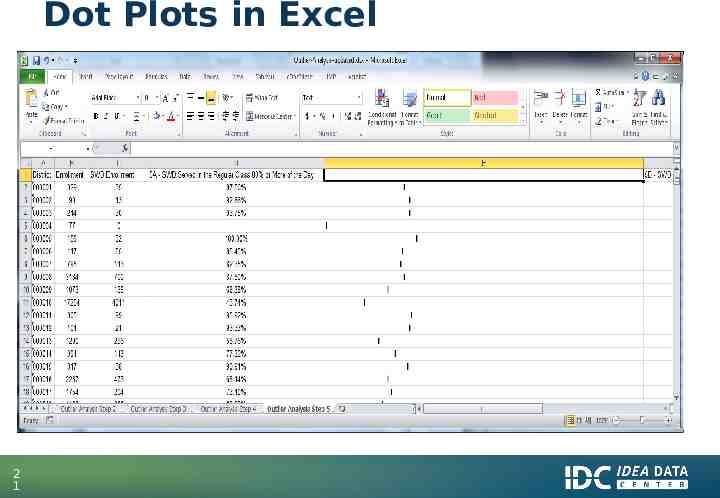
Dot Plots in Excel Use an in-cell formula that will create a simple dot plot next to your data Look for data points that don’t seem to fit with the others Use an Excel formula to create an in-cell chart; dot plots will always remain in line with the data Excel’s standard chart functions can also assist in identifying outliers but will ultimately be disconnected from the original data. 2 0
Dot Plots in Excel 2 1
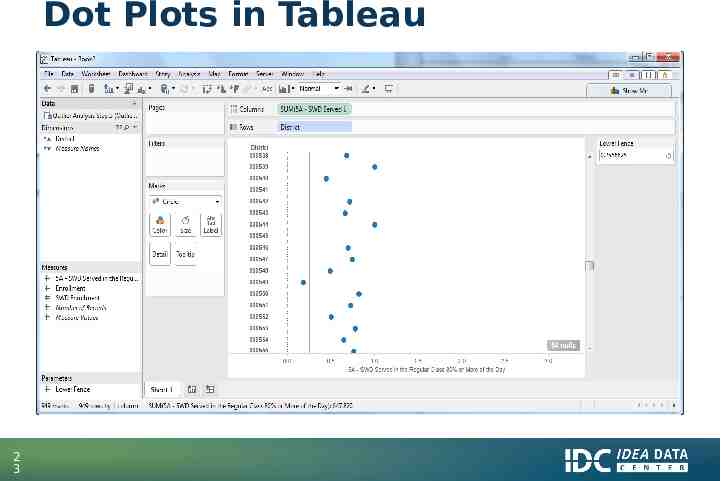
Dot Plots in Tableau 2 2 If you have a lot of data, using an interactive visualization program like Tableau can be useful. You can quickly and easily visualize hundreds of rows and multiple measures. If you are visualizing Public Data, you can use Tableau Public for free. For private data, you would need at least a personal version of the Tableau desktop license.
Dot Plots in Tableau 2 3
Discussion—How to Use Outlier Data for Program Improvement 2 4 Why might there be so many more referrals in one LLA? (e.g., co-location of programs)? Are there fewer programs in some LLAs to which to refer children who exit Part C? Is there a need for better information about programs to which to refer children who exit? Is there lack of clarity about the referral process?
Who Should Be Involved? Part C Coordinator Program Director Service Providers Other 2 5
Questions & Other Comments 2 6
For More Information Visit the IDC website http://ideadata.org/ Follow us on Twitter https://twitter.com/ideadatace nter 2 7
The contents of this presentation were developed under a grant from the U.S. Department of Education, #H373Y130002. However, the contents do not necessarily represent the policy of the Department of Education, and you should not assume endorsement by the Federal Government. Project Officers: Richelle Davis and Meredith Miceli 2 8