Chapter 8 Inventory Management


41 Slides1.29 MB
Chapter 8 Inventory Management
Learning Objectives To learn about the ways that inventory can be classified To discuss inventory costs and the trade-offs that exist among them To identify when to order an how much to order, with a particular emphasis on the economic order quantity To differentiate the various inventory flow patterns To discuss special concerns with inventory management To identify several contemporary approaches to managing inventory 2008 Prentice Hall 9-2
Inventory Management Key Terms – – – – – – – – – Key Terms ABC analysis of inventory Back order Complementary products Cycle (base) stock Economic order quantity (EOQ) Fixed order interval system Fixed order quantity system Inventory Inventory shrinkage 2008 Prentice Hall – Inventory carrying (holding) costs – Inventory turnover – Just-in-time (JIT) approach – Lean manufacturing (lean) – Ordering costs – Pipeline (in-transit) stock – Psychic stock 9-3
Inventory Management Key Terms – – – – – – – Reorder (trigger) point (ROP) Safety (buffer) stock Service parts logistics Speculative stock Stockout costs Substitute products Vendor-managed inventory (VMI) 2008 Prentice Hall 9-4
Inventory Inventories are stocks of goods and materials that are maintained for many purposes, the most common being to satisfy normal demand patterns. Inventory is an important tool which, when used correctly, can reduce total cost and improve the level of service performance in a logistics system. 2008 Prentice Hall 9-5
Inventory Management Inventory management – Decisions drive other logistics activities – Objectives can differ for different functional areas of an organization – Must consider inventory costs Carrying costs Ordering costs Stockout costs 2008 Prentice Hall 9-6
Inventory Classifications Cycle or base stock refers to inventory that is needed to satisfy normal demand during the course of an order cycle. Safety or buffer stock refers to inventory that is held in addition to cycle stock to guard against uncertainty in demand or lead time. Pearson Education, Inc. publishing as Prentice Hall 8-7
Fundamental Purpose of Inventory To reduce total system cost – To buffer uncertainties in Supply Demand Transportation The firm carries safety stock – To capture scale economies in Purchasing Production Transportation The firm carries cycle stock 2008 Prentice Hall 9-8
Cycle Stock and Safety Stock Quantity Q Cycle Stock Safety Stock Time
Inventory Classifications Pipeline or in-transit stock is inventory that is en route between various fixed facilities in a logistics system such as a plant, warehouse, or store. Speculative stock refers to inventory that is held for several reasons, including seasonal demand, projected price increases, and potential shortages of a product. Psychic stock is inventory carried to stimulate demand (retail). Pearson Education, Inc. publishing as Prentice Hall 8-10
Inventory Costs Inventory costs in the twenty-first century represent approximately one-third of total logistics costs. Inventory cost should factor into an organization’s inventory management policy. Inventory costs include: – Carrying cost – Ordering cost – Stockout cost Pearson Education, Inc. publishing as Prentice Hall 8-11
Magnitude of Inventory Costs Table 8-1 Pearson Education, Inc. publishing as Prentice Hall 8-12
Inventory Carrying Costs Inventory carrying (holding) costs are the costs associated with holding inventory. – – – – – – – Obsolescence Inventory shrinkage Storage costs Handling costs Insurance costs Taxes Interest charges 2008 Prentice Hall 9-13
Inventory Costs Ordering costs refer to those costs associated with ordering inventory, such as order costs and setup costs. Examples of order costs include: – – – – – – Costs of receiving an order (wages) Conducting a credit check Verifying inventory availability Entering orders into the system Preparing invoices Receiving payment 8-14
Inventory Costs Trade-Off between Carrying and Ordering Costs Ordering cost number of orders / year x ordering cost / order Carrying cost average inventory x carrying cost / unit Pearson Education, Inc. publishing as Prentice Hall 8-15
Inventory Costs Stockout cost is an estimated cost or penalty that is realized when a company is out of stock when a customer wants to buy an item. Stockout costs involve an understanding of a customer’s reaction to a company being out of stock. Pearson Education, Inc. publishing as Prentice Hall 8-16
Table 8-3: Determination of the Average Cost of a Stockout Alternative Loss Probability Average Cost 1. Brand-loyal customer 00.00 .10 00.00 2. Switches and comes back 37.00 .25 9.25 3. Lost customer 1,200 .65 780.00 1.00 789.25 Average cost of a stockout These are hypothetical figures for illustration. 2008 Prentice Hall 9-17
Inventory Costs General Rules Regarding Stockout Costs – The higher the average cost of a stockout, the better it is for the company to hold some amount of inventory (SS) to protect against stockouts. – The higher the probability of a delayed sale, the lower the average stockout costs and the lower the inventory that needs to be held by a company. Pearson Education, Inc. publishing as Prentice Hall 8-18
Determination of Safety Stock Level Table 8-4 Number of Units of Safety Stock Total Value of Safety Stock ( 480 per Unit) 25% Annual Carrying Cost Carrying Cost of Incremental Safety Stock Number of Additional Orders Filled Additional Stockout Costs Avoided 10 4,800 1,200 1,200 20 8,000.00 20 9,600 2,400 1,200 16 6,400.00 30 14,400 3,600 1,200 12 4,800.00 40 19,200 4,800 1,200 8 3,200.00 50 24,000 6,000 1,200 6 2,400.00 60 28,800 7,200 1,200 4 1,600.00 70 33,600 8,400 1,200 3 1,200.00 2008 Prentice Hall 9-19
Determination of Safety Stock Level: Using Service Level Safety Stock k Service Level Probability of Stockout Forecasted Demand 2008 Prentice Hall Reorder Point 9-20
Dimension of Inventory Modeling Demand – Constant vs Variable – Known vs Random – Continuous vs Discrete Lead Time – Instantaneous – Deterministic vs Stochastic Dependence of Items Discount – None – All units or Incremental Excess Demand – – – – None Backordered Lost orders Substitution – Independence – Correlated Perishability – Continuous vs Periodic Planning Horizon Review Time Number of Layers – One vs Many Capacity / Resources – Unlimited vs Limited – None – Uniform with time – Single Period – Finite Period – Infinite Number of Items: -- One vs Many 9-21
When to Order Fixed order quantity system Fixed order interval system Reorder point (ROP) ROP DD x RC under certainty ROP (DD x RC) SS under uncertainty Where DD daily demand RC length of replenishment cycle SS safety stock 2008 Prentice Hall 9-22
Assumption of Basic EOQ Inventory Model Demand – Constant vs Variable – Known vs Random – Continuous vs Discrete Lead Time – Instantaneous – Deterministic vs Stochastic Dependence of Items Discount – None – All units or Incremental Excess Demand – – – – None Backordered Lost orders Substitution – Independence – Correlated Perishability – Continuous vs Periodic Planning Horizon Review Time Number of Layers – One vs Many Capacity / Resources – Unlimited vs Limited – None – Uniform with time – Single Period – Finite Period – Infinite Number of Items: -- One vs Many 9-23
Inventory Control Basic EOQ Model Quantity Q Time
How Much to Order? Pearson Education, Inc. publishing as Prentice Hall 8-25
How Much to Reorder? Economic order quantity (EOQ) in units Where EOQ the most economic order size, in units D annual demand, in units B administrative costs per order of placing the order C carrying costs of the inventory (%) I dollar value of the inventory, per unit 2008 Prentice Hall 9-26
Inventory Control Basic Break-even charts Economic Ordering Quantity Model Total Annual Cost Carrying Cost Ordering Cost EOQ Order Quantity Q
Figure 8-1: Determining EOQ by Use of a Graph 2008 Prentice Hall 9-28
Table 8-5: EOQ Cost Calculations Number of orders per year Order size ( ) 1 1,000 2 Ordering cost ( ) Carrying cost ( ) Total cost (sum of ordering and carrying cost) ( ) 25 100 125 500 50 50 100 3 4 333 250 75 100 33 25 108 125 5 200 125 20 145 2008 Prentice Hall 9-29
Figure 8-2: Inventory Flow Diagram 2008 Prentice Hall 9-30
Inventory Flows Safety stock can prevent against two problem areas – Increased rate of demand – Longer-than-normal replenishment When fixed order quantity system like EOQ is used, time between orders may vary When reorder point is reached, fixed order quantity is ordered 2008 Prentice Hall 9-31
Inventory Management: Special Concerns ABC Analysis of Inventory recognizes that inventories are not of equal value to a firm and as such all inventory should not be managed in the same way. Dead inventory (dead stock) is a fourth category to ABC analysis which refers to product for which there is no sales during a 12 month period. Inventory Turnover refers to the number of times that inventory is sold in a one-year period. Pearson Education, Inc. publishing as Prentice Hall 8-32
Inventory Turnover Inventory management (continued) Inventory Turnover refers to the number of times that inventory is sold in a one-year period. Inventory turnover: cost of goods sold divided by average inventory at cost Cost of Goods Sold Inventory Turnover Avg . Inventory Level Compare with competitors or benchmarked companies 2008 Prentice Hall 9-33
Inventory Management: Special Concerns Complementary Products are inventories that can be used or distributed together, i.e. razor blades and razors. Substitute Products refer to products that can fill the same need or want as another product. Pearson Education, Inc. publishing as Prentice Hall 8-34
Contemporary Approaches to Managing Inventory Lean Manufacturing Service Parts Logistics Vendor-Managed Inventory (VMI) Pearson Education, Inc. publishing as Prentice Hall 8-35
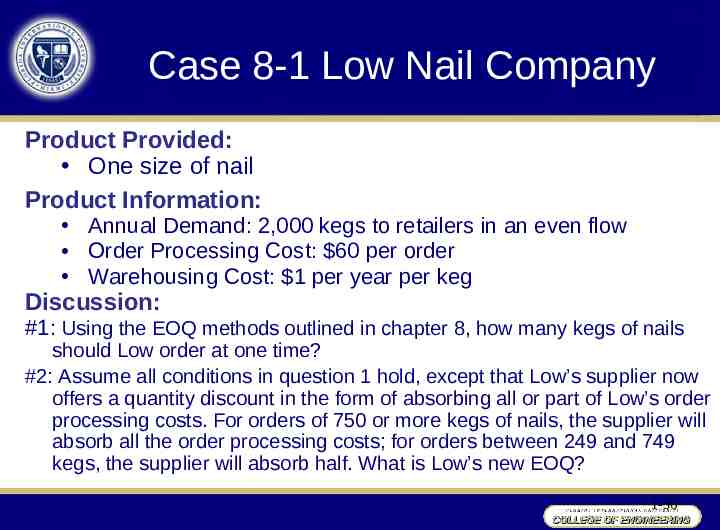
Case 8-1 Low Nail Company Product Provided: One size of nail Product Information: Annual Demand: 2,000 kegs to retailers in an even flow Order Processing Cost: 60 per order Warehousing Cost: 1 per year per keg Discussion: #1: Using the EOQ methods outlined in chapter 8, how many kegs of nails should Low order at one time? #2: Assume all conditions in question 1 hold, except that Low’s supplier now offers a quantity discount in the form of absorbing all or part of Low’s order processing costs. For orders of 750 or more kegs of nails, the supplier will absorb all the order processing costs; for orders between 249 and 749 kegs, the supplier will absorb half. What is Low’s new EOQ? 1-36
Case 8-1 Low Nail Company Discussion: #3: Temporarily, ignore your work on question 2. Assume that Low’s warehouse offers to rent Low space on the basis of the average number of kegs Low will have in stock, rather than on the maximum number of kegs Low would need room for whenever a new shipment arrived. The storage cost per keg remains the same. Does this change the answer to Question 1? If so, what is the new answer? #4: Take into account the answer to question 1 and the supplier’s new policy outlined in question 2 and the warehouse’s new policy in question 3. Then determine Low’s new EOQ. 1-37
Case 8-1 Low Nail Company Discussion: #5: Temporarily, ignore your work on questions 2, 3, and 4. Low’s luck at the race track is over; he now must borrow money to finance his inventory of nails. Looking at the situation outlined in question 1, assume that the wholesale cost of nails is 40 per keg and that Low must pay interest at the rate of 1.5% per month on the unsold inventory. What is his new EOQ? #6: Taking into account all the factors listed in questions 1, 2, 3, and 5, calculate Low’s EOQ for kegs of nails. 1-38
Case 8-1 Low Nail Company (Warehousing Cost is based on max. space) Total Inventory Cost: D TC B QIC Q Economic order quantity (EOQ) : Where DB EOQ IC EOQ the most economic order size, in units D annual demand, in units B administrative costs per order of placing the order C carrying costs of the inventory (%) I dollar value of the inventory, per unit 2008 Prentice Hall 9-39
Case 8-1 Low Nail Company (Warehousing Cost is based on avg. space) Total Inventory Cost: D Q TC B IC Q 2 Economic order quantity (EOQ) : Where 2DB EOQ IC EOQ the most economic order size, in units D annual demand, in units B administrative costs per order of placing the order C carrying costs of the inventory (%) I dollar value of the inventory, per unit 2008 Prentice Hall 9-40
Case 8-1 Low Nail Company (Warehousing Cost is based on max. space Plus Interest) D Q Total Inventory TC B QIC Ii Q 2 Cost: Economic order quantity (EOQ) : 2DB EOQ 2IC Ii Where EOQ the most economic order size, in units D annual demand, in units B administrative costs per order of placing the order C carrying costs of the inventory (%) I dollar value of the inventory, per unit i interest rate, per year 2008 Prentice Hall 9-41