Chapter 5 Sections 1-3


22 Slides2.34 MB
Chapter 5 Sections 1-3
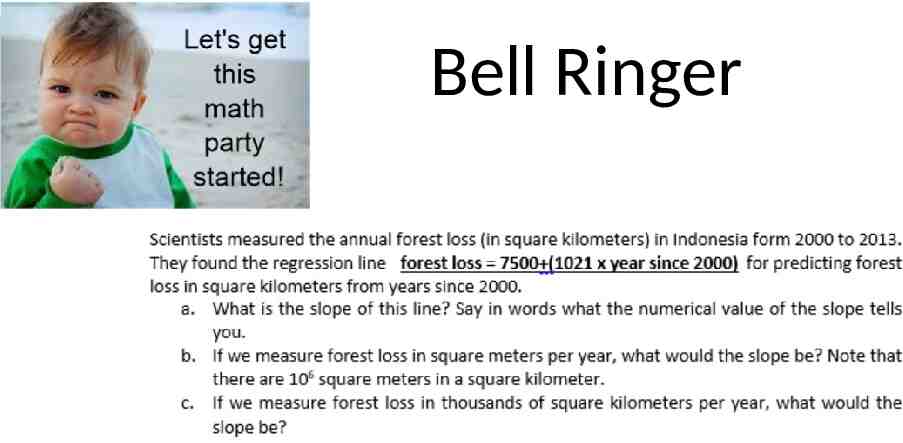
Bell Ringer
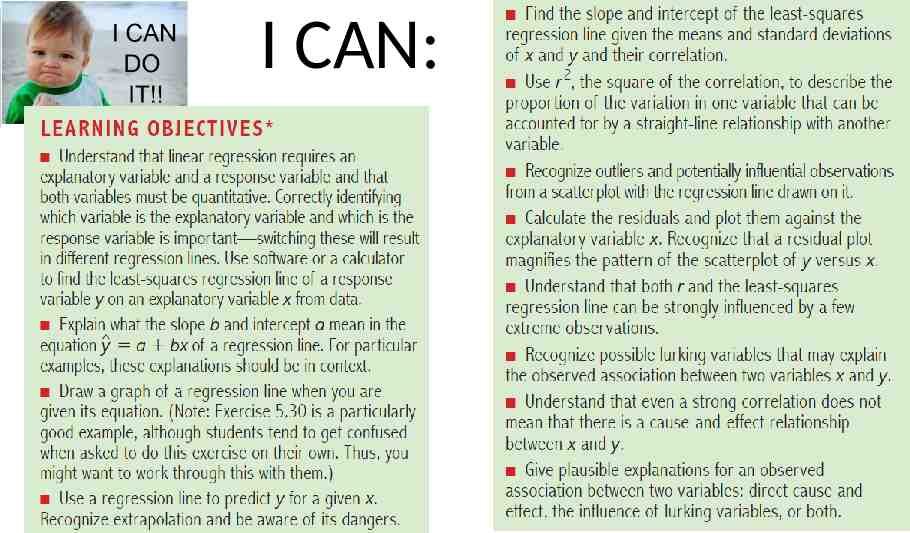
I CAN:
Daily Agenda Bell Ringer Review Bell Ringer I CAN Section 5.1 Section 5.2 Section 5.3
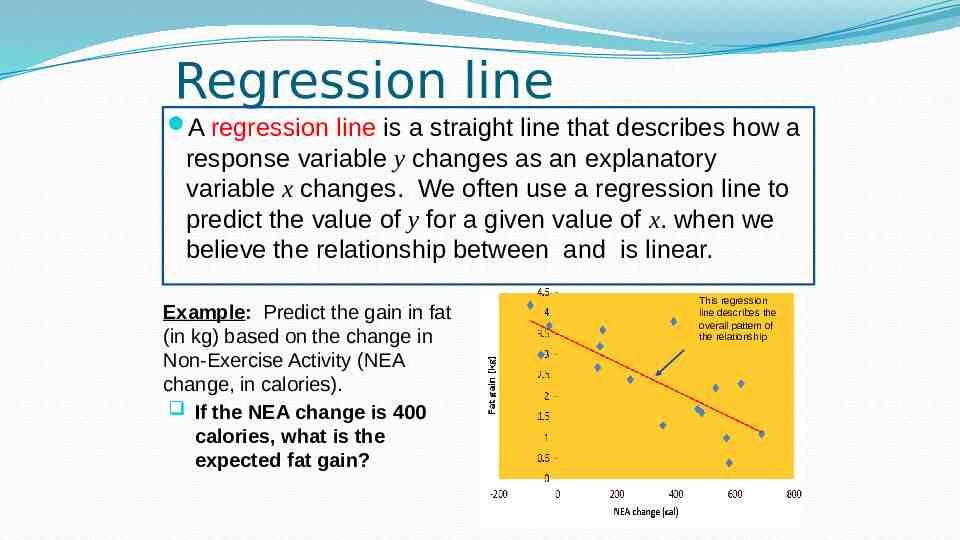
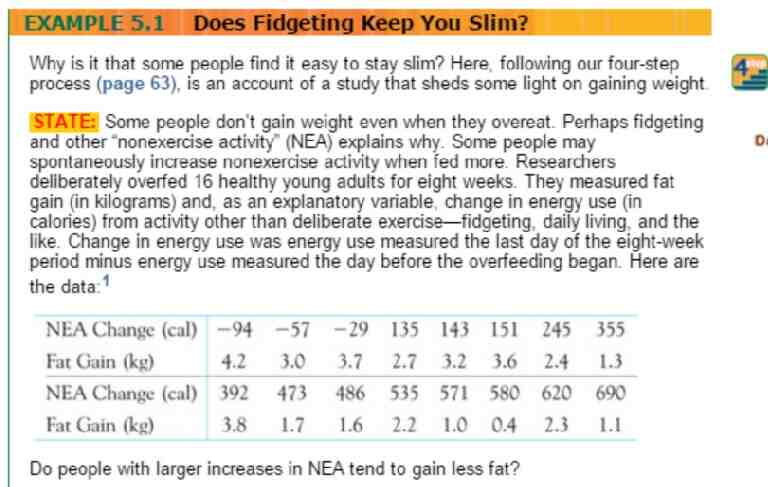
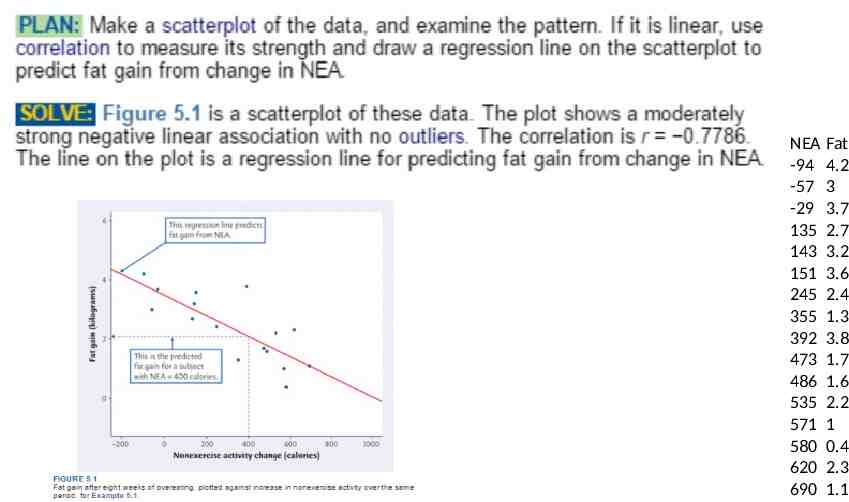
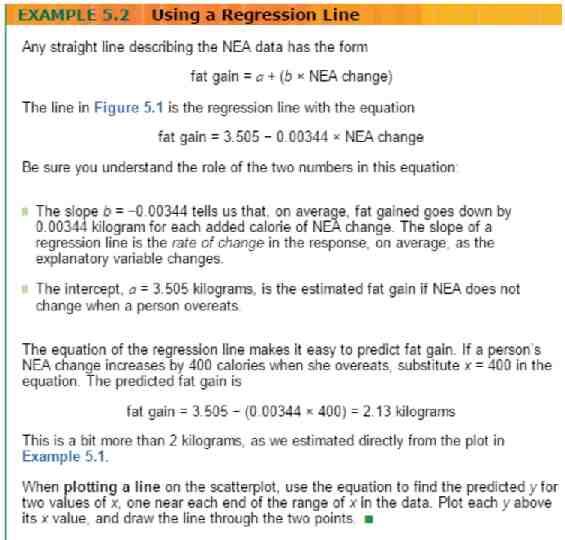
Regression line A regression line is a straight line that describes how a response variable y changes as an explanatory variable x changes. We often use a regression line to predict the value of y for a given value of x. when we believe the relationship between and is linear. Example: Predict the gain in fat (in kg) based on the change in Non-Exercise Activity (NEA change, in calories). If the NEA change is 400 calories, what is the expected fat gain? This regression line describes the overall pattern of the relationship
NEA Fat -94 4.2 -57 3 -29 3.7 135 2.7 143 3.2 151 3.6 245 2.4 355 1.3 392 3.8 473 1.7 486 1.6 535 2.2 571 1 580 0.4 620 2.3 690 1.1
NEA -94 -57 -29 135 143 151 245 355 392 473 486 535 571 580 620 690 Fat 4.2 3 3.7 2.7 3.2 3.6 2.4 1.3 3.8 1.7 1.6 2.2 1 0.4 2.3 1.1
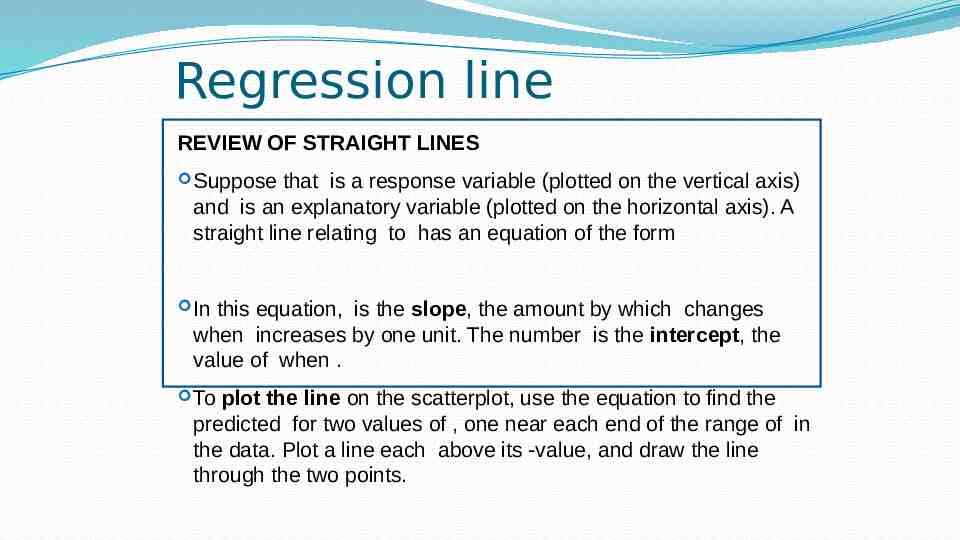
Regression line REVIEW OF STRAIGHT LINES Suppose that is a response variable (plotted on the vertical axis) and is an explanatory variable (plotted on the horizontal axis). A straight line relating to has an equation of the form In this equation, is the slope, the amount by which changes when increases by one unit. The number is the intercept, the value of when . To plot the line on the scatterplot, use the equation to find the predicted for two values of , one near each end of the range of in the data. Plot a line each above its -value, and draw the line through the two points.
Apply Your Knowledge 5.1 City Mileage, Highway Mileage. We expect a car’s highway gas mileage to be related to its city gas mileage (in miles per gallon, mpg). Data for all 1137 vehicles in the government’s 2013 Fuel Economy Guide give the regression line highway mpg 6.785 (1.033 city mpg) for predicting highway mileage from city mileage. (a)What is the slope of this line? Say in words what the numerical value of the slope tells you. (b)What is the intercept? Explain why the value of the intercept is not statistically meaningful. (c)Find the predicted highway mileage for a car that gets 16 miles per gallon in the city. Do the same for a car with city mileage of 28 mpg. (d)Draw a graph of the regression line for city mileages between 10 and 50 mpg. (Be sure to show the scales for the x and y axes.)
5.2 What’s the Line? An online article suggested that for each additional person who took up regular running for exercise, the number of cigarettes smoked daily would decrease by 0.178.2 If we assume that 48 million cigarettes would be smoked per day if nobody ran, what is the equation of the regression line for predicting number of cigarettes smoked per day from the number of people who regularly run for exercise?
5.3 Shrinking Forests. Scientists measured the annual forest loss (in square kilometers) in Indonesia from 2000 to 2012.3 They found the regression line forest loss 7500 (1021 year since 2000) for predicting forest loss in square kilometers from years since 2000. (a)What is the slope of this line? Say in words what the numerical value of the slope tells you. (b)If we measured forest loss in square meters per year, what would the slope be? Note that there are 106 square meters in a square kilometer. (c)If we measured forest loss in thousands of square kilometers per year, what would the slope be?
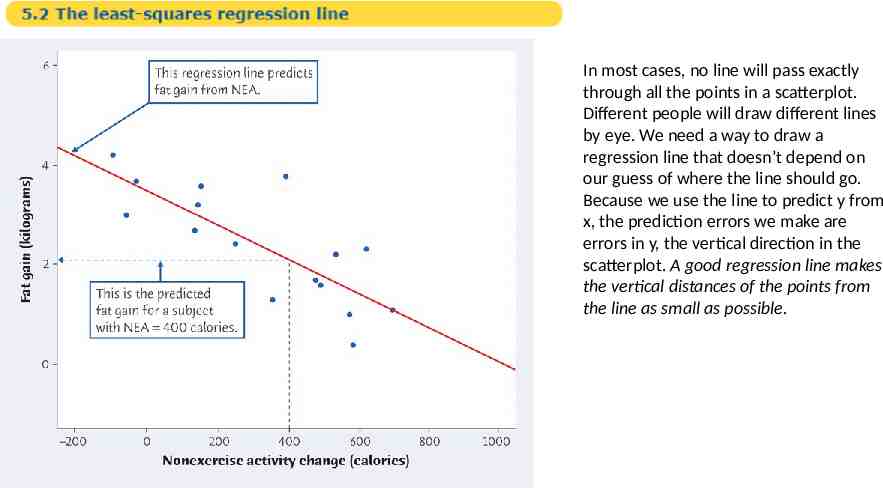
In most cases, no line will pass exactly through all the points in a scatterplot. Different people will draw different lines by eye. We need a way to draw a regression line that doesn’t depend on our guess of where the line should go. Because we use the line to predict y from x, the prediction errors we make are errors in y, the vertical direction in the scatterplot. A good regression line makes the vertical distances of the points from the line as small as possible.
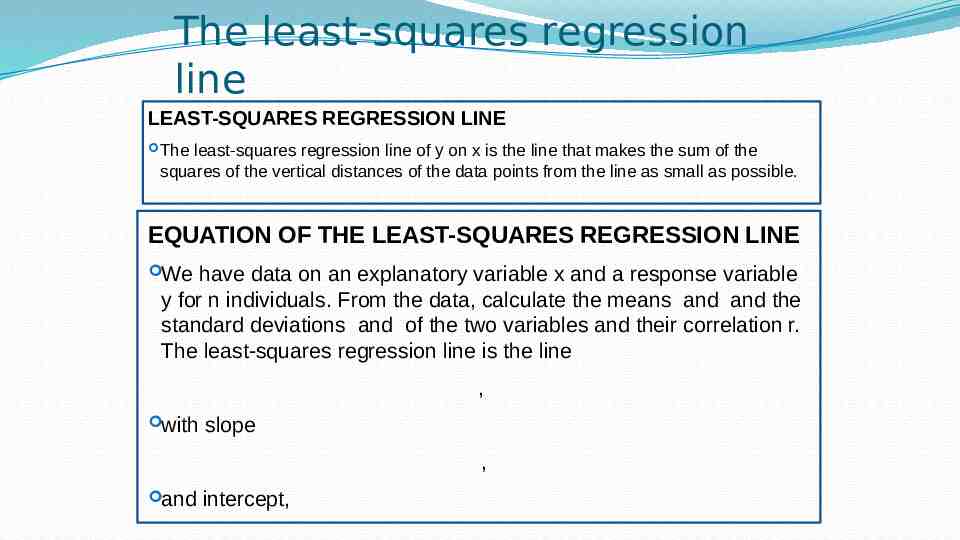
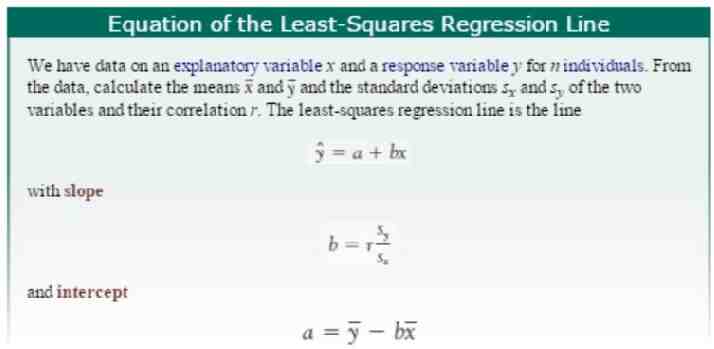
The least-squares regression line LEAST-SQUARES REGRESSION LINE The least-squares regression line of y on x is the line that makes the sum of the squares of the vertical distances of the data points from the line as small as possible. EQUATION OF THE LEAST-SQUARES REGRESSION LINE We have data on an explanatory variable x and a response variable y for n individuals. From the data, calculate the means and and the standard deviations and of the two variables and their correlation r. The least-squares regression line is the line , with slope , and intercept,
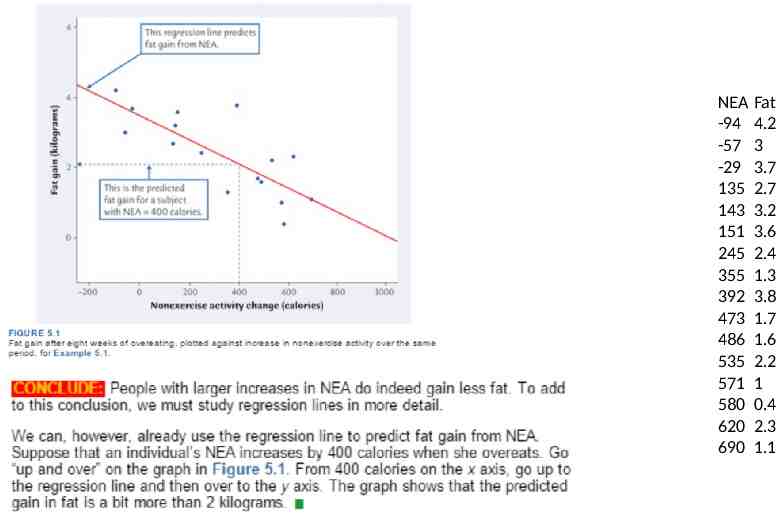
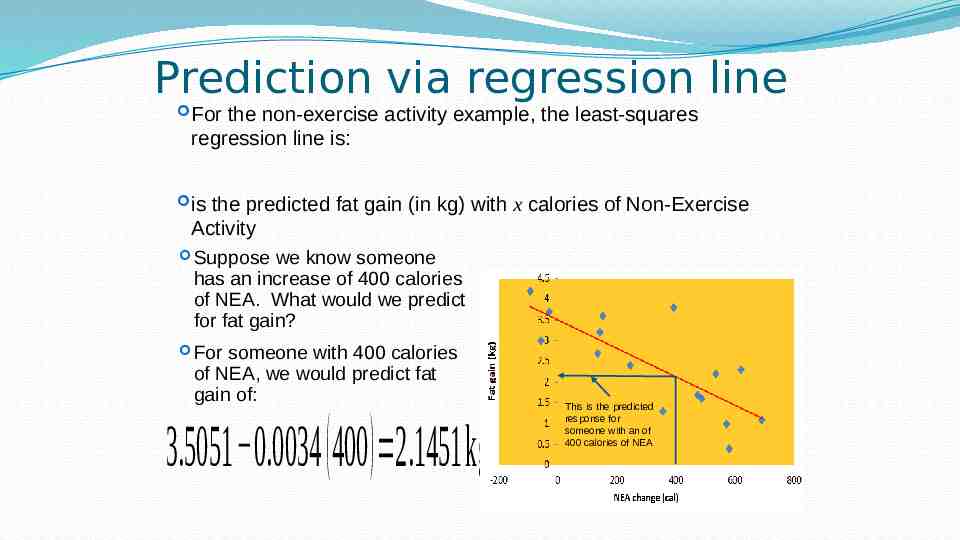
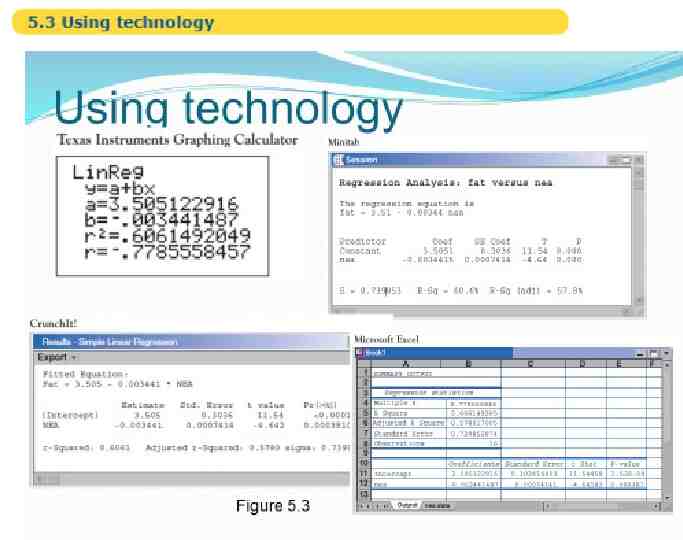
Prediction via regression line For the non-exercise activity example, the least-squares regression line is: is the predicted fat gain (in kg) with x calories of Non-Exercise Activity Suppose we know someone has an increase of 400 calories of NEA. What would we predict for fat gain? For someone with 400 calories of NEA, we would predict fat gain of: 3.5051 0.0034 ( 400) 2.1451kg This is the predicted response for someone with an of 400 calories of NEA
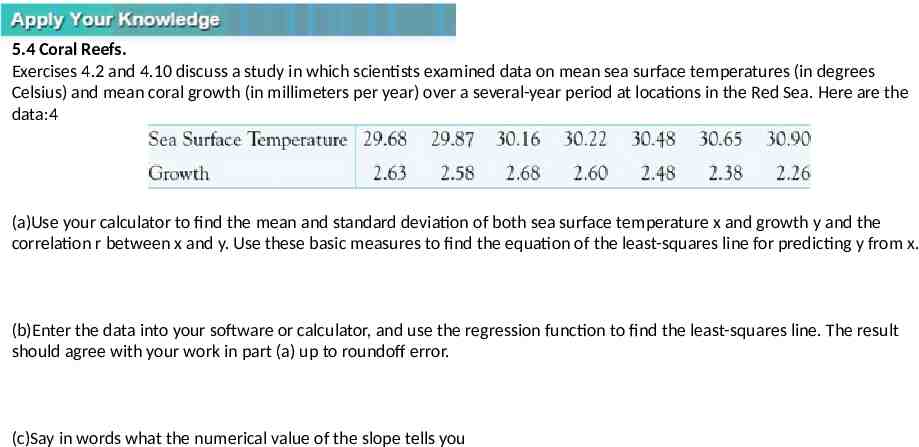
5.4 Coral Reefs. Exercises 4.2 and 4.10 discuss a study in which scientists examined data on mean sea surface temperatures (in degrees Celsius) and mean coral growth (in millimeters per year) over a several-year period at locations in the Red Sea. Here are the data:4 (a)Use your calculator to find the mean and standard deviation of both sea surface temperature x and growth y and the correlation r between x and y. Use these basic measures to find the equation of the least-squares line for predicting y from x. (b)Enter the data into your software or calculator, and use the regression function to find the least-squares line. The result should agree with your work in part (a) up to roundoff error. (c)Say in words what the numerical value of the slope tells you
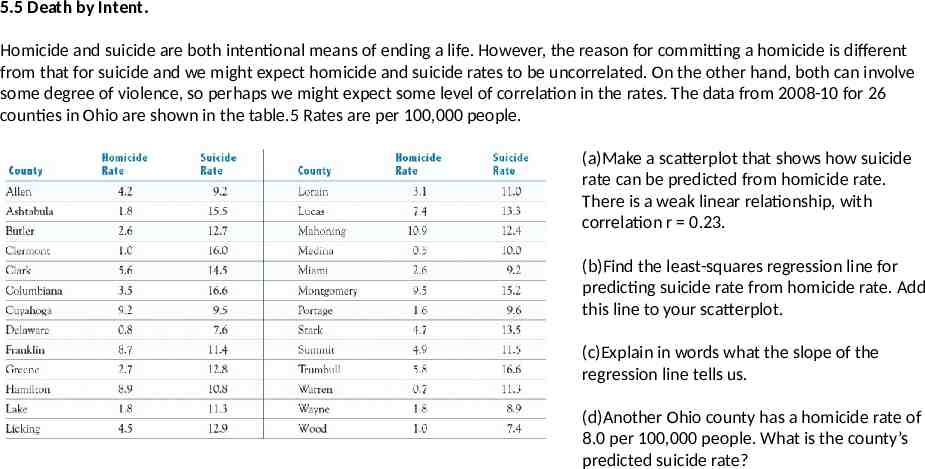
5.5 Death by Intent. Homicide and suicide are both intentional means of ending a life. However, the reason for committing a homicide is different from that for suicide and we might expect homicide and suicide rates to be uncorrelated. On the other hand, both can involve some degree of violence, so perhaps we might expect some level of correlation in the rates. The data from 2008-10 for 26 counties in Ohio are shown in the table.5 Rates are per 100,000 people. (a)Make a scatterplot that shows how suicide rate can be predicted from homicide rate. There is a weak linear relationship, with correlation r 0.23. (b)Find the least-squares regression line for predicting suicide rate from homicide rate. Add this line to your scatterplot. (c)Explain in words what the slope of the regression line tells us. (d)Another Ohio county has a homicide rate of 8.0 per 100,000 people. What is the county’s predicted suicide rate?