Ch. 2 Development of the Safety and Health Function 1


30 Slides2.36 MB
Ch. 2 Development of the Safety and Health Function 1
Content Introduction Workers’ Compensation Record Keeping – Incidence Rates – Record Keeping Forms OSHA’s Form 300 OSHA’s Form 300A OSHA’s Form 301 Accident Cause Analysis Organization Committees Safety and Health Economics Training Job Placement Testing Bloodborne Pathogens Workplace Violence 2
Introduction Safety and health function has both line and staff characteristics: – The physical accomplishment of workplace safety and health is a line function Workers work practices are directed by their line supervisors. For example, the maintenance of equipment is the direct responsibility of the line maintenance operators and their supervisors – Staff function: The S&H manager acts as a facilitator in assisting, motivating and advising line function in achieving worker safety and health The goal is to eliminate unreasonable hazards, not all hazards. Regulations have substantially strengthened the position of the safety and health managers in the management hierarchy. 3
Introduction The approval of top management has to be documented in a written safety and health policy statement. The written policy becomes the authority to line personnel that the top management does have safety and health goals and wants these goals met. Having management commitment and approval, safety and health manager has to: – Make workers aware of hazards – Regular training for hazard recognition and correction – Statistic and accident records are needed to know how well the company and its department are doing in achieving their safety and health goals – Assisting operating personnel in achieving compliance with standards. 4
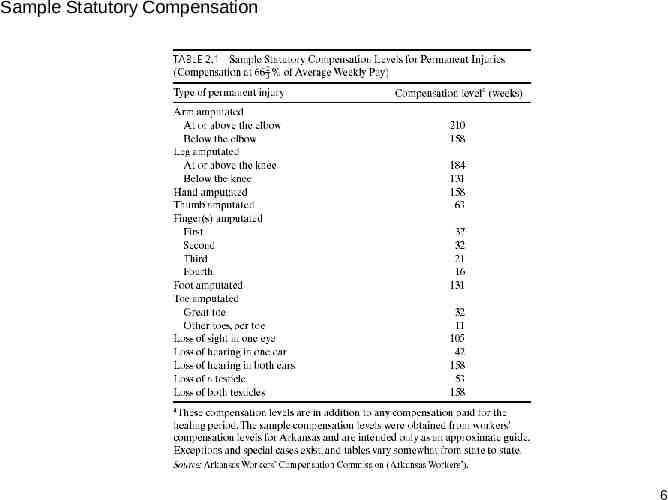
Workers’ Compensation Who should be responsible when a worker is injured?” (Employer or Employee ?) – Workers should be compensated for their on-the-job injuries in a fair and prompt manner (Employer responsibility). – Workmen’s compensation law (1909) workers’ compensation law (1959) It is the duty of the safety and health manager to implement the workers’ compensation system. Employers use insurance to cover compensation claims. – The insurance premium is determined based on plant safety experience. – The insurance premium can be adjusted up or down based upon 3years average of the actual accident experience. 5
Sample Statutory Compensation 6
Workers’ Compensation Workers’ compensation legislation – Ostensible purpose: protecting the workers by providing statutory compensation levels to be paid by the employer – Ulterior purpose: the immunity from additional liability that the worker’s compensation system grants to the employer, except in case in which gross negligence can be proved 7
Workers’ Compensation A good insurance company will make – regular inspections and provide technical advice to their clients (through training films, research centers, and so on). Typical workers’ compensation premiums – were 4-5% of the payroll. – recently are 20-30% of the payroll. To reduce these costs: – Managed care programs: close supervision to get worker back on the job as soon as is practical. – Reduction of false claims: detect malingering workers or workers blaming their employers for off the job injuries or illnesses (workers’ compensation fraud). – Prevention of Injury/illnesses : mandatory inspection and establishment of safety improvement programs. – Privatization of the state (government) system (Skip) 8
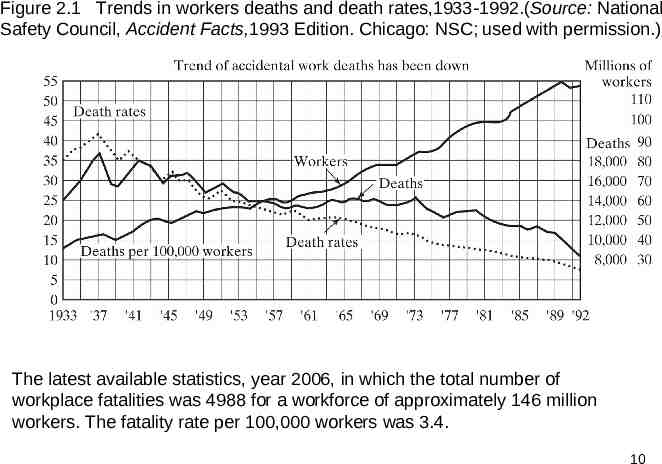
Record Keeping The Z16.1 system – was established by the National Safety Council, – was the first system of industrial safety record keeping (voluntary system). In 1970s, OSHA set a mandatory system similar to Z16.1 system. The recording of fatalities is more consistent (than that of injuries and illness) (Fig 2.1). 9
Figure 2.1 Trends in workers deaths and death rates,1933-1992.(Source: National Safety Council, Accident Facts,1993 Edition. Chicago: NSC; used with permission.) The latest available statistics, year 2006, in which the total number of workplace fatalities was 4988 for a workforce of approximately 146 million workers. The fatality rate per 100,000 workers was 3.4. 10
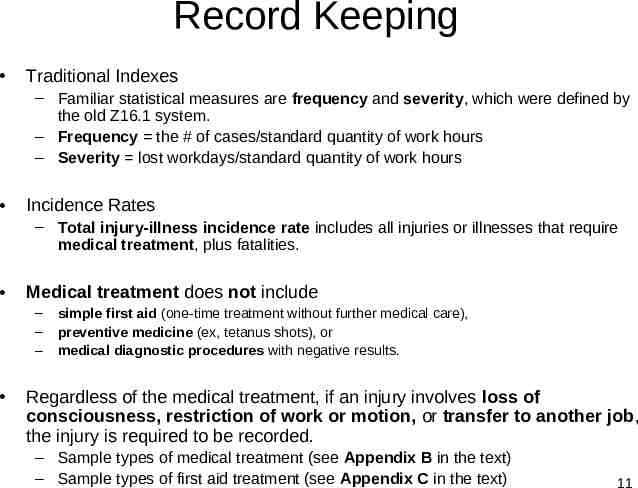
Record Keeping Traditional Indexes – Familiar statistical measures are frequency and severity, which were defined by the old Z16.1 system. – Frequency the # of cases/standard quantity of work hours – Severity lost workdays/standard quantity of work hours Incidence Rates – Total injury-illness incidence rate includes all injuries or illnesses that require medical treatment, plus fatalities. Medical treatment does not include – – – simple first aid (one-time treatment without further medical care), preventive medicine (ex, tetanus shots), or medical diagnostic procedures with negative results. Regardless of the medical treatment, if an injury involves loss of consciousness, restriction of work or motion, or transfer to another job, the injury is required to be recorded. – Sample types of medical treatment (see Appendix B in the text) – Sample types of first aid treatment (see Appendix C in the text) 11
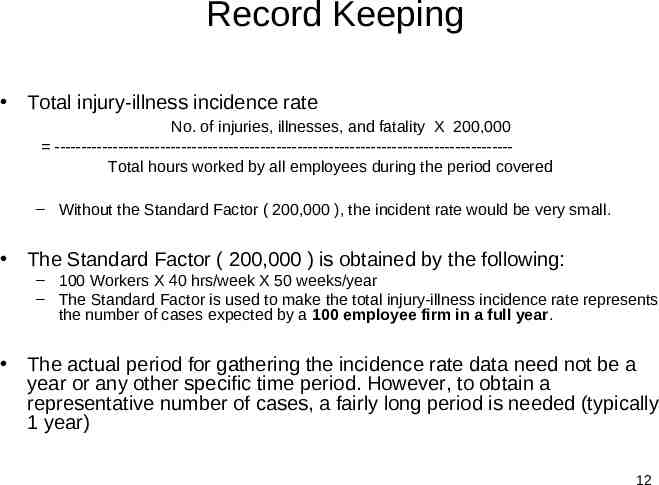
Record Keeping Total injury-illness incidence rate No. of injuries, illnesses, and fatality X 200,000 --------------------------------------------------------------------------------------Total hours worked by all employees during the period covered – Without the Standard Factor ( 200,000 ), the incident rate would be very small. The Standard Factor ( 200,000 ) is obtained by the following: – 100 Workers X 40 hrs/week X 50 weeks/year – The Standard Factor is used to make the total injury-illness incidence rate represents the number of cases expected by a 100 employee firm in a full year. The actual period for gathering the incidence rate data need not be a year or any other specific time period. However, to obtain a representative number of cases, a fairly long period is needed (typically 1 year) 12
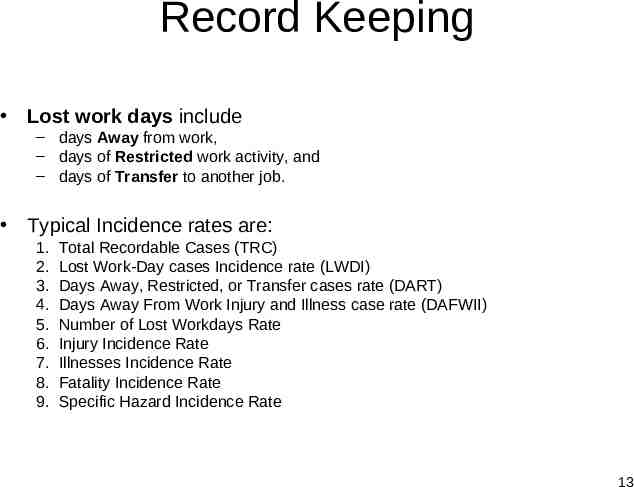
Record Keeping Lost work days include – days Away from work, – days of Restricted work activity, and – days of Transfer to another job. Typical Incidence rates are: 1. 2. 3. 4. 5. 6. 7. 8. 9. Total Recordable Cases (TRC) Lost Work-Day cases Incidence rate (LWDI) Days Away, Restricted, or Transfer cases rate (DART) Days Away From Work Injury and Illness case rate (DAFWII) Number of Lost Workdays Rate Injury Incidence Rate Illnesses Incidence Rate Fatality Incidence Rate Specific Hazard Incidence Rate 13
Recordkeeping OSHA relied on the LWDI for a long time, as a criterion for selecting high hazard industries for priority inspection – LWDI considers injuries only, not illness – LWDI considers lost-time injuries only, not all injuries. – LWDI do not include fatalities The Days-Away, Restricted, or Transferred Rate (DART) replace the LWDI (in 2008), as a criterion for inspection priority. – Because OSHA recognize the importance of including illness statistics as well as injury statistics in setting priorities for inspections. In counting the number of lost workdays, the date of the injury or start of illness should not be counted, even though the employee may leave work for most of that day. – Thus, if the employee returns to his regular job and is able to perform all regular duties full time on the day after the injury or illness, no lost workdays are counted. 14
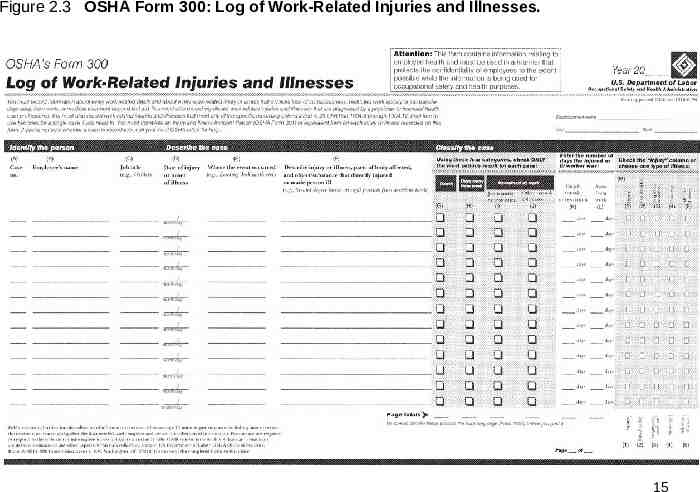
Figure 2.3 OSHA Form 300: Log of Work-Related Injuries and Illnesses. 15
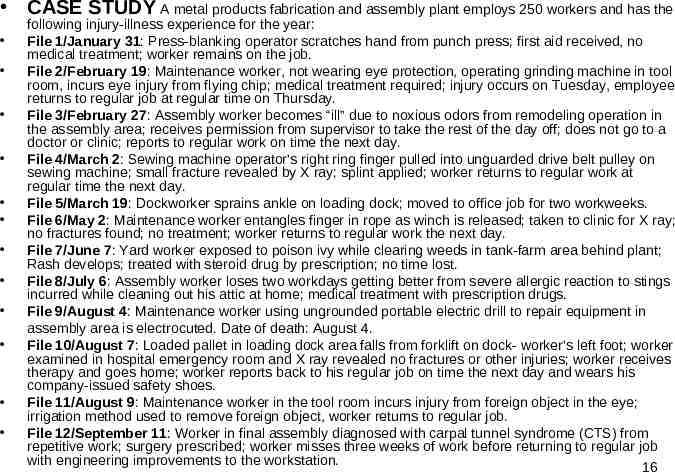
CASE STUDY A metal products fabrication and assembly plant employs 250 workers and has the following injury-illness experience for the year: File 1/January 31: Press-blanking operator scratches hand from punch press; first aid received, no medical treatment; worker remains on the job. File 2/February 19: Maintenance worker, not wearing eye protection, operating grinding machine in tool room, incurs eye injury from flying chip; medical treatment required; injury occurs on Tuesday, employee returns to regular job at regular time on Thursday. File 3/February 27: Assembly worker becomes “ill” due to noxious odors from remodeling operation in the assembly area; receives permission from supervisor to take the rest of the day off; does not go to a doctor or clinic; reports to regular work on time the next day. File 4/March 2: Sewing machine operator’s right ring finger pulled into unguarded drive belt pulley on sewing machine; small fracture revealed by X ray; splint applied; worker returns to regular work at regular time the next day. File 5/March 19: Dockworker sprains ankle on loading dock; moved to office job for two workweeks. File 6/May 2: Maintenance worker entangles finger in rope as winch is released; taken to clinic for X ray; no fractures found; no treatment; worker returns to regular work the next day. File 7/June 7: Yard worker exposed to poison ivy while clearing weeds in tank-farm area behind plant; Rash develops; treated with steroid drug by prescription; no time lost. File 8/July 6: Assembly worker loses two workdays getting better from severe allergic reaction to stings incurred while cleaning out his attic at home; medical treatment with prescription drugs. File 9/August 4: Maintenance worker using ungrounded portable electric drill to repair equipment in assembly area is electrocuted. Date of death: August 4. File 10/August 7: Loaded pallet in loading dock area falls from forklift on dock- worker’s left foot; worker examined in hospital emergency room and X ray revealed no fractures or other injuries; worker receives therapy and goes home; worker reports back to his regular job on time the next day and wears his company-issued safety shoes. File 11/August 9: Maintenance worker in the tool room incurs injury from foreign object in the eye; irrigation method used to remove foreign object, worker returns to regular job. File 12/September 11: Worker in final assembly diagnosed with carpal tunnel syndrome (CTS) from repetitive work; surgery prescribed; worker misses three weeks of work before returning to regular job with engineering improvements to the workstation. 16
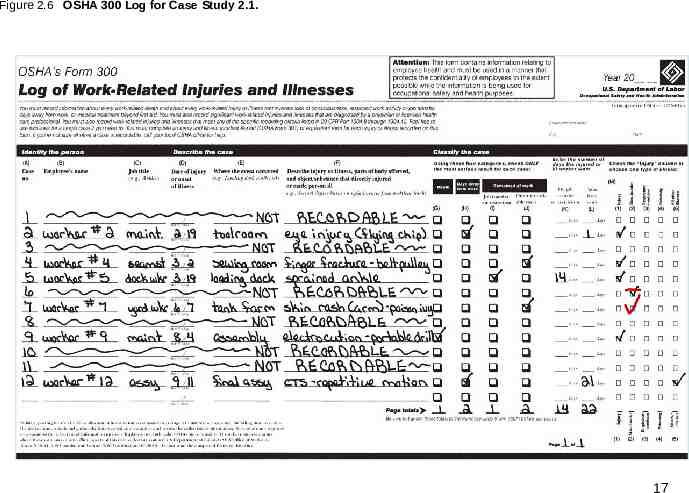
Figure 2.6 OSHA 300 Log for Case Study 2.1. 17
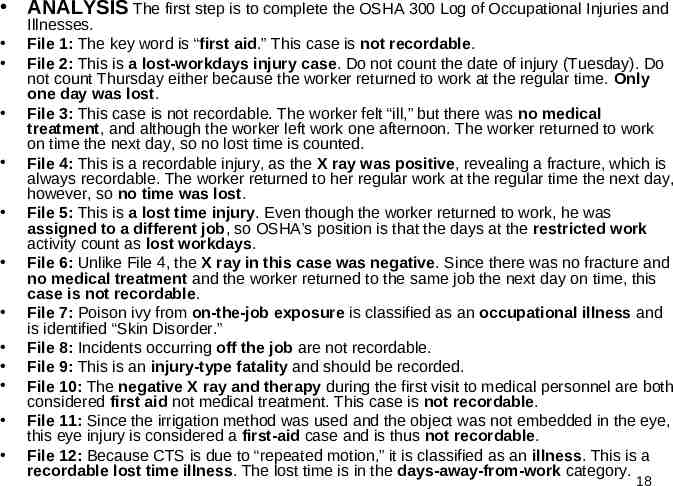
ANALYSIS The first step is to complete the OSHA 300 Log of Occupational Injuries and Illnesses. File 1: The key word is “first aid.” This case is not recordable. File 2: This is a lost-workdays injury case. Do not count the date of injury (Tuesday). Do not count Thursday either because the worker returned to work at the regular time. Only one day was lost. File 3: This case is not recordable. The worker felt “ill,” but there was no medical treatment, and although the worker left work one afternoon. The worker returned to work on time the next day, so no lost time is counted. File 4: This is a recordable injury, as the X ray was positive, revealing a fracture, which is always recordable. The worker returned to her regular work at the regular time the next day, however, so no time was lost. File 5: This is a lost time injury. Even though the worker returned to work, he was assigned to a different job, so OSHA’s position is that the days at the restricted work activity count as lost workdays. File 6: Unlike File 4, the X ray in this case was negative. Since there was no fracture and no medical treatment and the worker returned to the same job the next day on time, this case is not recordable. File 7: Poison ivy from on-the-job exposure is classified as an occupational illness and is identified “Skin Disorder.” File 8: Incidents occurring off the job are not recordable. File 9: This is an injury-type fatality and should be recorded. File 10: The negative X ray and therapy during the first visit to medical personnel are both considered first aid not medical treatment. This case is not recordable. File 11: Since the irrigation method was used and the object was not embedded in the eye, this eye injury is considered a first-aid case and is thus not recordable. File 12: Because CTS is due to “repeated motion,” it is classified as an illness. This is a recordable lost time illness. The lost time is in the days-away-from-work category. 18
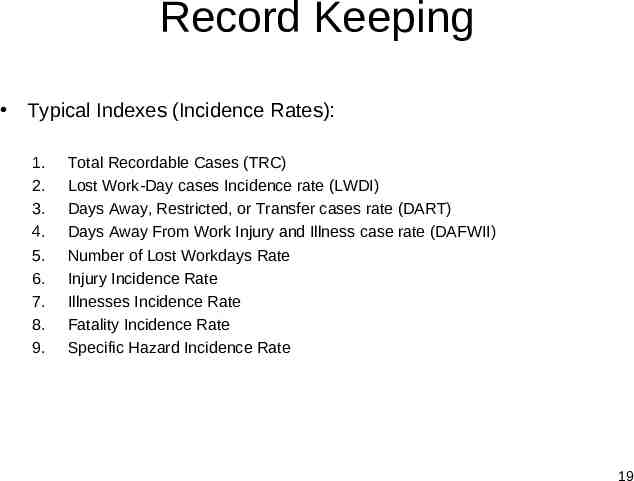
Record Keeping Typical Indexes (Incidence Rates): 1. 2. 3. 4. 5. 6. 7. 8. 9. Total Recordable Cases (TRC) Lost Work-Day cases Incidence rate (LWDI) Days Away, Restricted, or Transfer cases rate (DART) Days Away From Work Injury and Illness case rate (DAFWII) Number of Lost Workdays Rate Injury Incidence Rate Illnesses Incidence Rate Fatality Incidence Rate Specific Hazard Incidence Rate 19
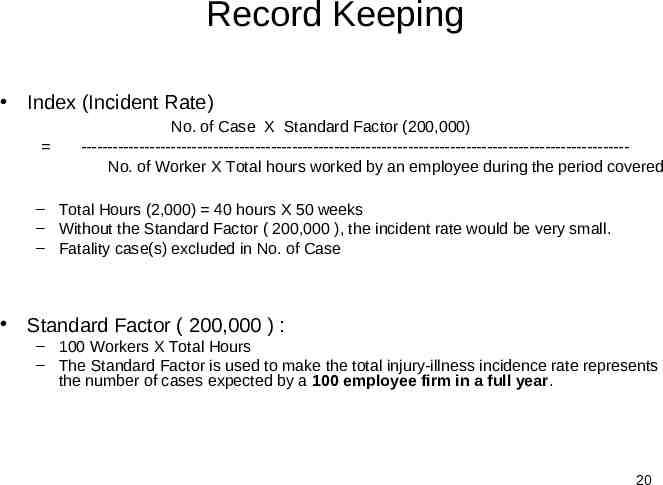
Record Keeping Index (Incident Rate) No. of Case X Standard Factor (200,000) -------------------------------------------------------------------------------------------------------No. of Worker X Total hours worked by an employee during the period covered – Total Hours (2,000) 40 hours X 50 weeks – Without the Standard Factor ( 200,000 ), the incident rate would be very small. – Fatality case(s) excluded in No. of Case Standard Factor ( 200,000 ) : – 100 Workers X Total Hours – The Standard Factor is used to make the total injury-illness incidence rate represents the number of cases expected by a 100 employee firm in a full year. 20
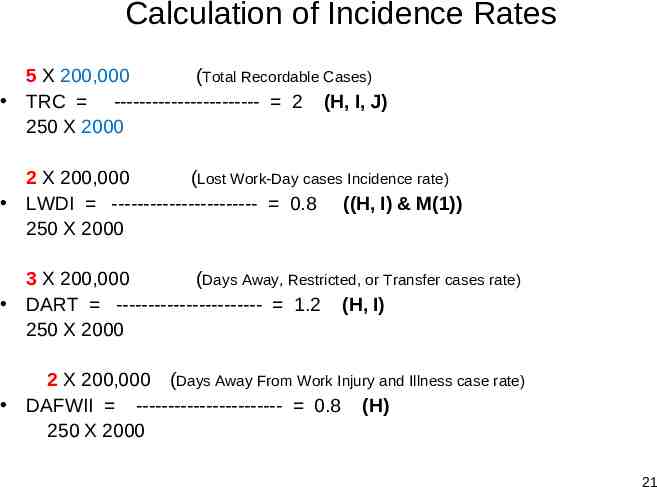
Calculation of Incidence Rates 5 X 200,000 (Total Recordable Cases) TRC ----------------------- 2 (H, I, J) 250 X 2000 2 X 200,000 (Lost Work-Day cases Incidence rate) LWDI ----------------------- 0.8 ((H, I) & M(1)) 250 X 2000 3 X 200,000 (Days Away, Restricted, or Transfer cases rate) DART ----------------------- 1.2 (H, I) 250 X 2000 2 X 200,000 (Days Away From Work Injury and Illness case rate) DAFWII ----------------------- 0.8 (H) 250 X 2000 21
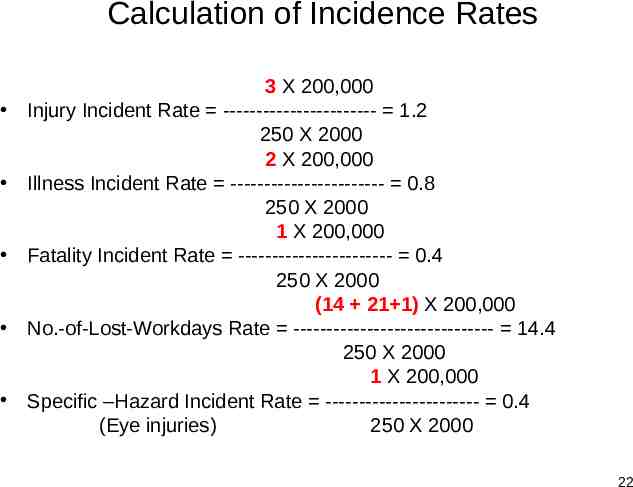
Calculation of Incidence Rates 3 X 200,000 Injury Incident Rate ----------------------- 1.2 250 X 2000 2 X 200,000 Illness Incident Rate ----------------------- 0.8 250 X 2000 1 X 200,000 Fatality Incident Rate ----------------------- 0.4 250 X 2000 (14 21 1) X 200,000 No.-of-Lost-Workdays Rate ------------------------------ 14.4 250 X 2000 1 X 200,000 Specific –Hazard Incident Rate ----------------------- 0.4 (Eye injuries) 250 X 2000 22
Accident Cause Analysis One of the important task of the safety and health manager is – to do a thorough analysis of the potential causes of injuries and illnesses that have already occurred in the plant. Even accidents or incidents that may not actually have caused injuries or illnesses, but which could have, should be studied to prevent their recurrence. Any occurrence of an unplanned, unwanted event should be considered in the prevention of future illnesses and injuries. Accident cause analysis and subsequent dissemination of this information to personnel who will be exposed to the hazards in the future is believed to – be the single most effective way of training workers to avoid injury and illness. 23
Accident Cause Analysis Accident analysis may leads to: – A design change in a product or process. – Change in work procedures to prevent future occurrences or at least to minimize the adverse effects of these occurrences. Even when nothing can be changed to prevent a future occurrence, at least workers can be informed of: – – – – what happened, what caused the accident, under what conditions the accident might occur again, and how to protect themselves in such an event. Informing workers of the facts and causes of accidents that have already happened to their coworkers is a very effective method of training workers to avoid injury and illness. Disadvantages of accident cause analysis: – It is “after the fact” (It is too late to prevent any losses) – Assigning blame / allocating legal liability 24
Organization of Committees The use of safety and health committees – Committees are generally appointed from the operating personal who knows more about processes and machines (employee involvement). – By periodic rotation, every worker will participate in (a plant-wide participation). – The committees conduct facility inspections, evaluate safety and health suggestions, analyze accident causes, and make recommendations. Advantages – Many valuable and practical ideas can be made (because they know a lot more about their process and machines than does the safety and health manager). – The personnel may accept more readily (because they are like themselves). Disadvantages – The committees may make ridiculous suggestions (if there is no resources and knowledge to function effectively). – They can dilute responsibilities for workplace safety and health. – They can degenerate into spy parties with the objective of discrediting the processes or procedures of other departments. 25
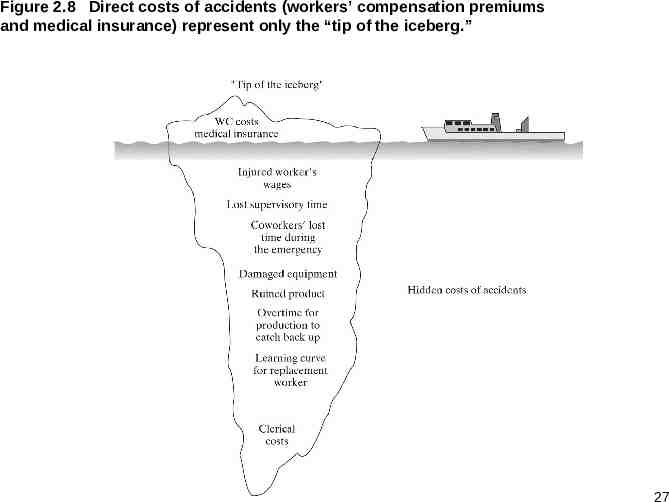
Safety and Health Economics Remember the relative definition of safety. – Top management bases safety and health decisions on dollars and cents (Business exists to make a profit). – Safety and health managers should formulate their objective (the prevention of injuries and illnesses) as economic objective. Total costs of injuries and illness include (Figure 2.7) – Direct cost: workers’ compensation and medical costs (the tip of the iceberg). Other intangible costs are (according to NSC): – Cost of wages paid for time lost by injured workers. – Cost of wages paid for time lost by workers who were not injured (watching, talking, waiting for equipment restoration, or need the help of the injured worker). – Cost of damage to material or equipment. – Extra cost of overtime work necessitated by the accident. – Wage cost caused by decreased output of injured worker after return to work. – Cost of learning period of new worker. – Uninsured medical cost. – Cost of time spent by higher supervision and clerical workers 26
Figure 2.8 Direct costs of accidents (workers’ compensation premiums and medical insurance) represent only the “tip of the iceberg.” 27
Home Work #2 1 30 33, 45, 46, 47 A total of 34 questions 28
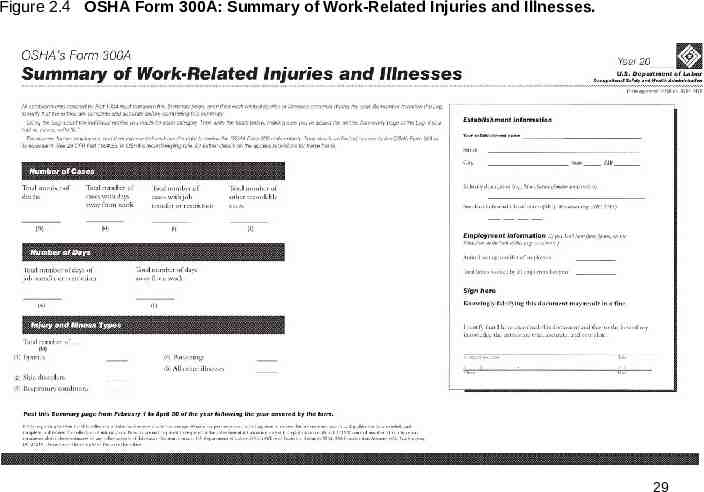
Figure 2.4 OSHA Form 300A: Summary of Work-Related Injuries and Illnesses. 29
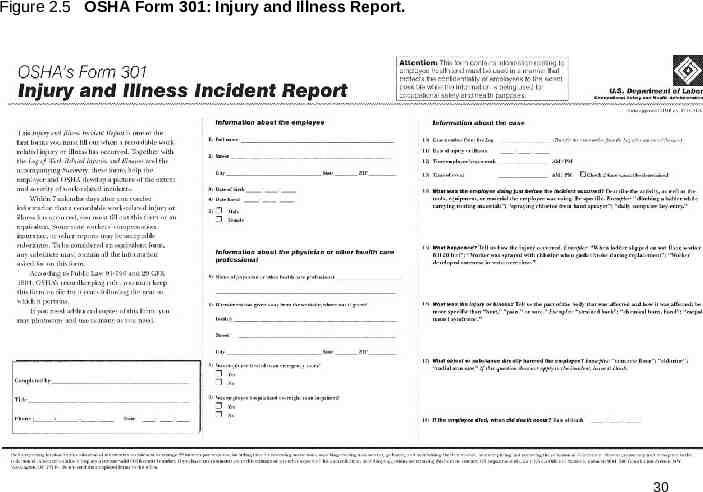
Figure 2.5 OSHA Form 301: Injury and Illness Report. 30