CAPNOGRAPHY: IT’S ABOUT MORE THAN VENTILATION!


56 Slides6.71 MB
CAPNOGRAPHY: IT’S ABOUT MORE THAN VENTILATION! HealthTrust Resuscitation Webinar Series
Nicole Kupchik MN, RN, CCNS, CCRN, PCCN-CMC Clinical Nurse Specialist Former Code Blue Committee CoChair Currently consultant Staff Nurse National resuscitation presentations: American Heart Association (AHA) Emergency Cardiovascular Care Updates (ECCU) Society of Critical Care Medicine (SCCM) National Teaching Institute (NTI) Emergency Nurses Association (ENA)
CAPNOGRAPHY: IT’S ABOUT MORE THAN VENTILATION! HealthTrust Resuscitation Webinar Series
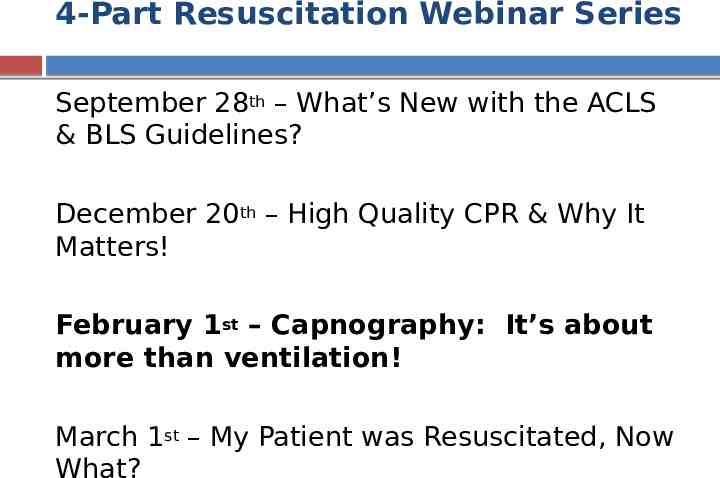
4-Part Resuscitation Webinar Series September 28th – What’s New with the ACLS & BLS Guidelines? December 20th – High Quality CPR & Why It Matters! February 1st – Capnography: It’s about more than ventilation! March 1st – My Patient was Resuscitated, Now What?
Objectives: Discuss normal & abnormal V/Q relationships Describe Capnography as an indicator of fluid responsiveness Discuss the integration of Capnography into a resuscitation program
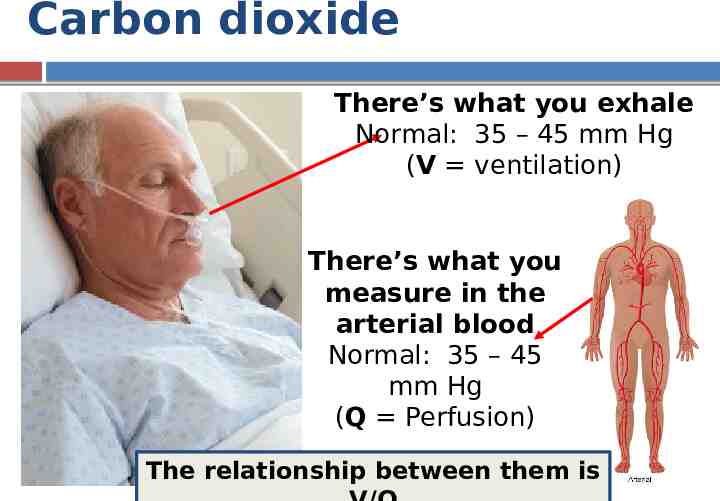
Carbon dioxide There’s what you exhale Normal: 35 – 45 mm Hg (V ventilation) There’s what you measure in the arterial blood Normal: 35 – 45 mm Hg (Q Perfusion) The relationship between them is
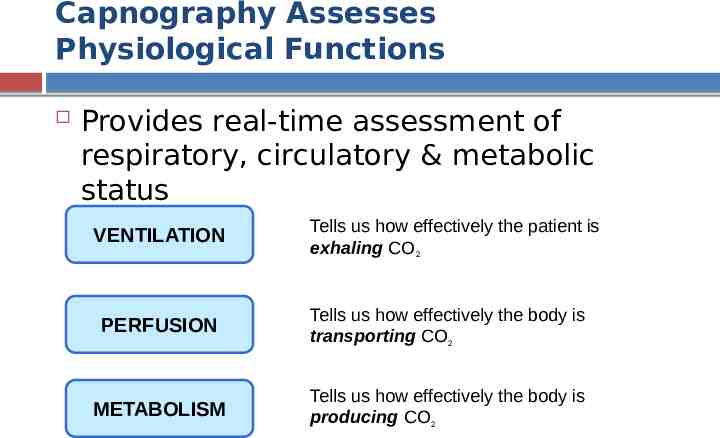
Capnography Assesses Physiological Functions Provides real-time assessment of respiratory, circulatory & metabolic status VENTILATION Tells us how effectively the patient is exhaling CO2 PERFUSION Tells us how effectively the body is transporting CO2 METABOLISM Tells us how effectively the body is producing CO2
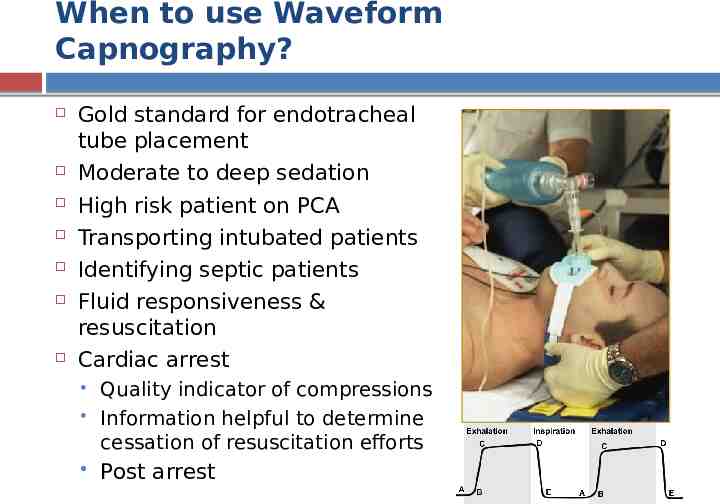
When to use Waveform Capnography? Gold standard for endotracheal tube placement Moderate to deep sedation High risk patient on PCA Transporting intubated patients Identifying septic patients Fluid responsiveness & resuscitation Cardiac arrest Quality indicator of compressions Information helpful to determine cessation of resuscitation efforts Post arrest
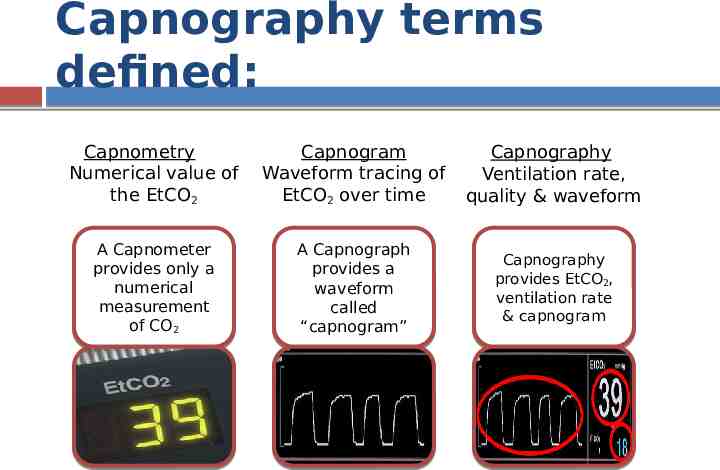
Capnography terms defined: Capnometry Numerical value of the EtCO2 Capnogram Waveform tracing of EtCO2 over time Capnography Ventilation rate, quality & waveform A Capnometer provides only a numerical measurement of CO22 A Capnograph provides a waveform called “capnogram” Capnography provides EtCO22, ventilation rate & capnogram
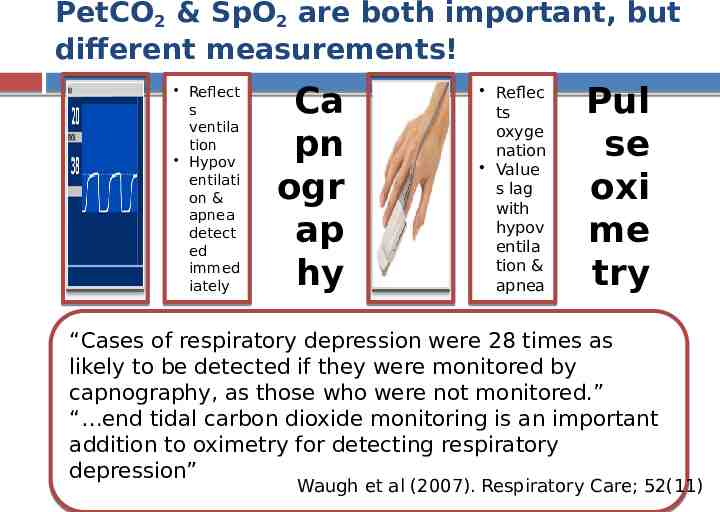
PetCO2 & SpO2 are both important, but different measurements! Reflect s ventila tion Hypov entilati on & apnea detect ed immed iately Ca pn ogr ap hy Reflec ts oxyge nation Value s lag with hypov entila tion & apnea Pul se oxi me try “Cases of respiratory depression were 28 times as likely to be detected if they were monitored by capnography, as those who were not monitored.” “ end tidal carbon dioxide monitoring is an important addition to oximetry for detecting respiratory depression” Waugh et al (2007). Respiratory Care; 52(11)
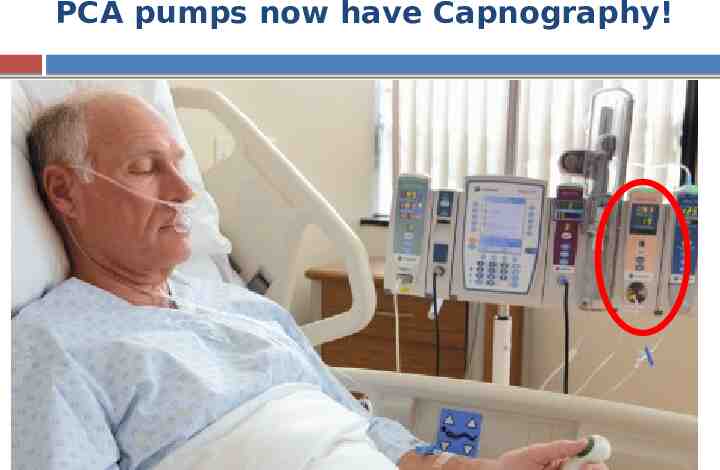
PCA pumps now have Capnography!
American Society of Anesthesiologists National standard mandate Ventilation should be monitored via PEtCO2 for all patients receiving moderate to deep sedation who are not intubated Since 2010!
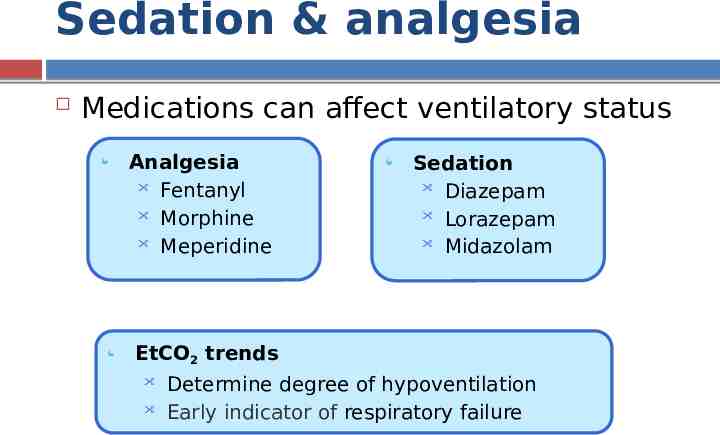
Sedation & analgesia Medications can affect ventilatory status Analgesia Fentanyl Morphine Meperidine Sedation Diazepam Lorazepam Midazolam EtCO2 trends Determine degree of hypoventilation Early indicator of respiratory failure
Alcohol Intoxication or Drug Ingestion Excessive alcohol alone or combined with sedative drugs can cause Severe hypoventilation Obtundation Respiratory failure Capnography provides an early indicator of impending respiratory failure.
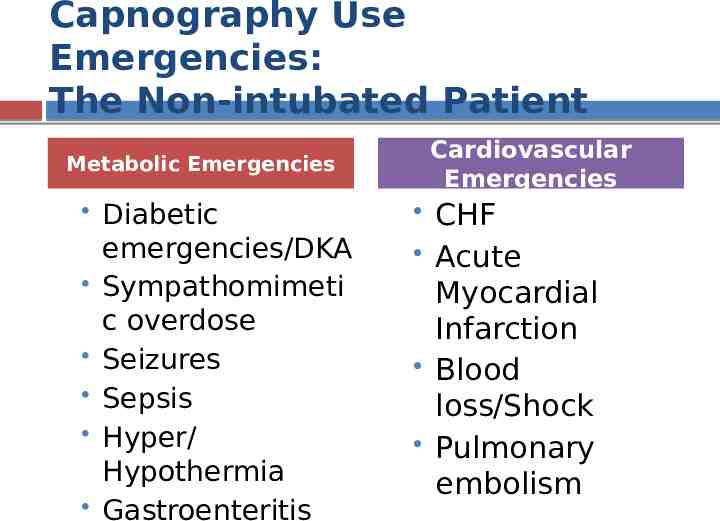
Capnography Use Emergencies: The Non-intubated Patient Cardiovascular Emergencies Metabolic Emergencies Diabetic emergencies/DKA Sympathomimeti c overdose Seizures Sepsis Hyper/ Hypothermia Gastroenteritis CHF Acute Myocardial Infarction Blood loss/Shock Pulmonary embolism
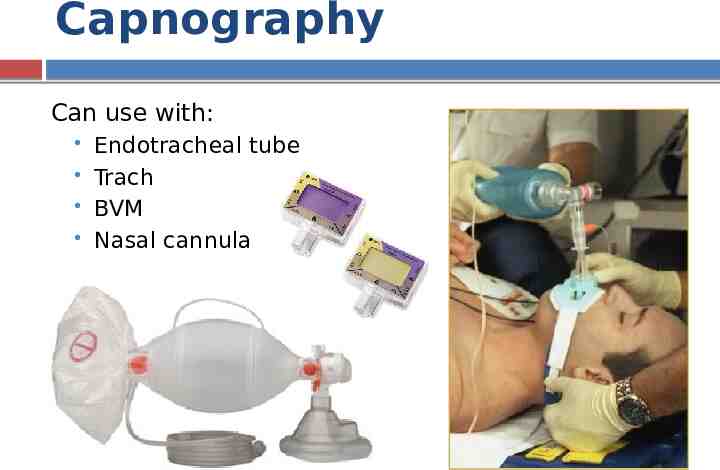
Capnography Can use with: Endotracheal tube Trach BVM Nasal cannula
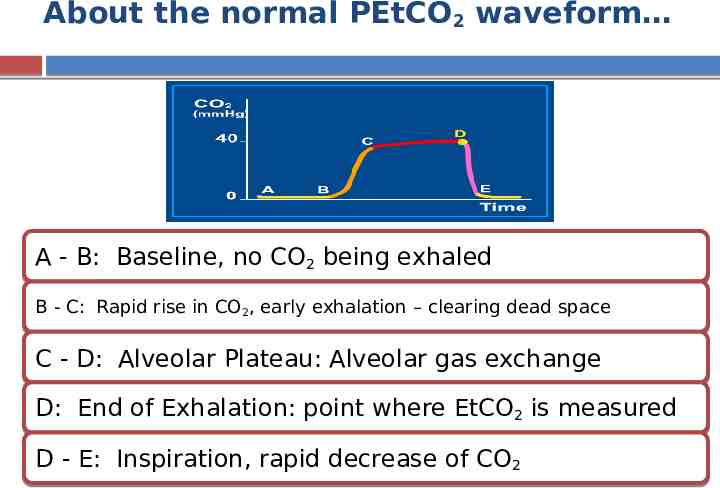
About the normal PEtCO2 waveform A - B: Baseline, no CO2 being exhaled B - C: Rapid rise in CO22, early exhalation – clearing dead space C - D: Alveolar Plateau: Alveolar gas exchange D: End of Exhalation: point where EtCO2 is measured D - E: Inspiration, rapid decrease of CO2
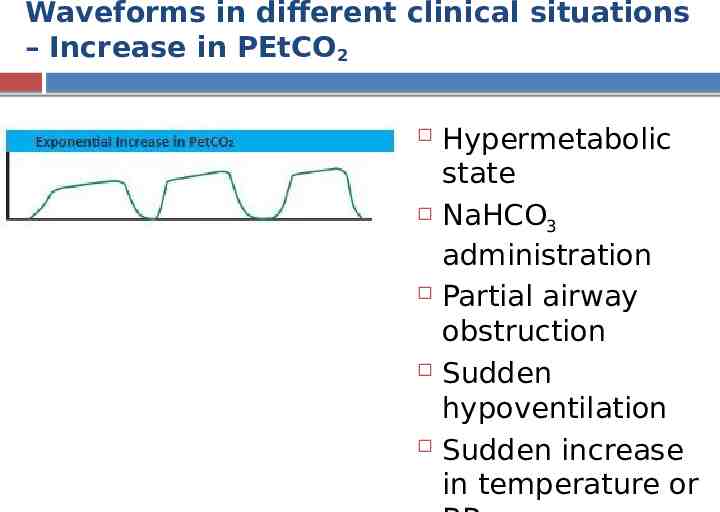
Waveforms in different clinical situations – Increase in PEtCO2 Hypermetabolic state NaHCO3 administration Partial airway obstruction Sudden hypoventilation Sudden increase in temperature or
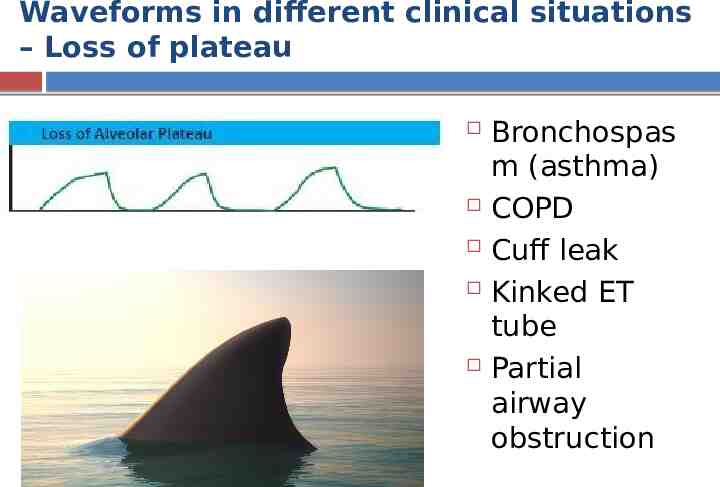
Waveforms in different clinical situations – Loss of plateau Bronchospas m (asthma) COPD Cuff leak Kinked ET tube Partial airway obstruction
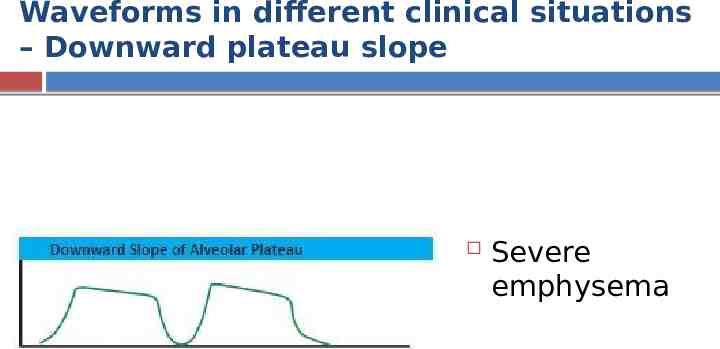
Waveforms in different clinical situations – Downward plateau slope Severe emphysema
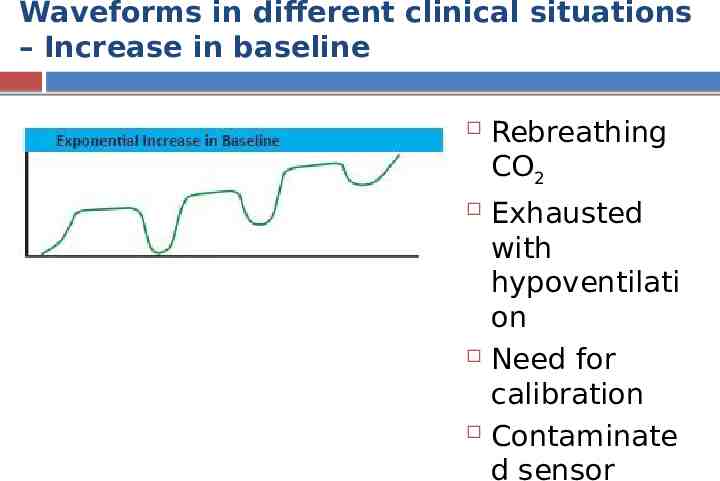
Waveforms in different clinical situations – Increase in baseline Rebreathing CO2 Exhausted with hypoventilati on Need for calibration Contaminate d sensor
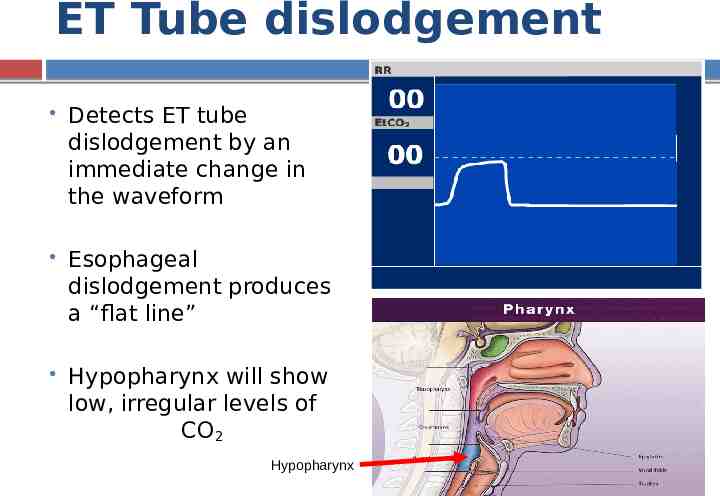
ET Tube dislodgement Detects ET tube dislodgement by an immediate change in the waveform Esophageal dislodgement produces a “flat line” Hypopharynx will show low, irregular levels of CO2 Hypopharynx
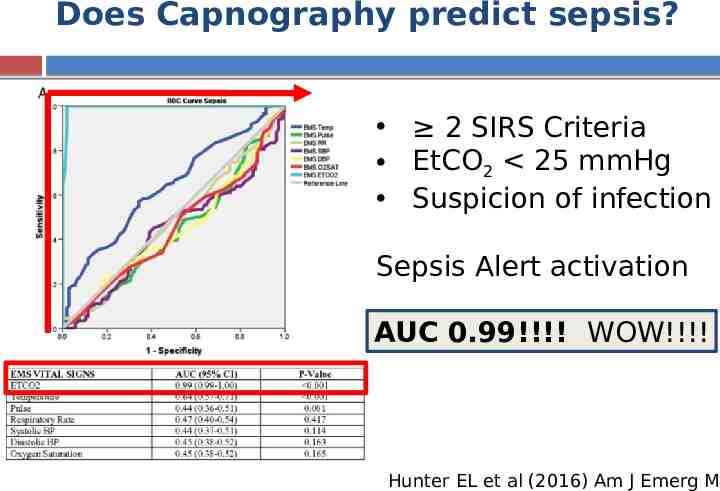
Quick stats lesson! CVP is a HUGE FAIL!!! The ability of each parameter (plus useless & stupid!!!!) to predict fluid responsiveness: So why are we still measuring Area under the curveit?! (AUC): 1.0 Perfect! 0.99 – 0.9 Excellent! 0.8 – 0.9 Good! 0.7 – 0.8 Fair 0.6 – 0.7 Poor 0.5 – 0.6 Fail AUC CVP 0.56 Michard et. al Am J Resp Crit Care Med, 200
Does Capnography predict sepsis? 2 SIRS Criteria EtCO2 25 mmHg Suspicion of infection Sepsis Alert activation AUC 0.99!!!! WOW!!!! Hunter EL et al (2016) Am J Emerg M
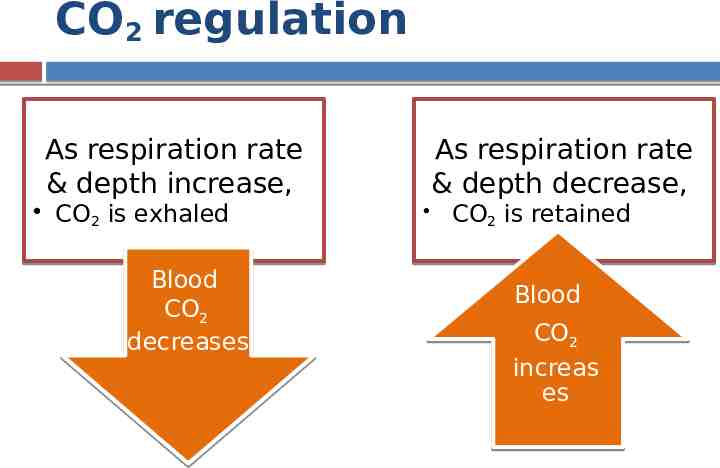
CO2 regulation As respiration rate & depth increase, CO2 is exhaled Blood CO2 decreases As respiration rate & depth decrease, CO2 is retained Blood CO2 increas es
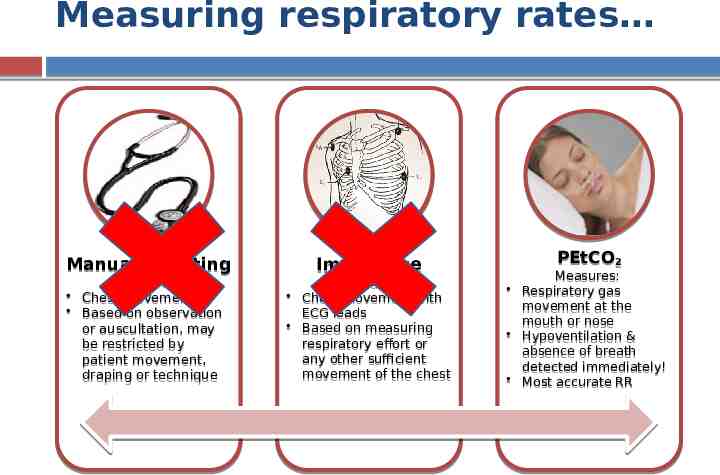
Measuring respiratory rates Manual Counting Measures: Chest movement Based on observation or auscultation, may be restricted by patient movement, draping or technique Impedance Measures: Chest movement with ECG leads Based on measuring respiratory effort or any other sufficient movement of the chest PEtCO22 Measures: Respiratory gas movement at the mouth or nose Hypoventilation & absence of breath detected immediately! Most accurate RR
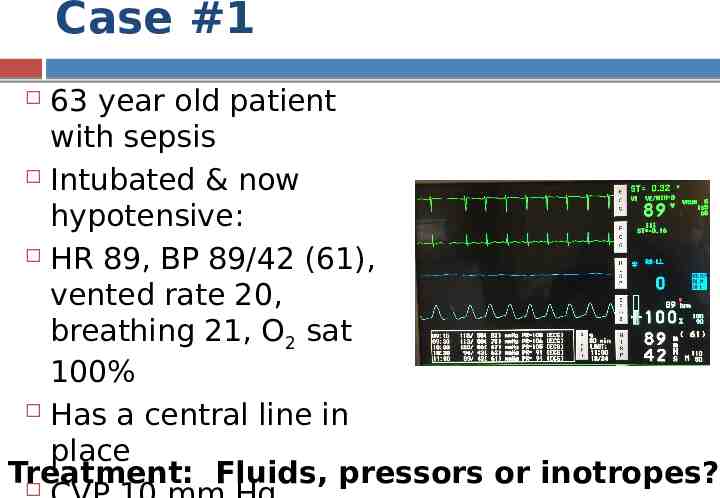
Case #1 63 year old patient with sepsis Intubated & now hypotensive: HR 89, BP 89/42 (61), vented rate 20, breathing 21, O2 sat 100% Has a central line in place Treatment: Fluids, pressors or inotropes?
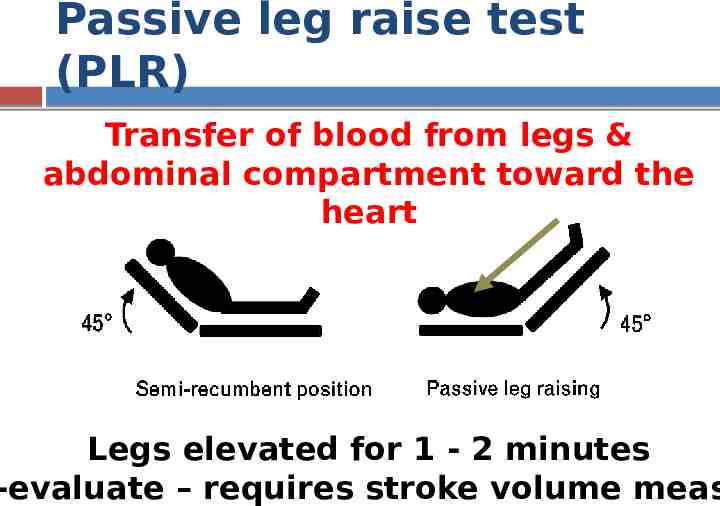
Passive leg raise test (PLR) Transfer of blood from legs & abdominal compartment toward the heart Legs elevated for 1 - 2 minutes -evaluate – requires stroke volume meas
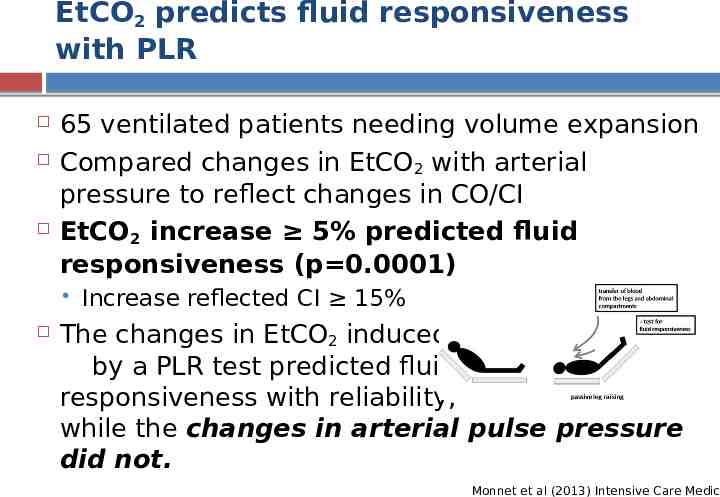
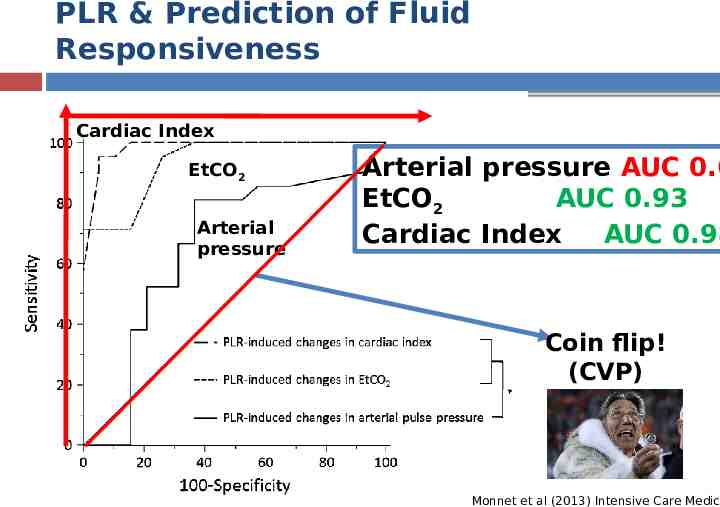
EtCO2 predicts fluid responsiveness with PLR 65 ventilated patients needing volume expansion Compared changes in EtCO2 with arterial pressure to reflect changes in CO/CI EtCO2 increase 5% predicted fluid responsiveness (p 0.0001) Increase reflected CI 15% The changes in EtCO2 induced by a PLR test predicted fluid responsiveness with reliability, while the changes in arterial pulse pressure did not. Monnet et al (2013) Intensive Care Medic
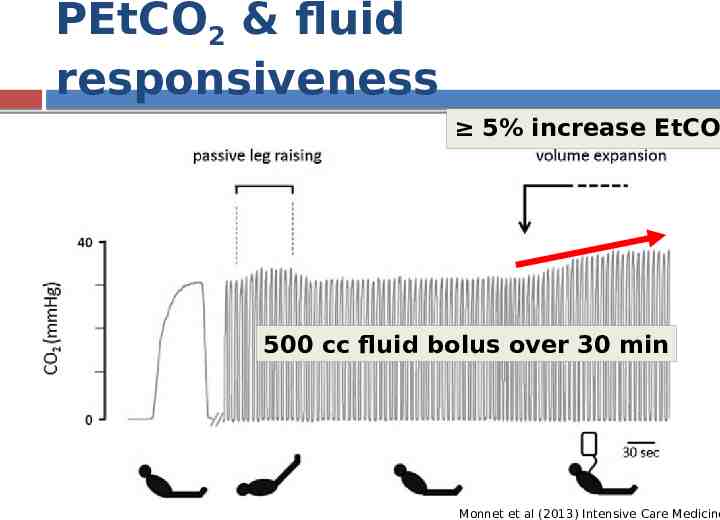
PEtCO2 & fluid responsiveness 5% increase EtCO 500 cc fluid bolus over 30 min Monnet et al (2013) Intensive Care Medicine
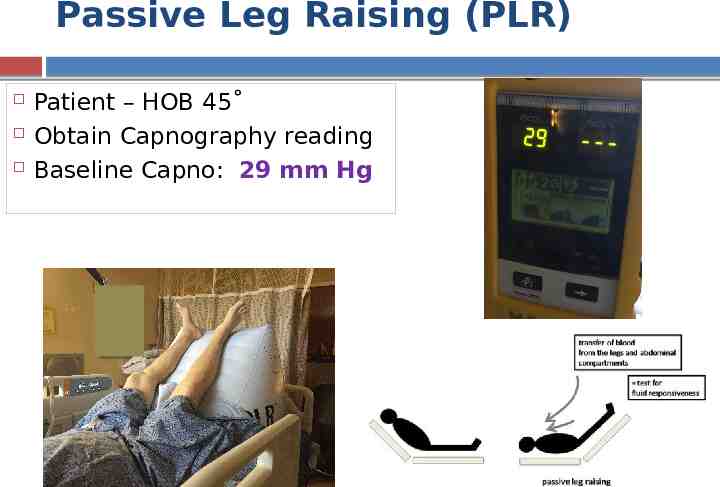
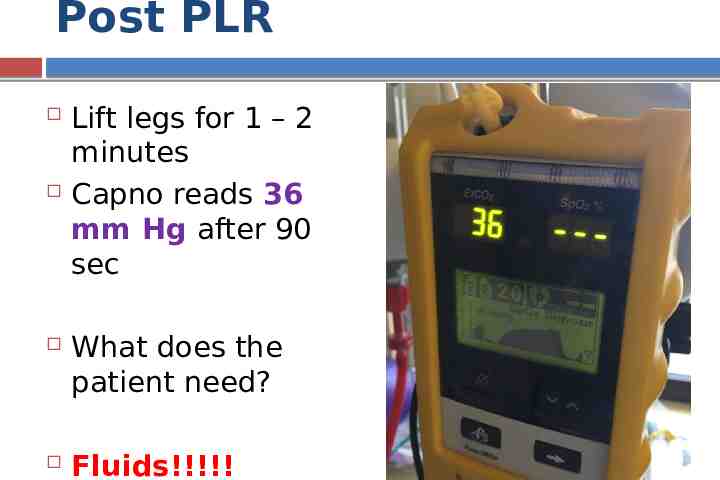
Passive Leg Raising (PLR) Patient – HOB 45 Obtain Capnography reading Baseline Capno: 29 mm Hg
Post PLR Lift legs for 1 – 2 minutes Capno reads 36 mm Hg after 90 sec What does the patient need? Fluids!!!!!
PLR & Prediction of Fluid Responsiveness Cardiac Index EtCO2 Arterial pressure Arterial pressure AUC 0.6 EtCO2 AUC 0.93 Cardiac Index AUC 0.98 Coin flip! (CVP) Monnet et al (2013) Intensive Care Medic
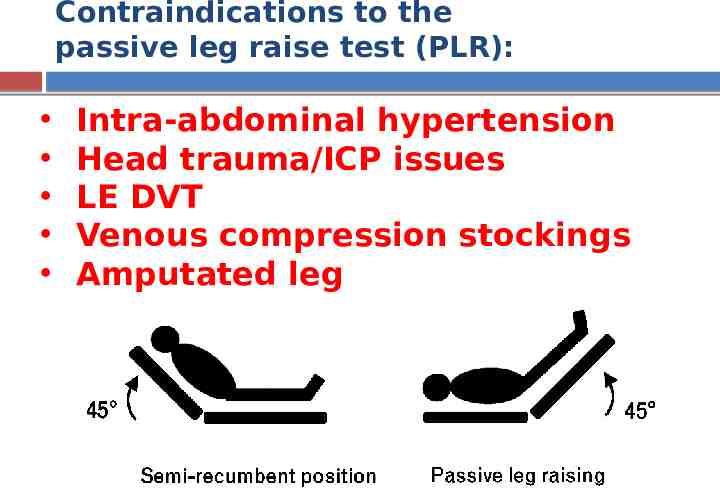
Contraindications to the passive leg raise test (PLR): Intra-abdominal hypertension Head trauma/ICP issues LE DVT Venous compression stockings Amputated leg
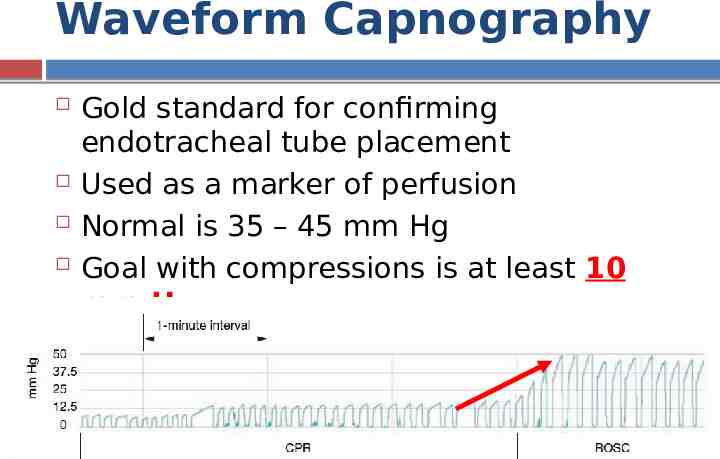
Waveform Capnography Gold standard for confirming endotracheal tube placement Used as a marker of perfusion Normal is 35 – 45 mm Hg Goal with compressions is at least 10 mm Hg Will see increase with ROSC
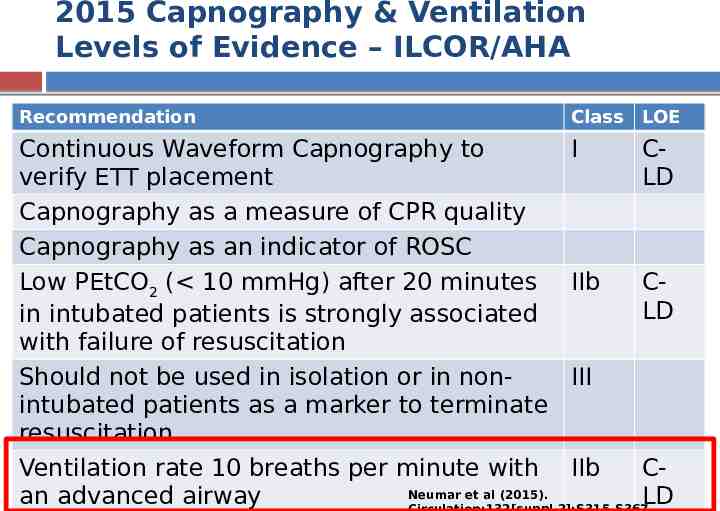
2015 Capnography & Ventilation Levels of Evidence – ILCOR/AHA Recommendation Class LOE Continuous Waveform Capnography to verify ETT placement Capnography as a measure of CPR quality Capnography as an indicator of ROSC Low PEtCO2 ( 10 mmHg) after 20 minutes in intubated patients is strongly associated with failure of resuscitation Should not be used in isolation or in nonintubated patients as a marker to terminate resuscitation Ventilation rate 10 breaths per minute with Neumar et al (2015). an advanced airway I CLD IIb CLD III IIb CLD
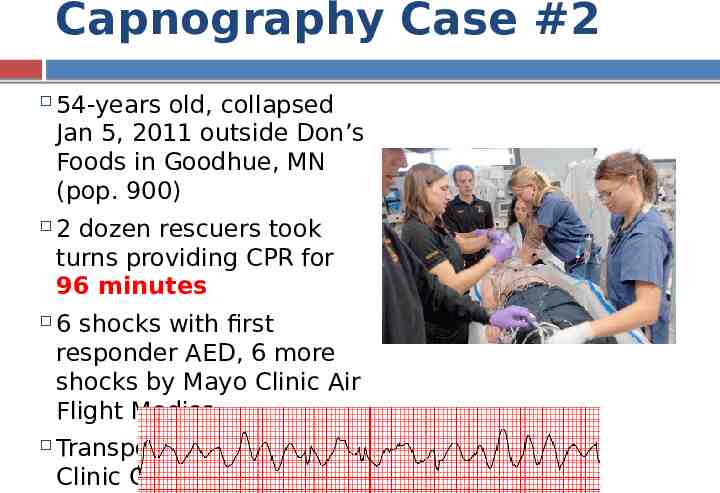
Capnography Case #2 54-years old, collapsed Jan 5, 2011 outside Don’s Foods in Goodhue, MN (pop. 900) 2 dozen rescuers took turns providing CPR for 96 minutes 6 shocks with first responder AED, 6 more shocks by Mayo Clinic Air Flight Medics Transported to Mayo Clinic Cardiac Cath Lab
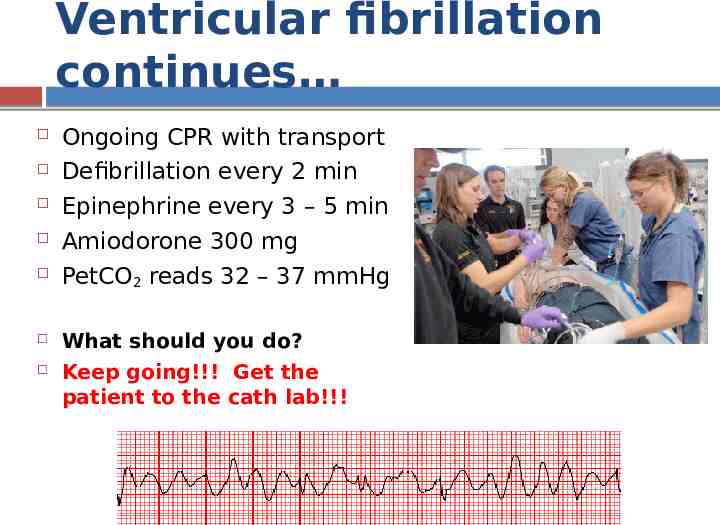
Ventricular fibrillation continues Ongoing CPR with transport Defibrillation every 2 min Epinephrine every 3 – 5 min Amiodorone 300 mg PetCO2 reads 32 – 37 mmHg What should you do? Keep going!!! Get the patient to the cath lab!!!
Why Not Quit? Thrombectomy, stent to LAD 10 days in hospital “The capnography told us not to give up!” EtCO2 averaged 35 mmHg (range 32 – 37)
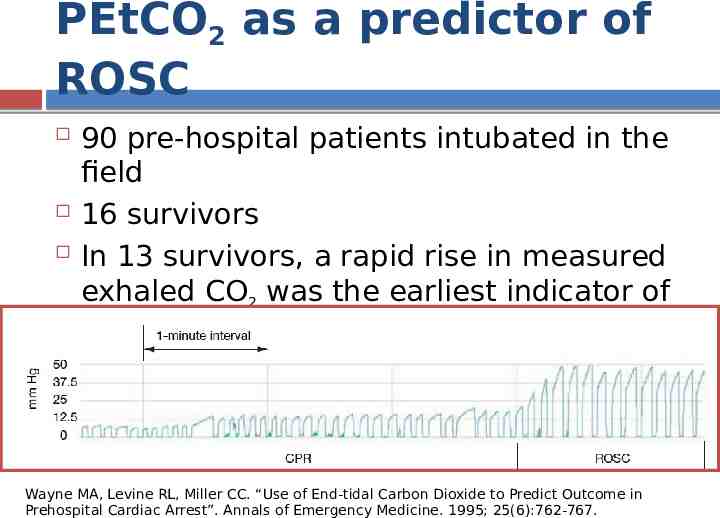
PEtCO2 as a predictor of ROSC 90 pre-hospital patients intubated in the field 16 survivors In 13 survivors, a rapid rise in measured exhaled CO2 was the earliest indicator of ROSC Before a pulse or blood pressure were palpable Wayne MA, Levine RL, Miller CC. “Use of End-tidal Carbon Dioxide to Predict Outcome in Prehospital Cardiac Arrest”. Annals of Emergency Medicine. 1995; 25(6):762-767.
Capnography Case #3 58 y/o male admitted to the ortho unit post laminectomy 8 hours post-op he suffered 70 min Vfib arrest EtCO remained in the 30 - 40s during 2 the code The next day he was awake and alert but remained intubated Discharged to home on day 7 fully intact
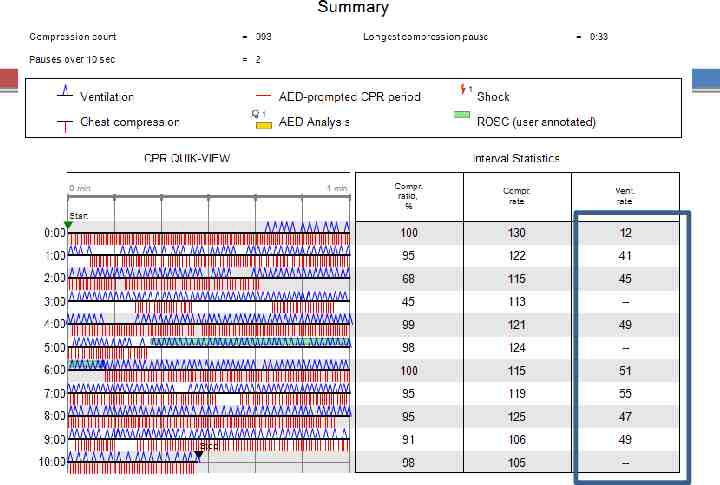
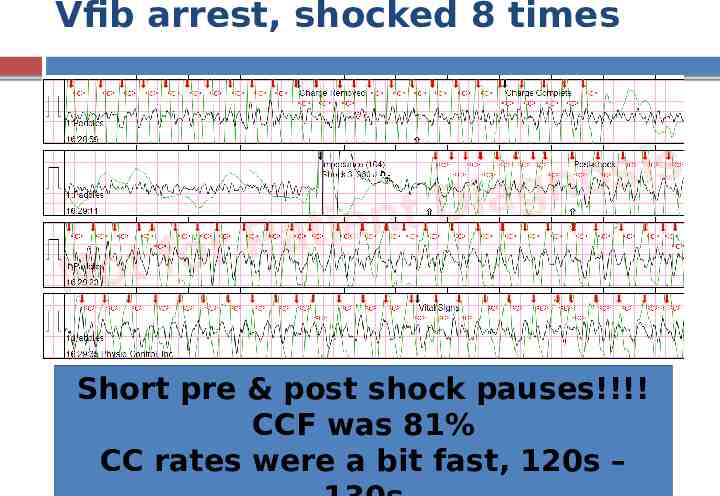
Vfib arrest, shocked 8 times Short pre & post shock pauses!!!! CCF was 81% CC rates were a bit fast, 120s –
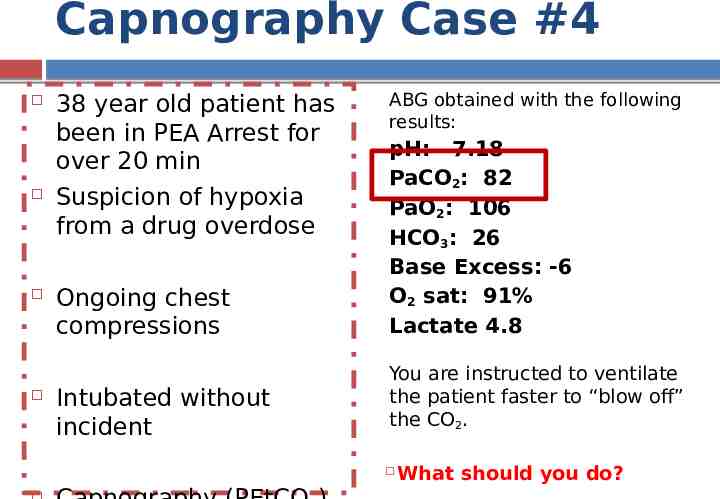
Capnography Case #4 38 year old patient has been in PEA Arrest for over 20 min Suspicion of hypoxia from a drug overdose ABG obtained with the following results: Ongoing chest compressions pH: 7.18 PaCO2: 82 PaO2: 106 HCO3: 26 Base Excess: -6 O2 sat: 91% Lactate 4.8 Intubated without incident You are instructed to ventilate the patient faster to “blow off” the CO2. What should you do?
Case #5 52 year old patient goes into Ventricular Fibrillation Chest compressions started Defibrillated with 200 joules, chest compressions immediately restarted Epinephrine 1 mg administered Intubated with assisted ventilations with 1 breath every 6 seconds Waveform Capnography started initial reading is 20 mmHg Recommendations?
After 4 minutes Rhythm is assessed, remains in Ventricular Fibrillation Defibrillated with 300 joules, new provider begins compressions Waveform Capnography reading 9 mm Hg Recommendation? Compress deeper, assess rate! Provider compresses deeper, but PEtCO 2 remains 10 mm Hg Recommendations?
3 minutes later (7 min into the arrest) Waveform Capnography is reading 38 mmHg Recommendations? Go until the end of the 2 minute cycle & assess for a pulse At the end of 2 minutes, there is a pulse!!! Waveform Capnography is currently reading 34 mmHg
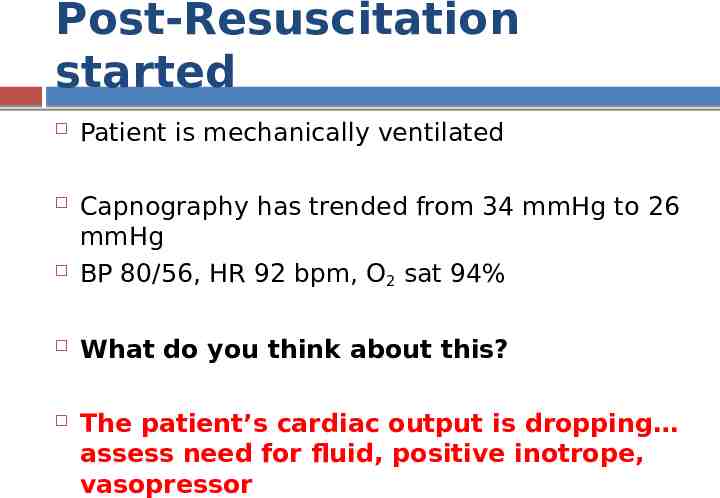
Post-Resuscitation started Patient is mechanically ventilated Capnography has trended from 34 mmHg to 26 mmHg BP 80/56, HR 92 bpm, O2 sat 94% What do you think about this? The patient’s cardiac output is dropping assess need for fluid, positive inotrope, vasopressor
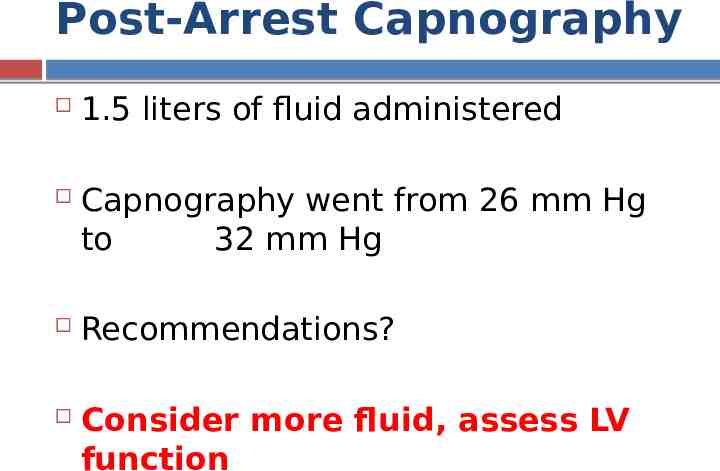
Post-Arrest Capnography 1.5 liters of fluid administered Capnography went from 26 mm Hg to 32 mm Hg Recommendations? Consider more fluid, assess LV function
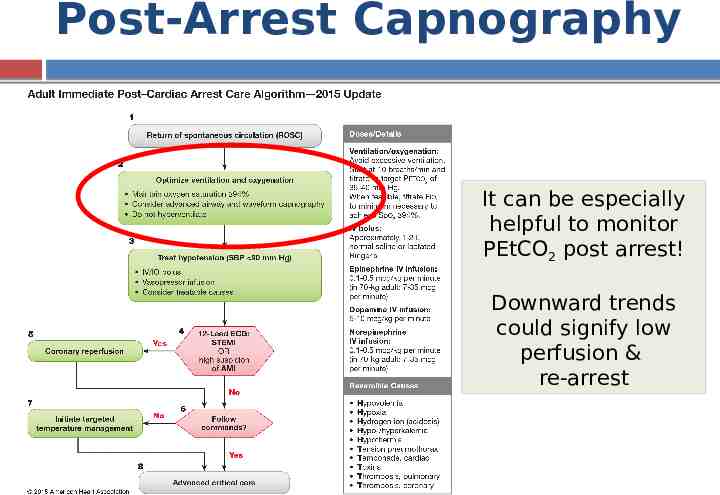
Post-Arrest Capnography It can be especially helpful to monitor PEtCO2 post arrest! Downward trends could signify low perfusion & re-arrest
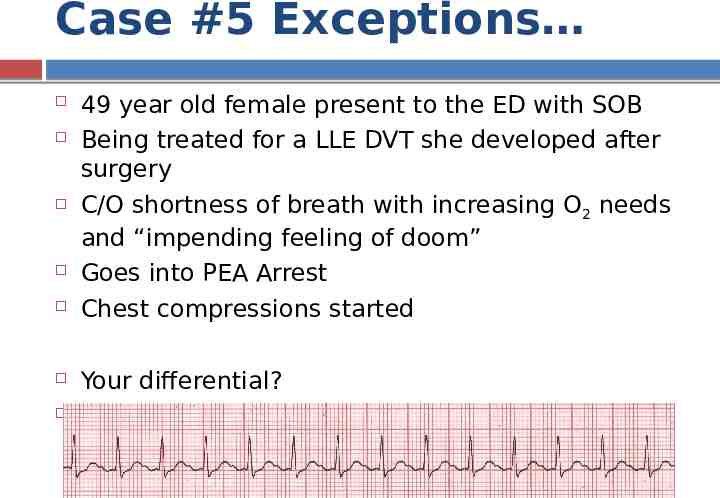
Case #5 Exceptions 49 year old female present to the ED with SOB Being treated for a LLE DVT she developed after surgery C/O shortness of breath with increasing O2 needs and “impending feeling of doom” Goes into PEA Arrest Chest compressions started Your differential? Pulmonary embolism
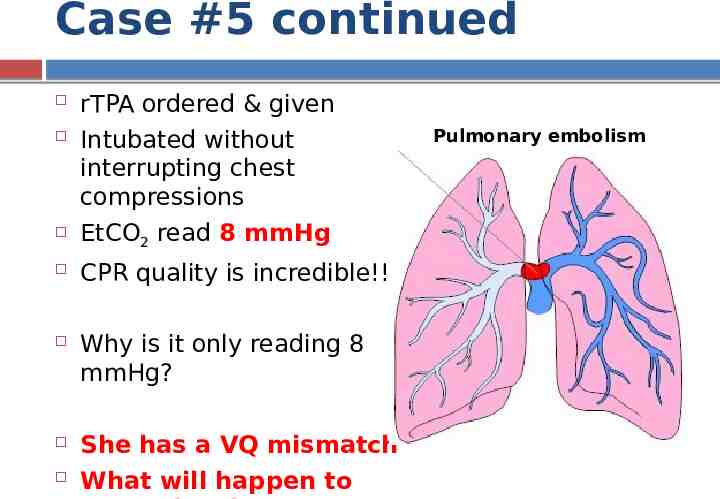
Case #5 continued rTPA ordered & given Intubated without interrupting chest compressions EtCO2 read 8 mmHg CPR quality is incredible!!! Why is it only reading 8 mmHg? She has a VQ mismatch What will happen to Pulmonary embolism
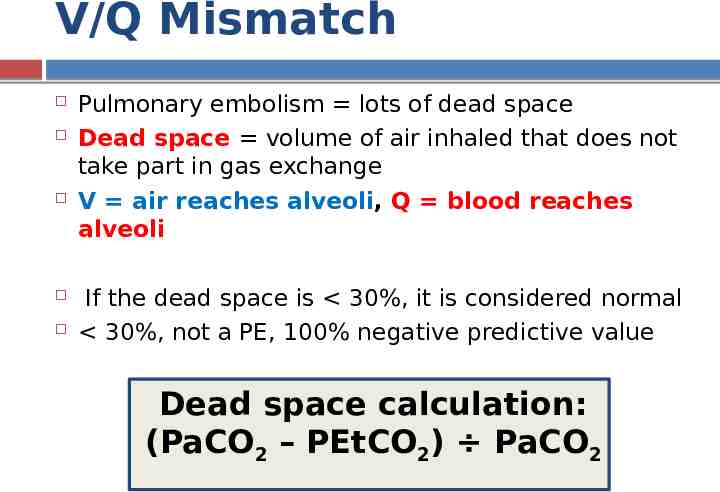
V/Q Mismatch Pulmonary embolism lots of dead space Dead space volume of air inhaled that does not take part in gas exchange V air reaches alveoli, Q blood reaches alveoli If the dead space is 30%, it is considered normal 30%, not a PE, 100% negative predictive value Dead space calculation: (PaCO2 – PEtCO2) PaCO2
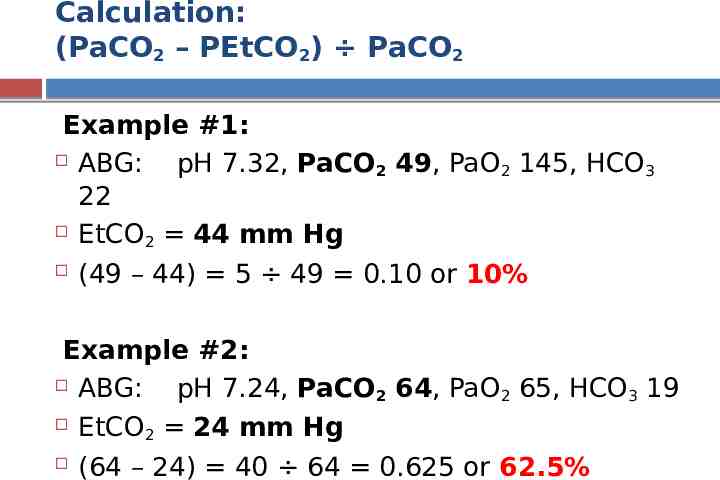
Calculation: (PaCO2 – PEtCO2) PaCO2 Example #1: ABG: pH 7.32, PaCO2 49, PaO2 145, HCO3 22 EtCO 44 mm Hg 2 (49 – 44) 5 49 0.10 or 10% Example #2: ABG: pH 7.24, PaCO2 64, PaO2 65, HCO3 19 EtCO2 24 mm Hg (64 – 24) 40 64 0.625 or 62.5%
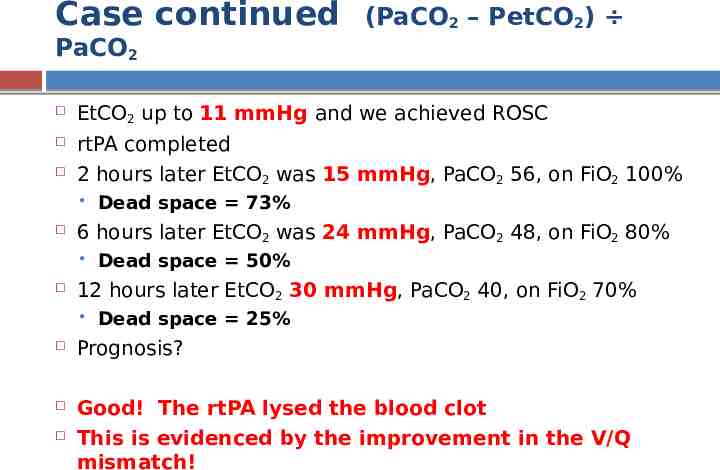
Case continued (PaCO2 – PetCO2) PaCO2 EtCO2 up to 11 mmHg and we achieved ROSC rtPA completed 2 hours later EtCO2 was 15 mmHg, PaCO2 56, on FiO2 100% 6 hours later EtCO2 was 24 mmHg, PaCO2 48, on FiO2 80% Dead space 73% Dead space 50% 12 hours later EtCO2 30 mmHg, PaCO2 40, on FiO2 70% Dead space 25% Prognosis? Good! The rtPA lysed the blood clot This is evidenced by the improvement in the V/Q mismatch!
In conclusion: Capnography is a Level 1A recommendation for verification of endotracheal tube placement Capnography can be helpful with: Monitoring ventilation in intubated & nonintubated patients Identifying sepsis Fluid responsiveness V/Q matching CPR quality & termination of resuscitation