Analyzing Categorical Data in JMP Melinda Thielbar Senior
10 Slides1.57 MB
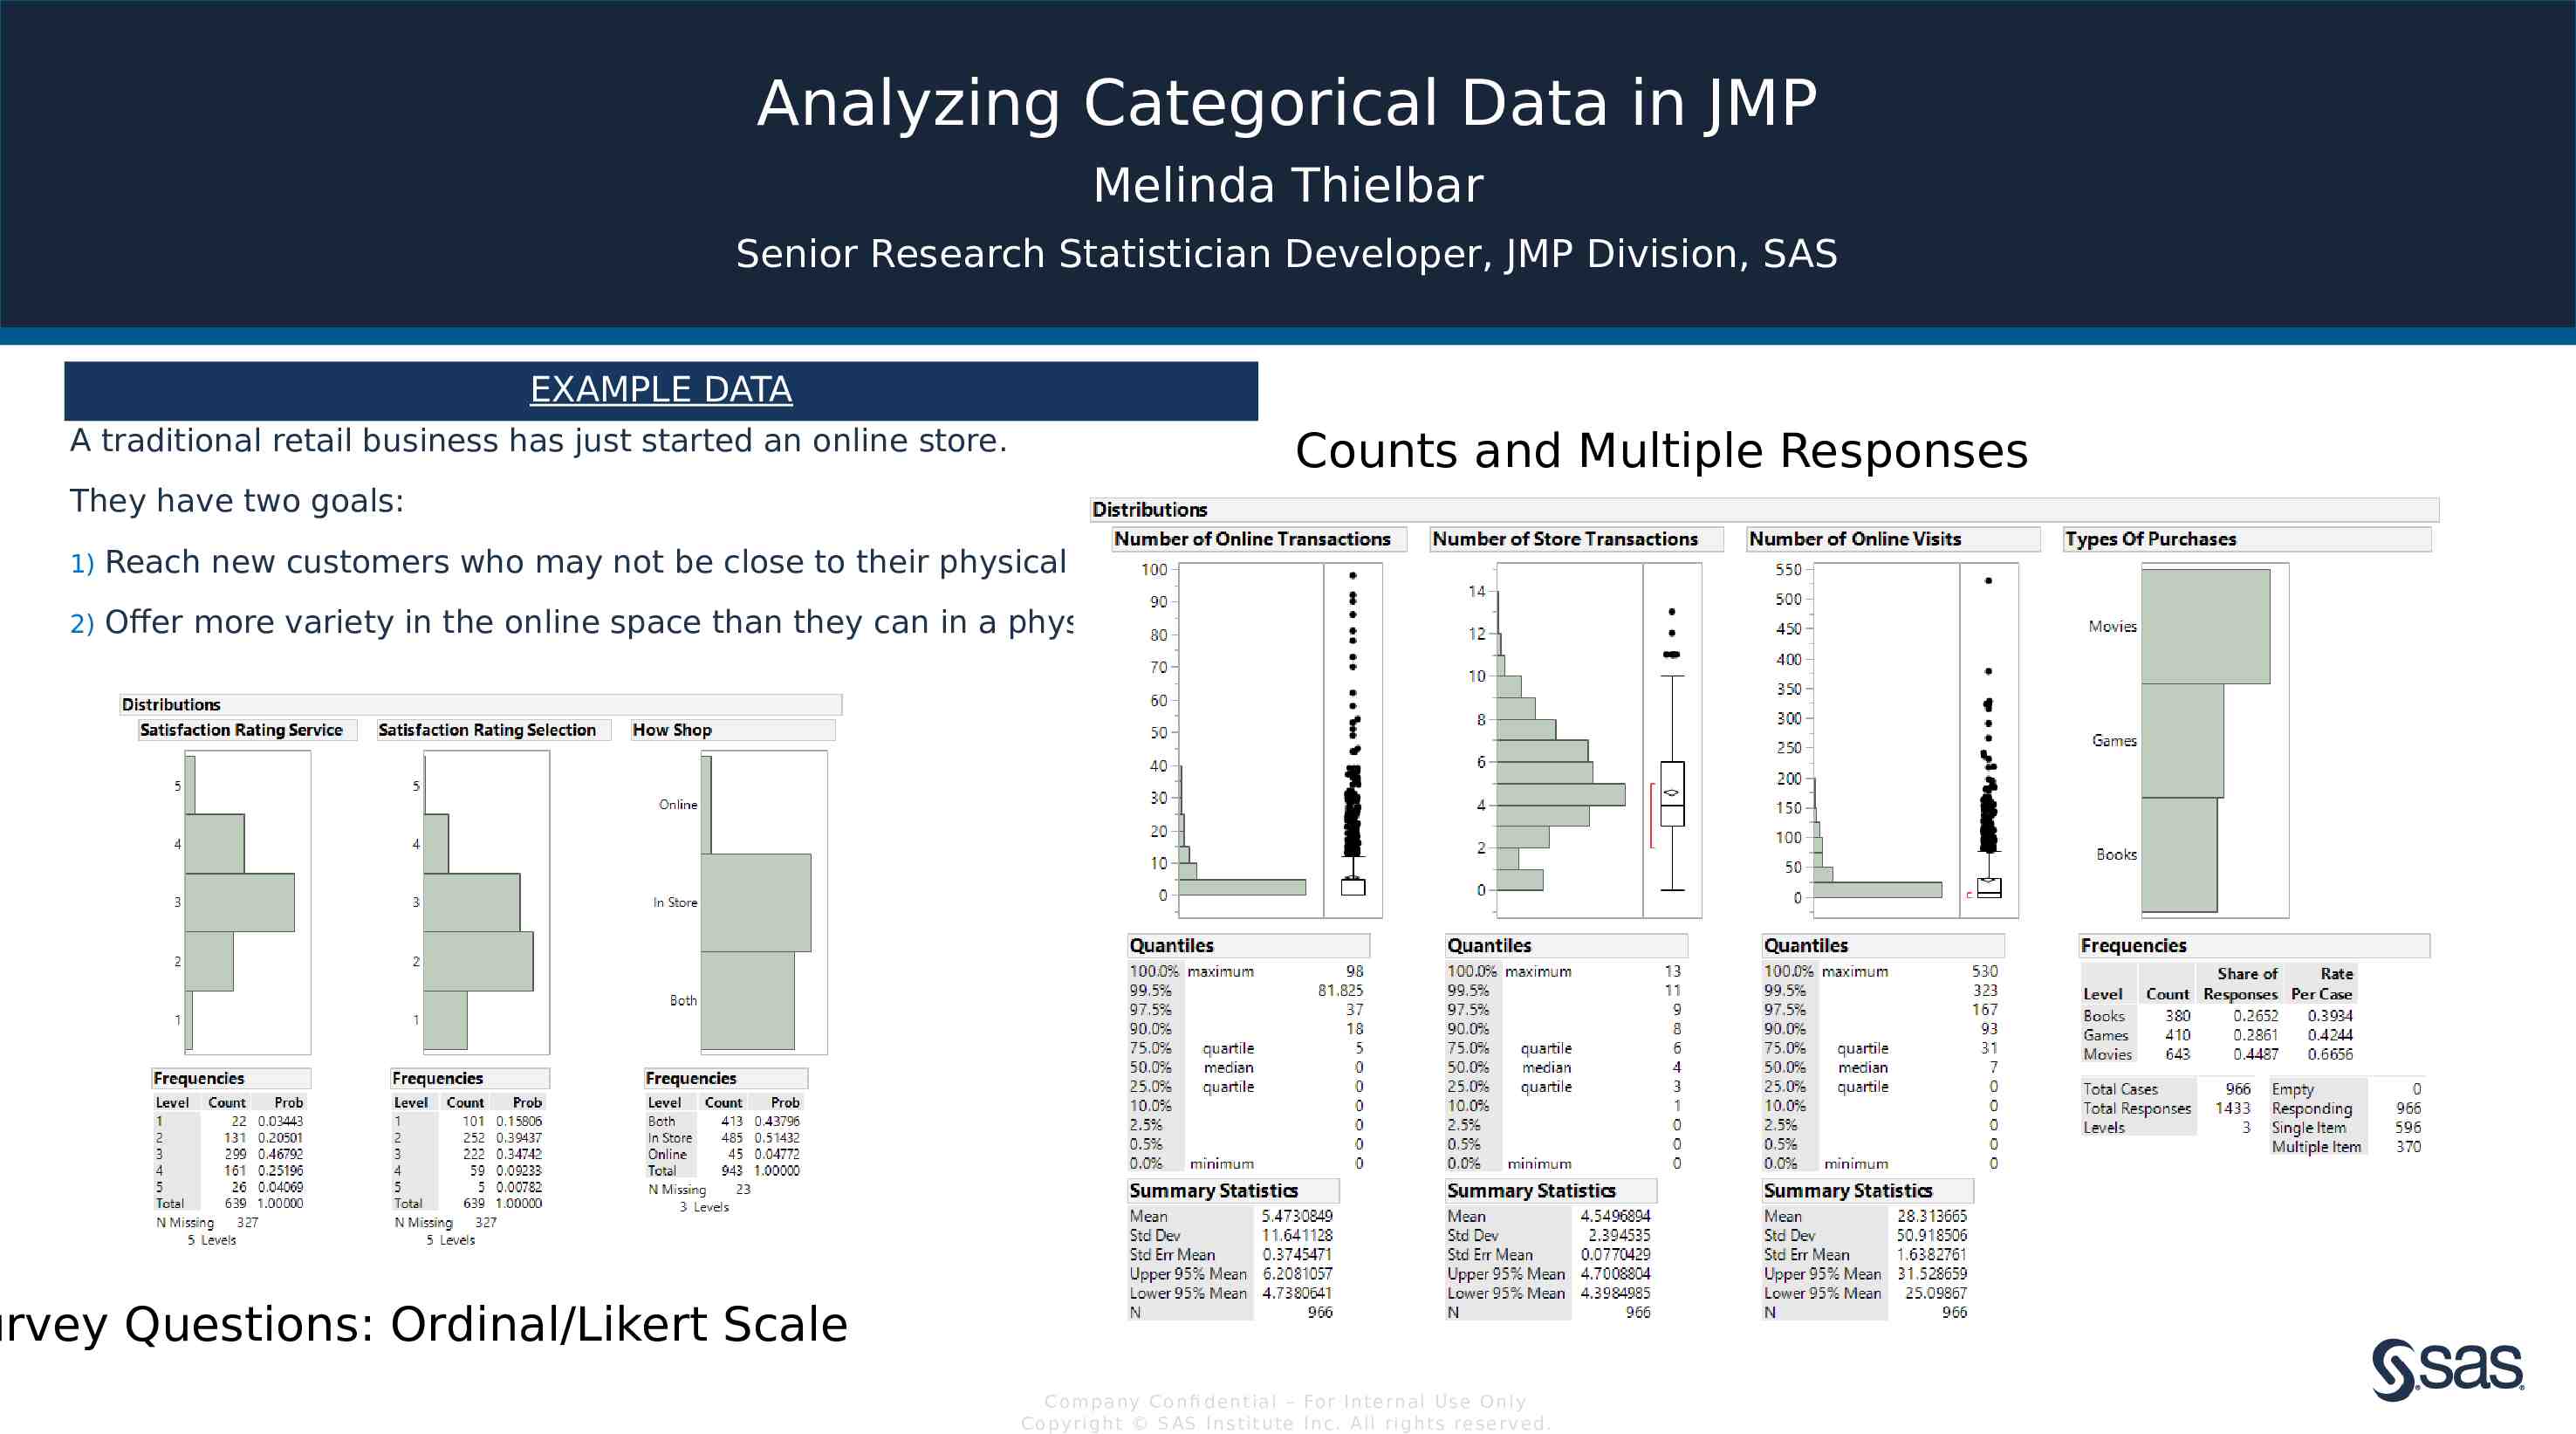
Analyzing Categorical Data in JMP Melinda Thielbar Senior Research Statistician Developer, JMP Division, SAS EXAMPLE DATA A traditional retail business has just started an online store. Counts and Multiple Responses They have two goals: 1) Reach new customers who may not be close to their physical locations. 2) Offer more variety in the online space than they can in a physical space. urvey Questions: Ordinal/Likert Scale Com pan y Con fi de n t ia l – For In t e rn a l Us e On ly Co pyr igh t S AS In s t it u te In c. All r igh ts re s er v ed.
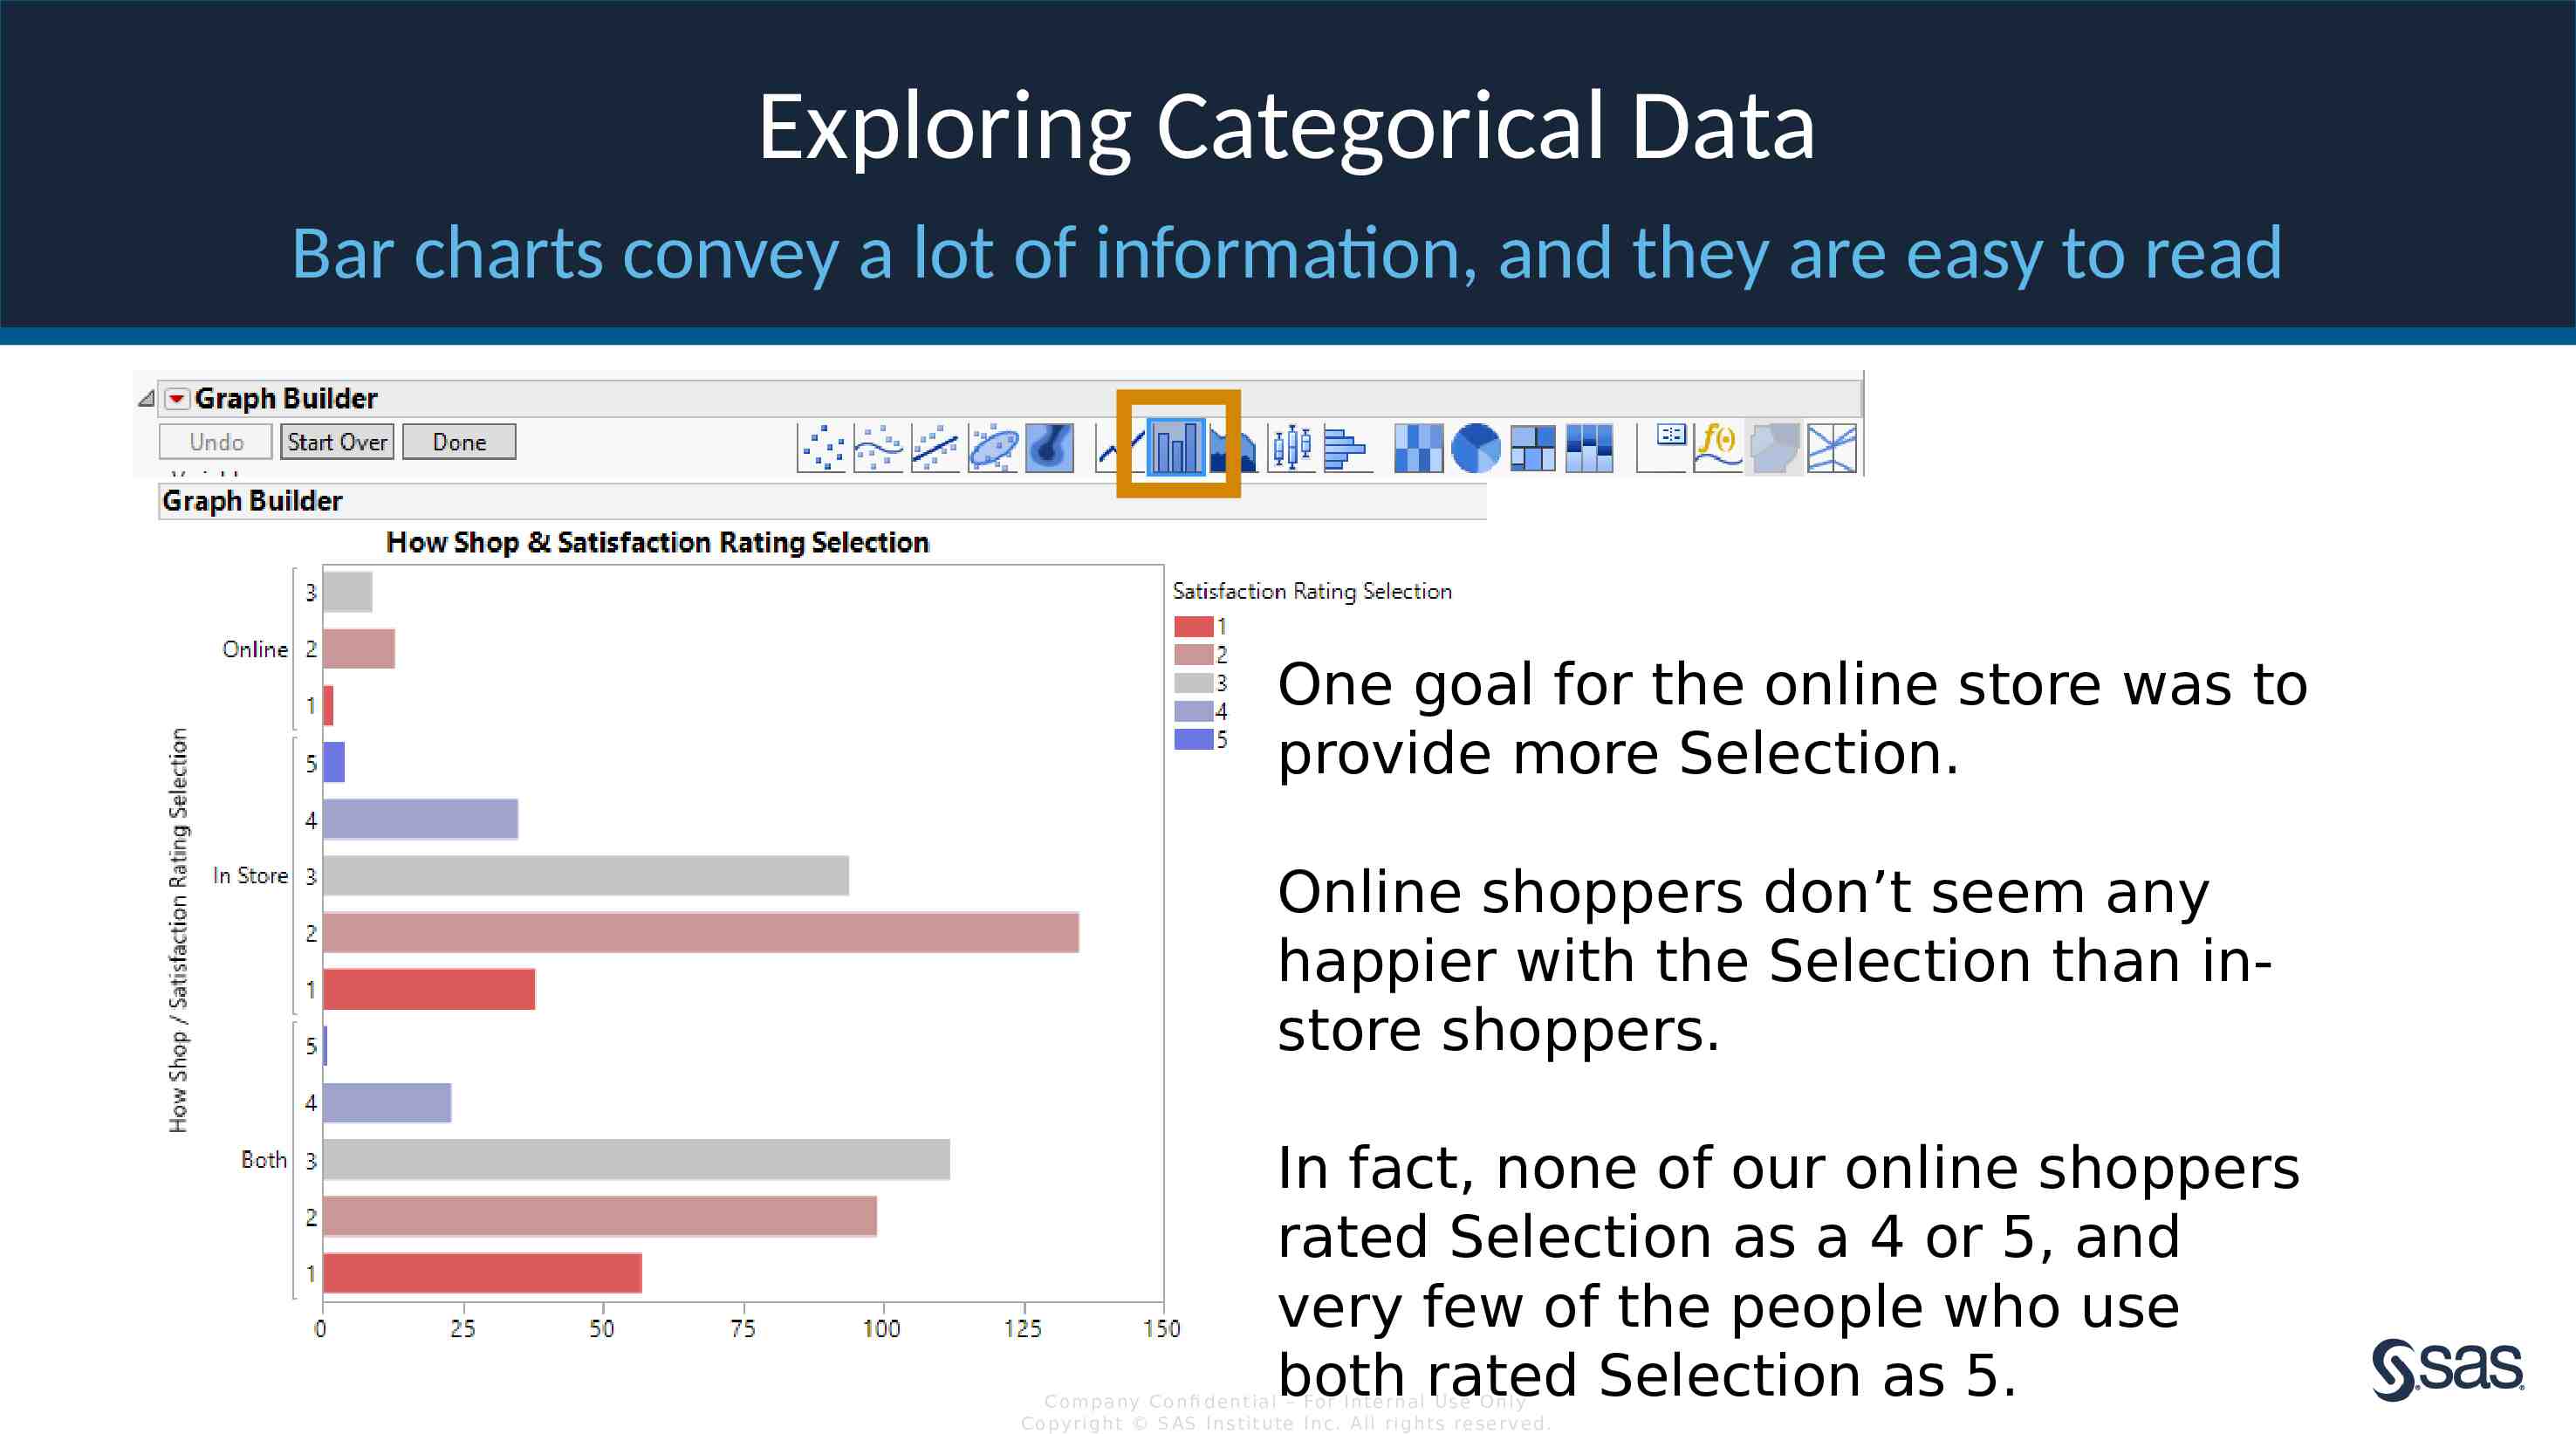
Exploring Categorical Data Bar charts convey a lot of information, and they are easy to read One goal for the online store was to provide more Selection. Online shoppers don’t seem any happier with the Selection than instore shoppers. In fact, none of our online shoppers rated Selection as a 4 or 5, and very few of the people who use both rated Selection as 5. Com pan y Con fi de n t ia l – For In t e rn a l Us e On ly Co pyr igh t S AS In s t it u te In c. All r igh ts re s er v ed.
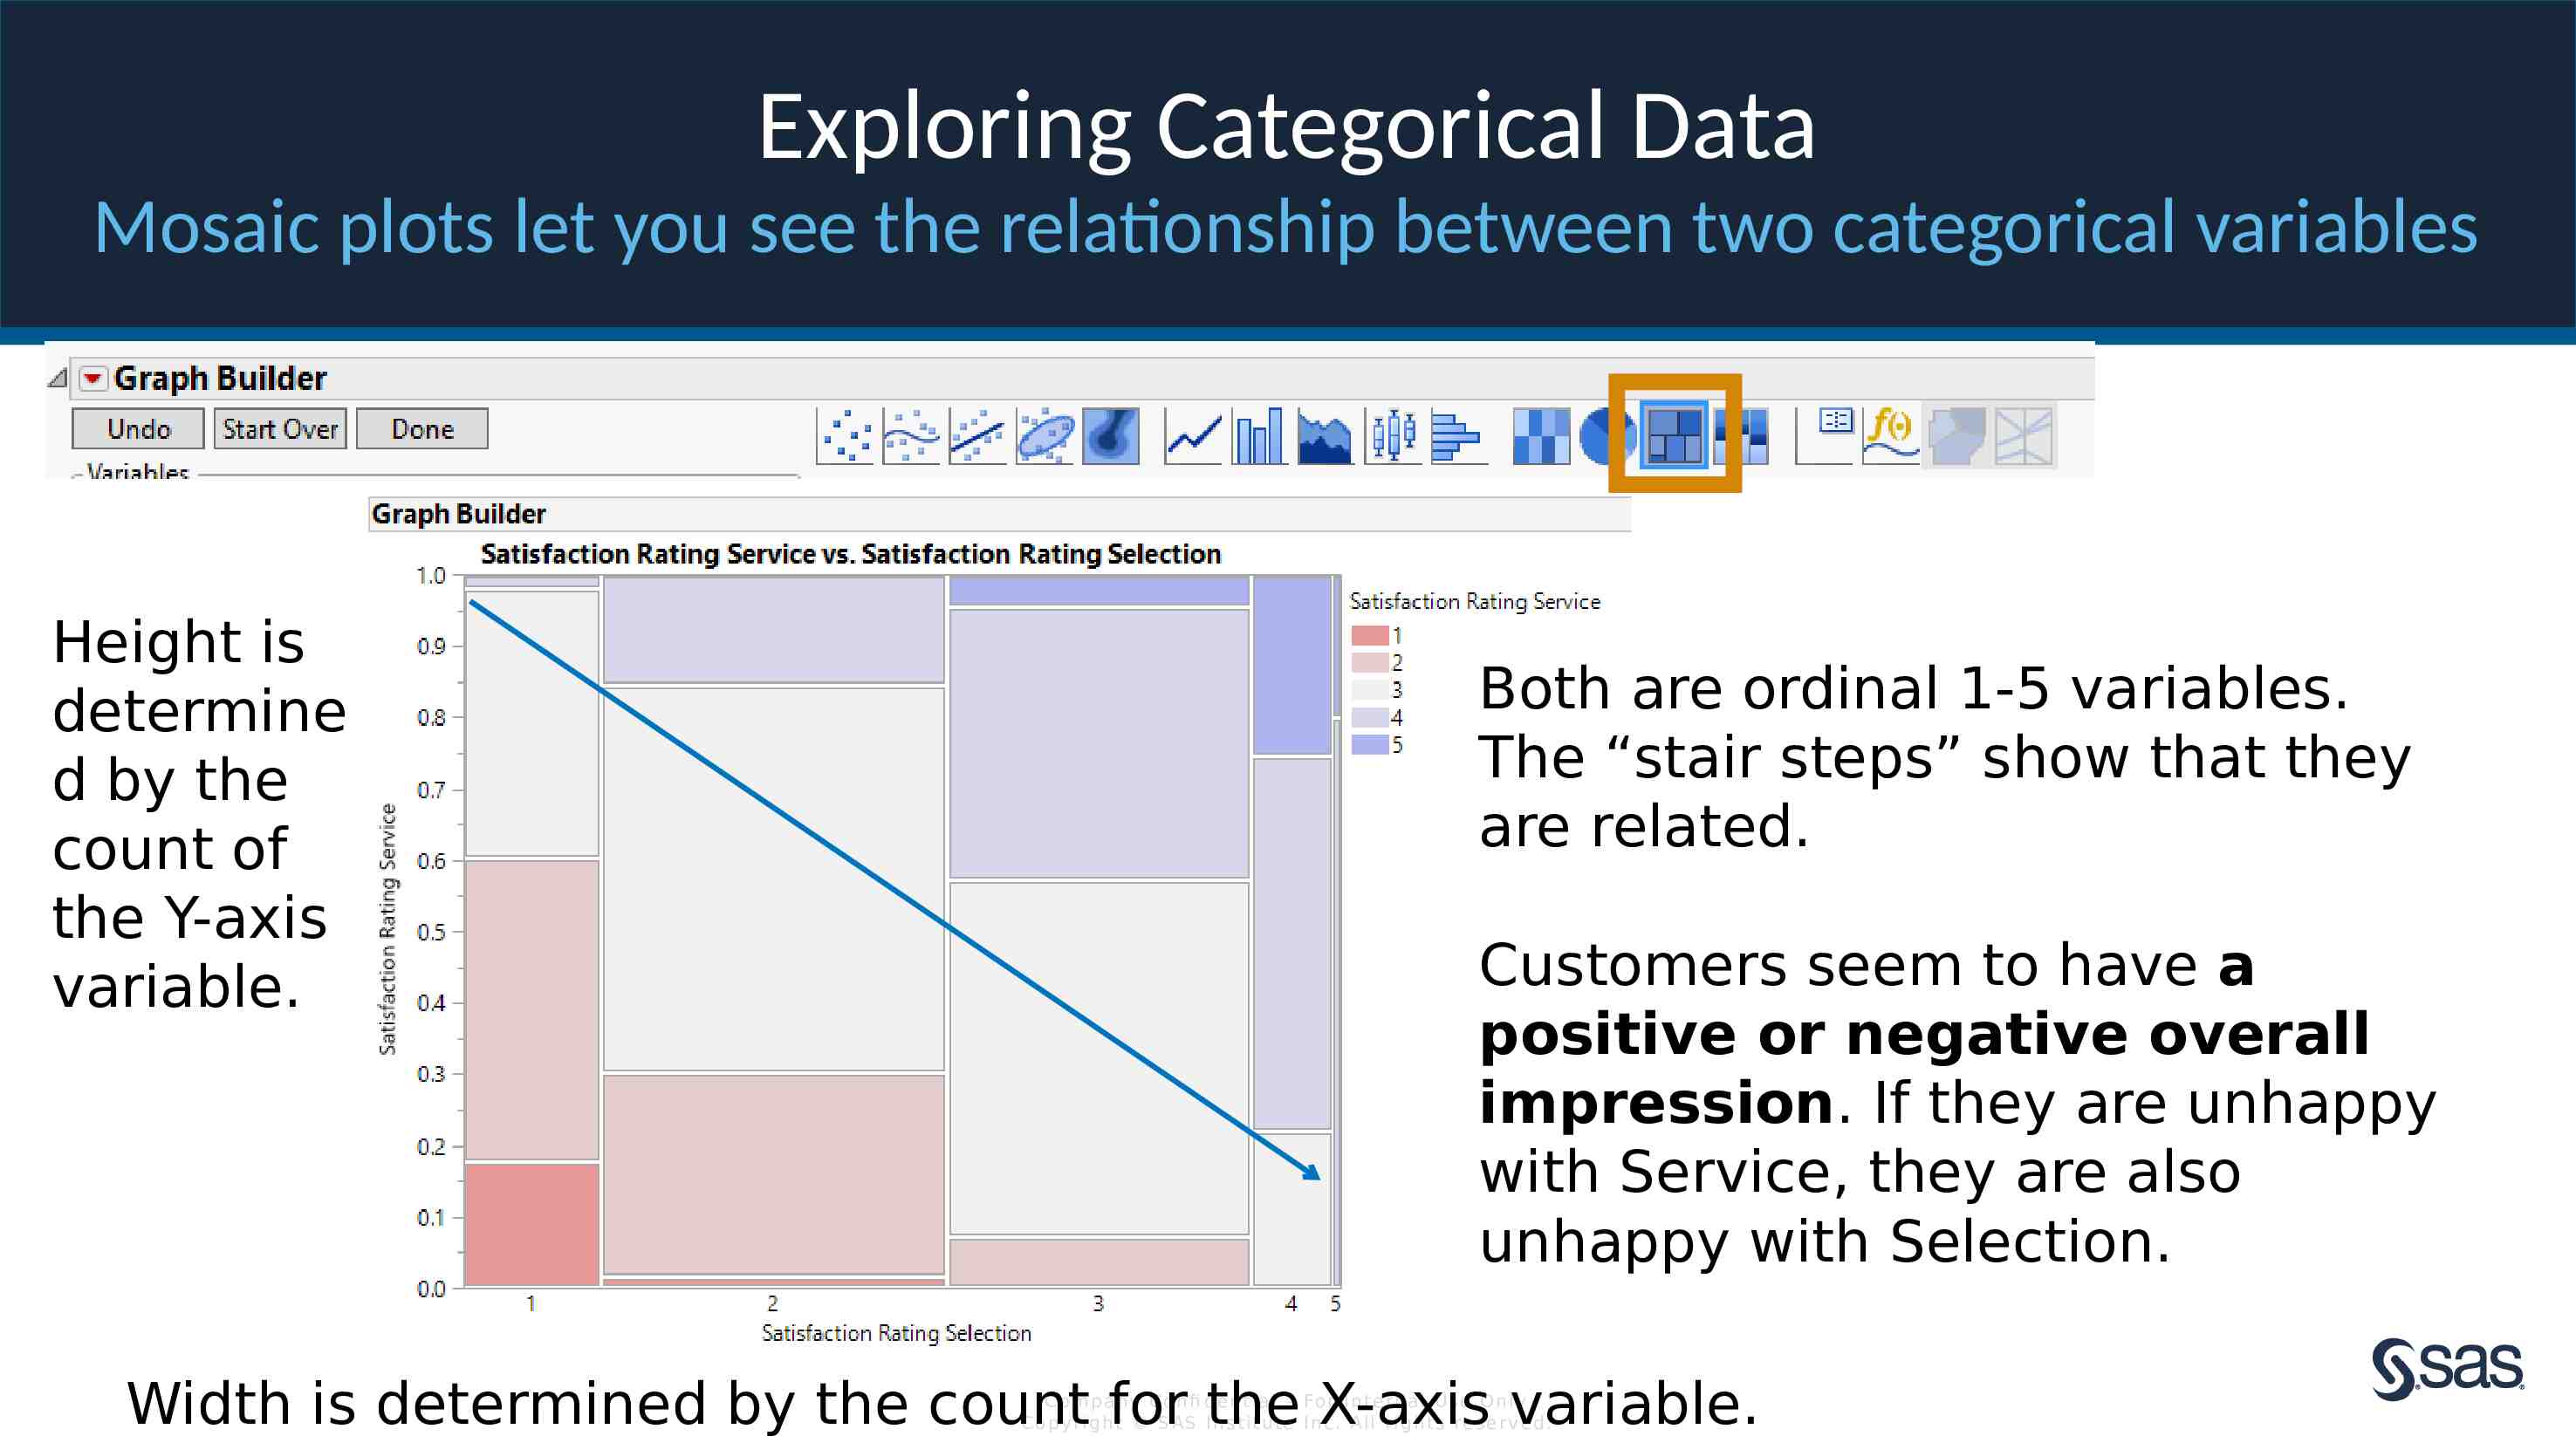
Exploring Categorical Data Mosaic plots let you see the relationship between two categorical variables Height is determine d by the count of the Y-axis variable. Both are ordinal 1-5 variables. The “stair steps” show that they are related. Customers seem to have a positive or negative overall impression. If they are unhappy with Service, they are also unhappy with Selection. Width is determined by the count for the X-axis variable. Com pan y Con fi de n t ia l – For In t e rn a l Us e On ly Co pyr igh t S AS In s t it u te In c. All r igh ts re s er v ed.
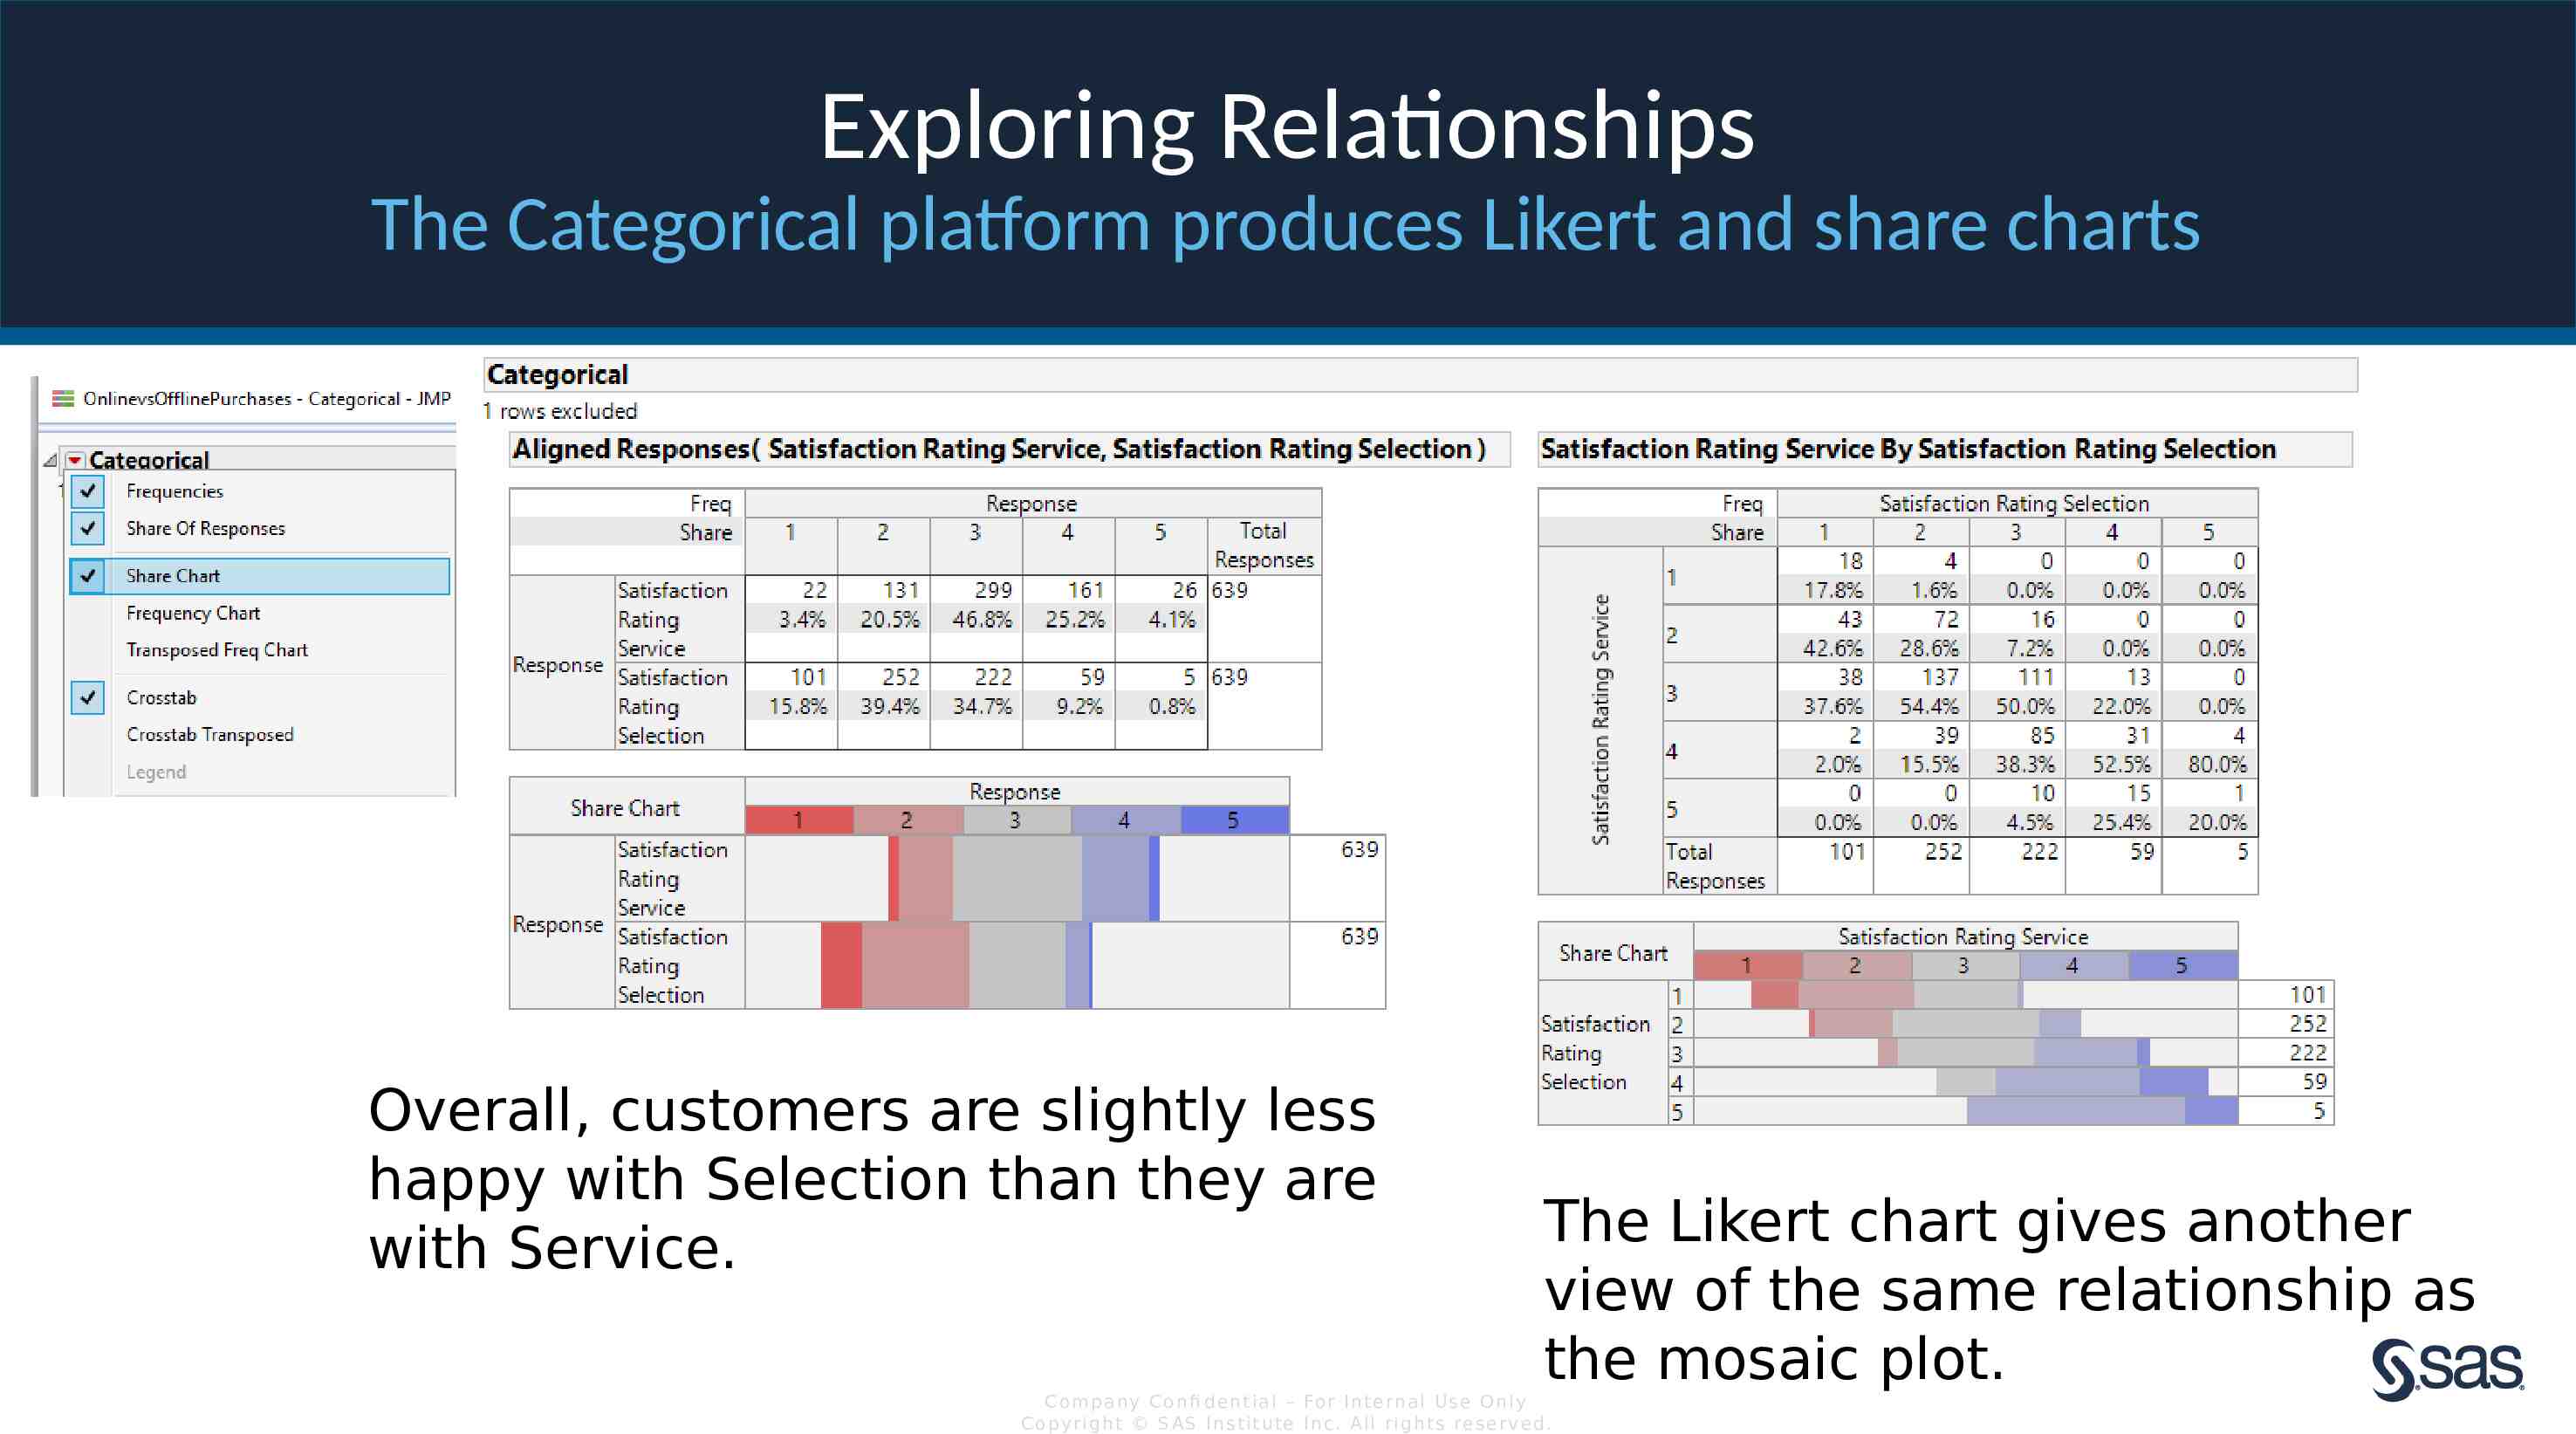
Exploring Relationships The Categorical platform produces Likert and share charts Overall, customers are slightly less happy with Selection than they are with Service. The Likert chart gives another view of the same relationship as the mosaic plot. Com pan y Con fi de n t ia l – For In t e rn a l Us e On ly Co pyr igh t S AS In s t it u te In c. All r igh ts re s er v ed.
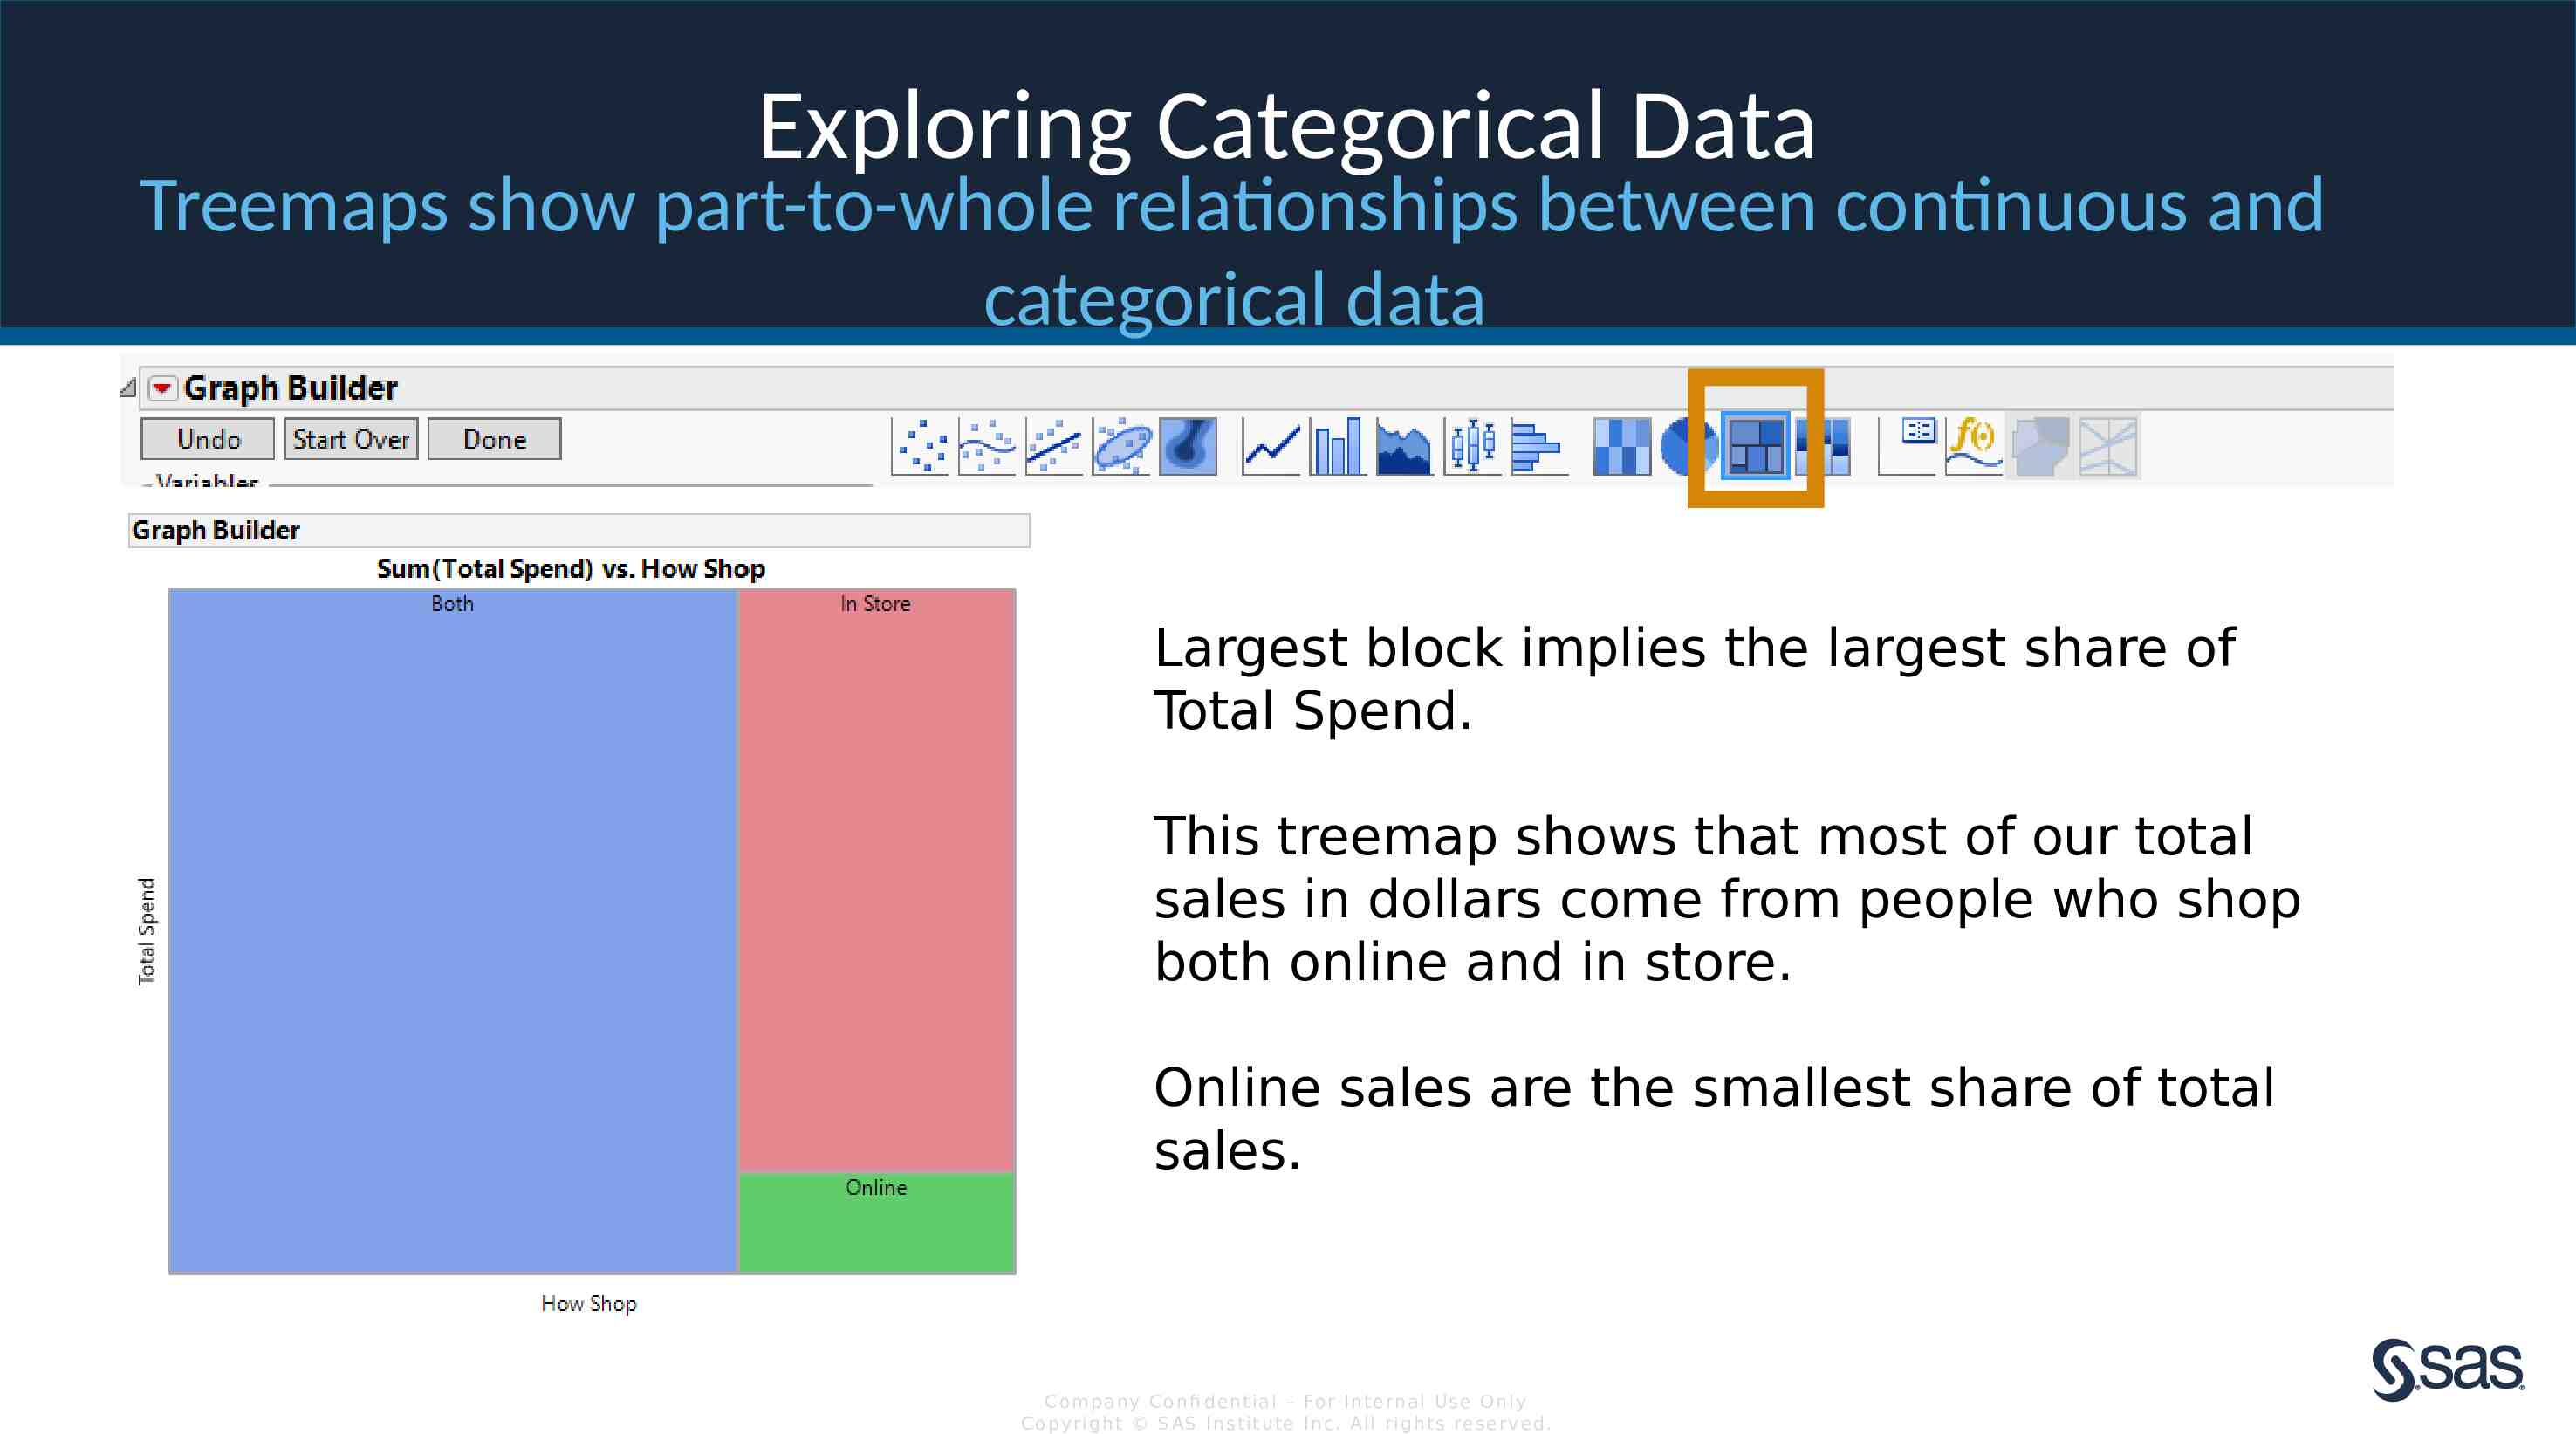
Exploring Categorical Data Treemaps show part-to-whole relationships between continuous and categorical data Largest block implies the largest share of Total Spend. This treemap shows that most of our total sales in dollars come from people who shop both online and in store. Online sales are the smallest share of total sales. Com pan y Con fi de n t ia l – For In t e rn a l Us e On ly Co pyr igh t S AS In s t it u te In c. All r igh ts re s er v ed.
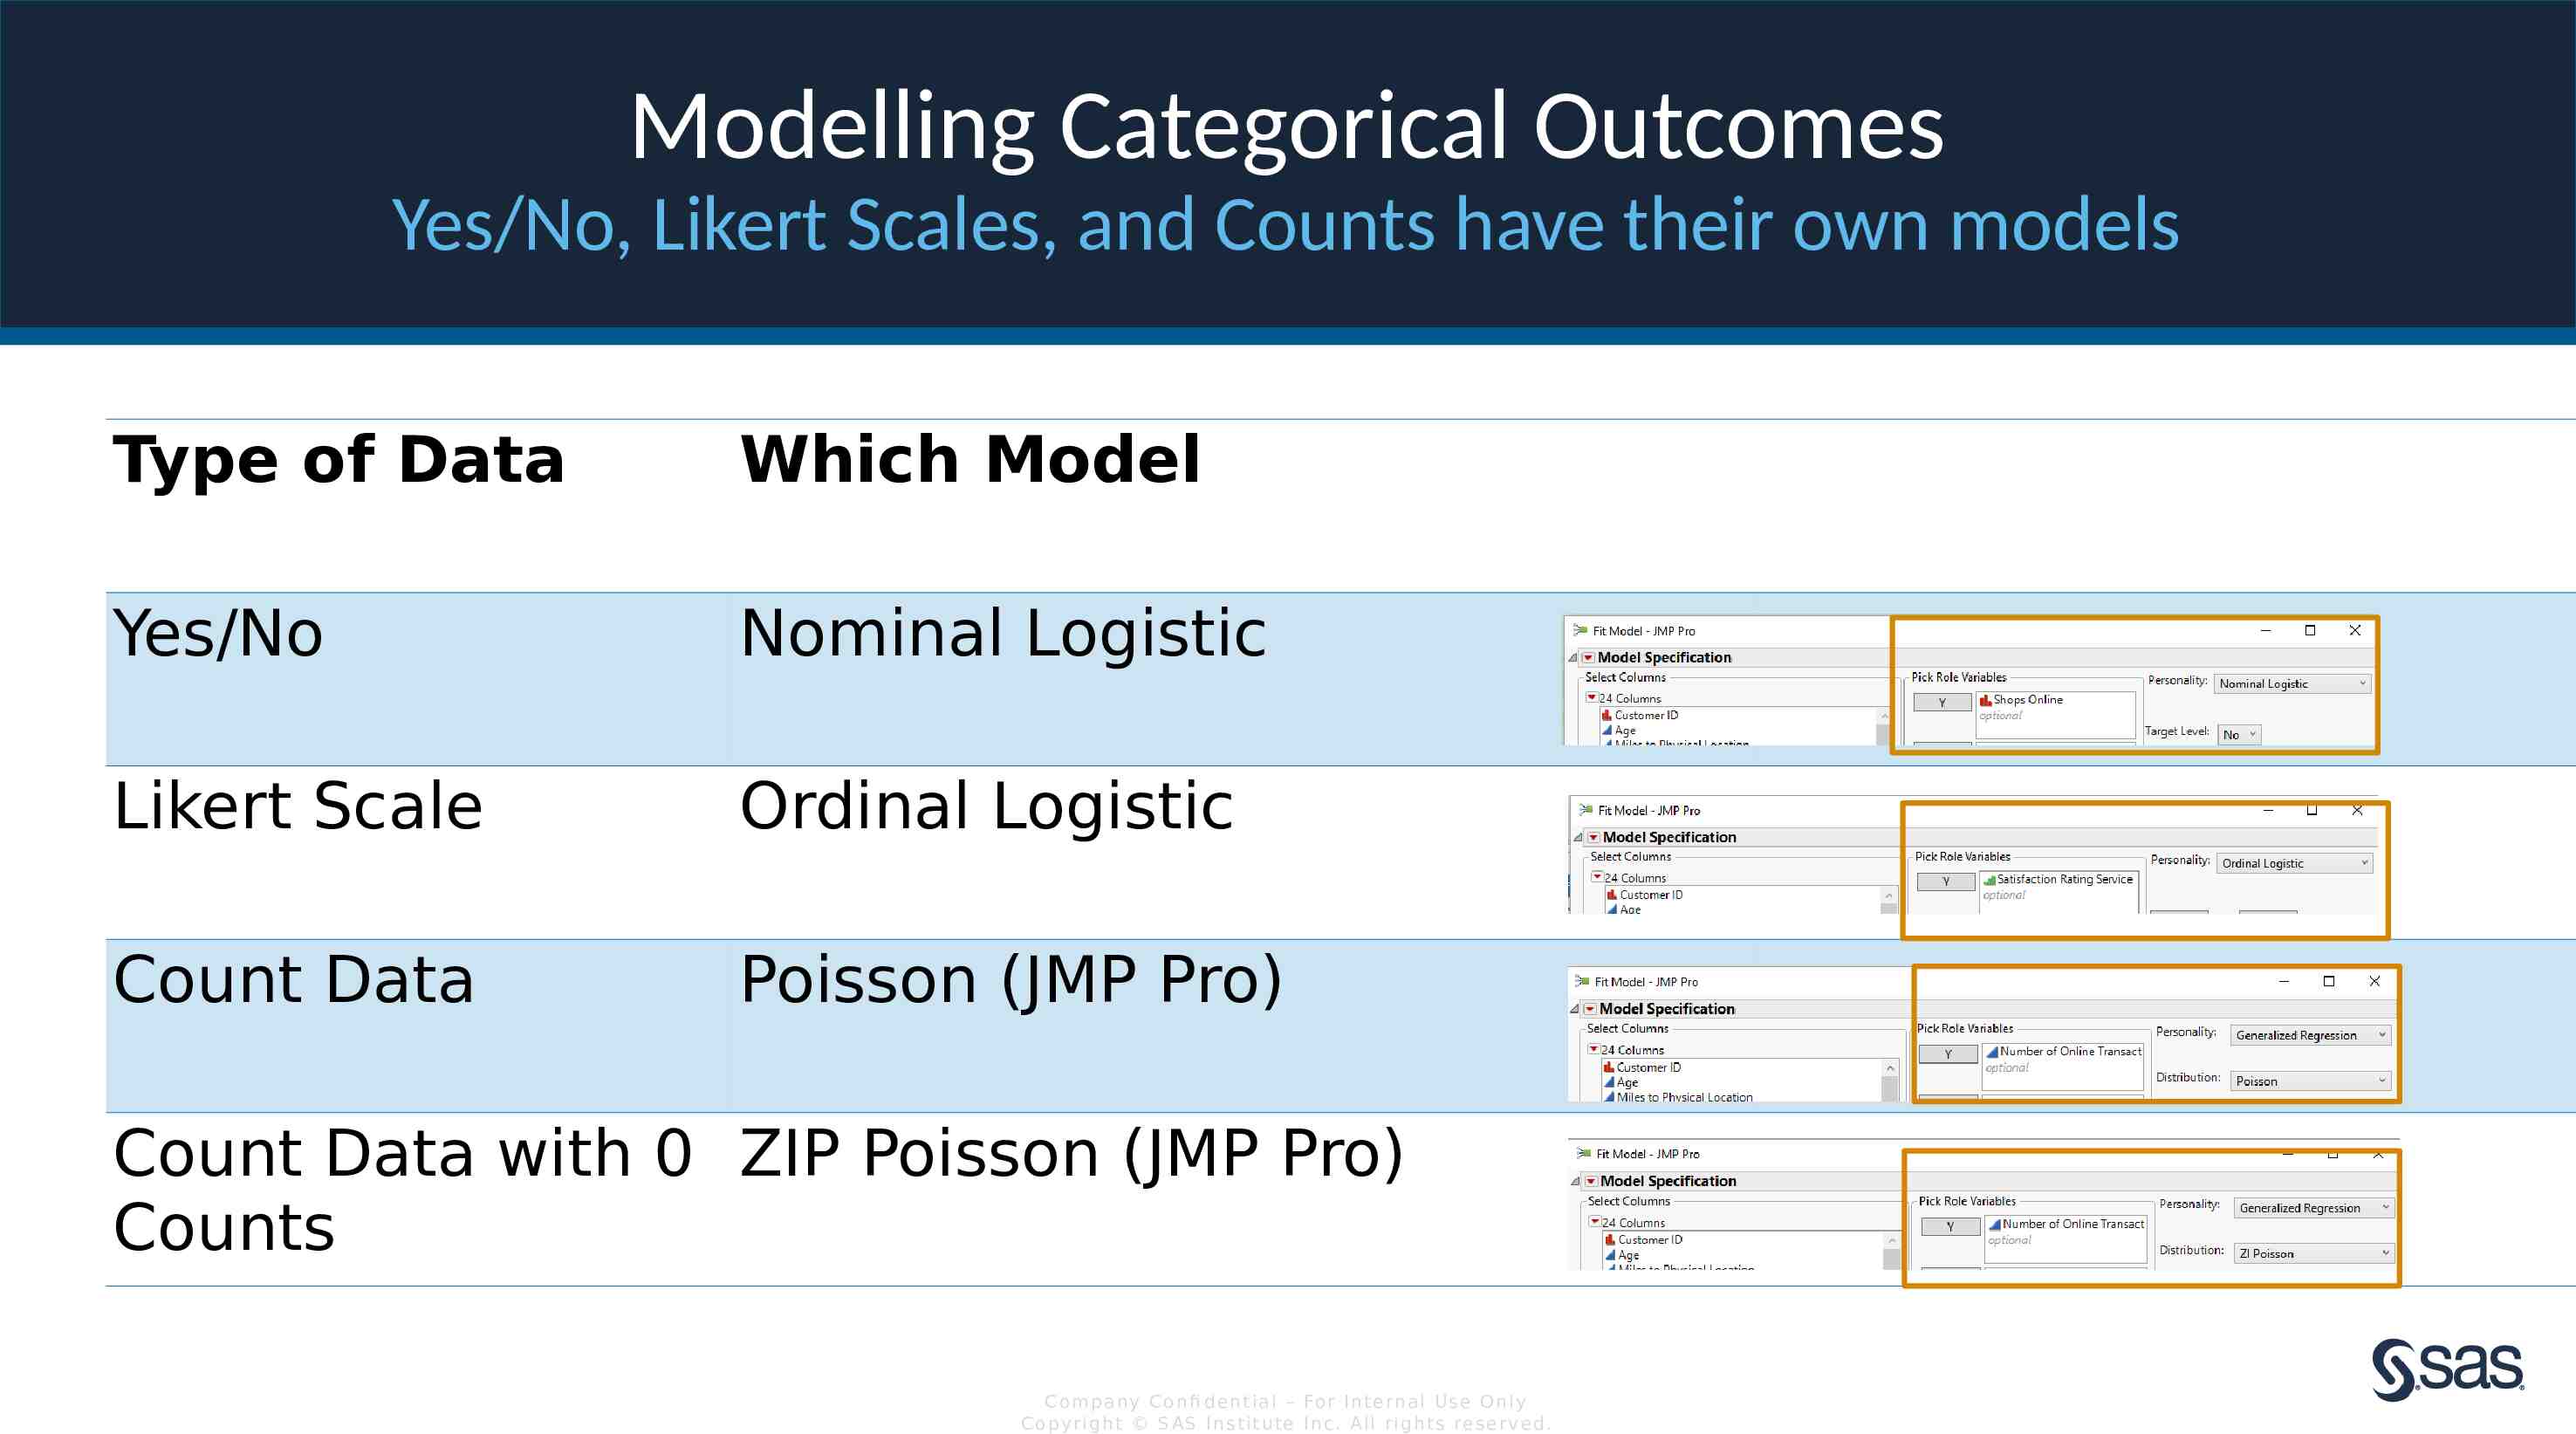
Modelling Categorical Outcomes Yes/No, Likert Scales, and Counts have their own models Type of Data Which Model Yes/No Nominal Logistic Likert Scale Ordinal Logistic Count Data Poisson (JMP Pro) Count Data with 0 ZIP Poisson (JMP Pro) Counts Com pan y Con fi de n t ia l – For In t e rn a l Us e On ly Co pyr igh t S AS In s t it u te In c. All r igh ts re s er v ed.
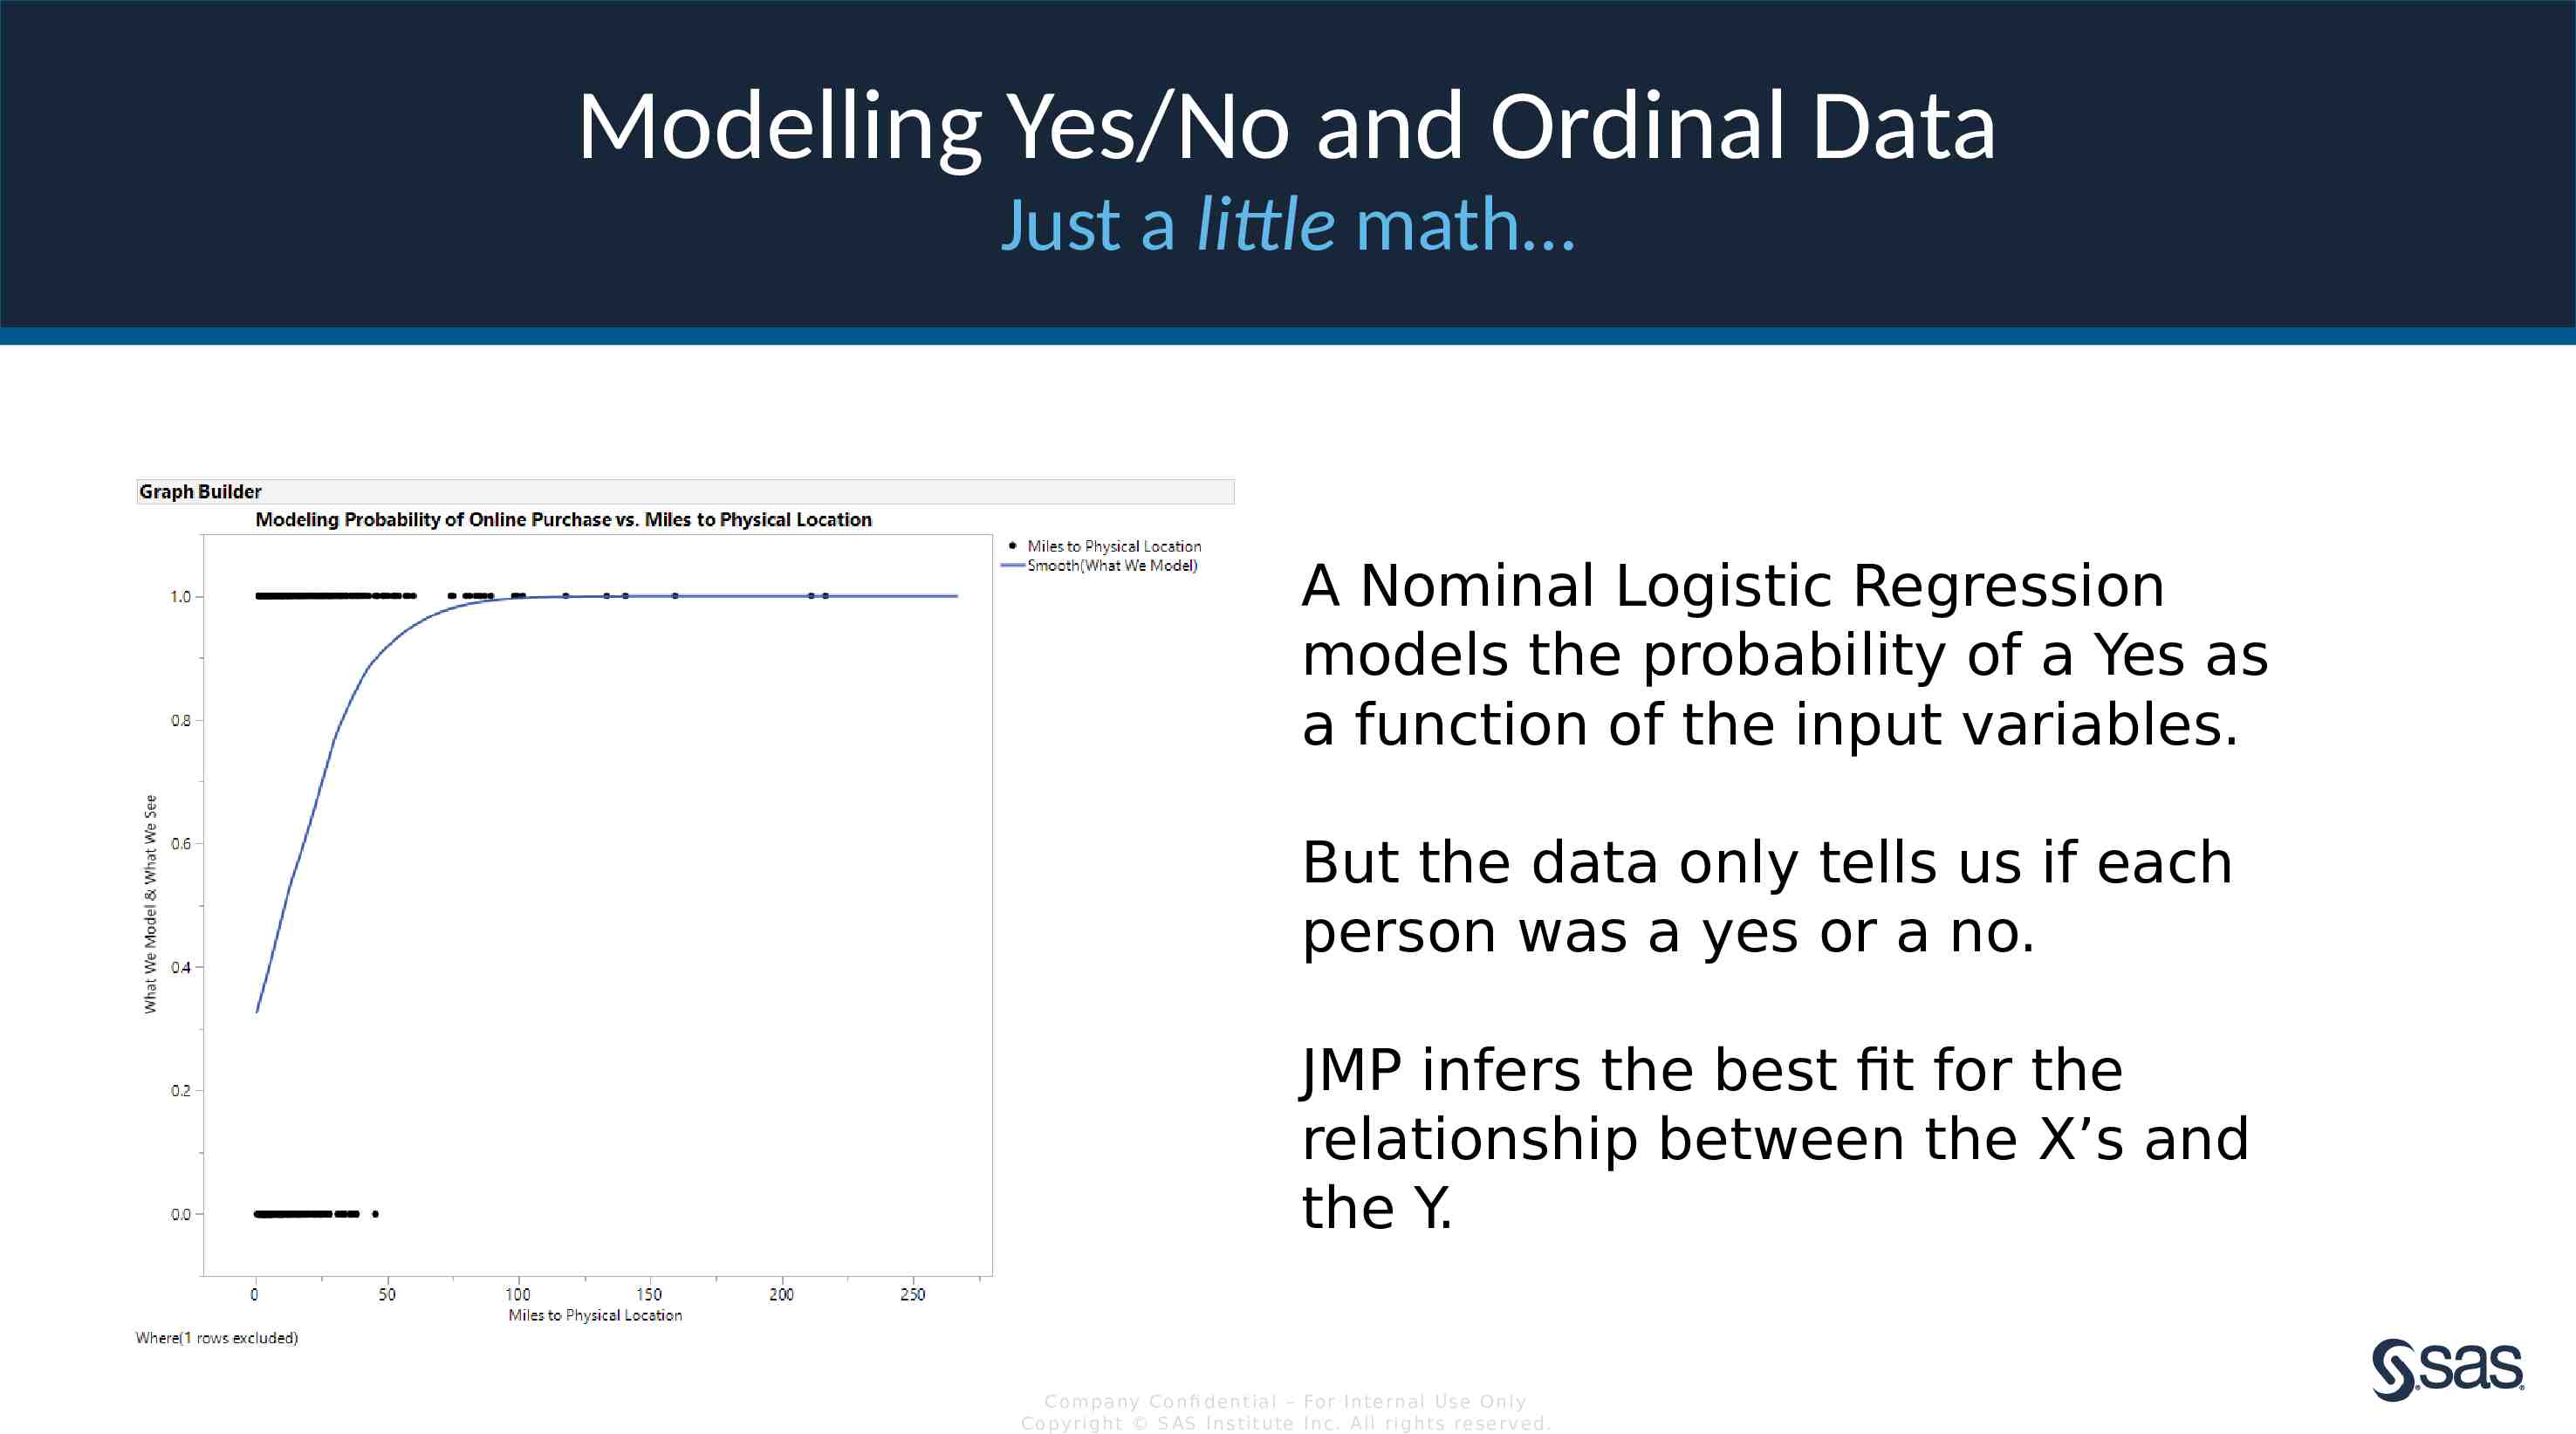
Modelling Yes/No and Ordinal Data Just a little math A Nominal Logistic Regression models the probability of a Yes as a function of the input variables. But the data only tells us if each person was a yes or a no. JMP infers the best fit for the relationship between the X’s and the Y. Com pan y Con fi de n t ia l – For In t e rn a l Us e On ly Co pyr igh t S AS In s t it u te In c. All r igh ts re s er v ed.
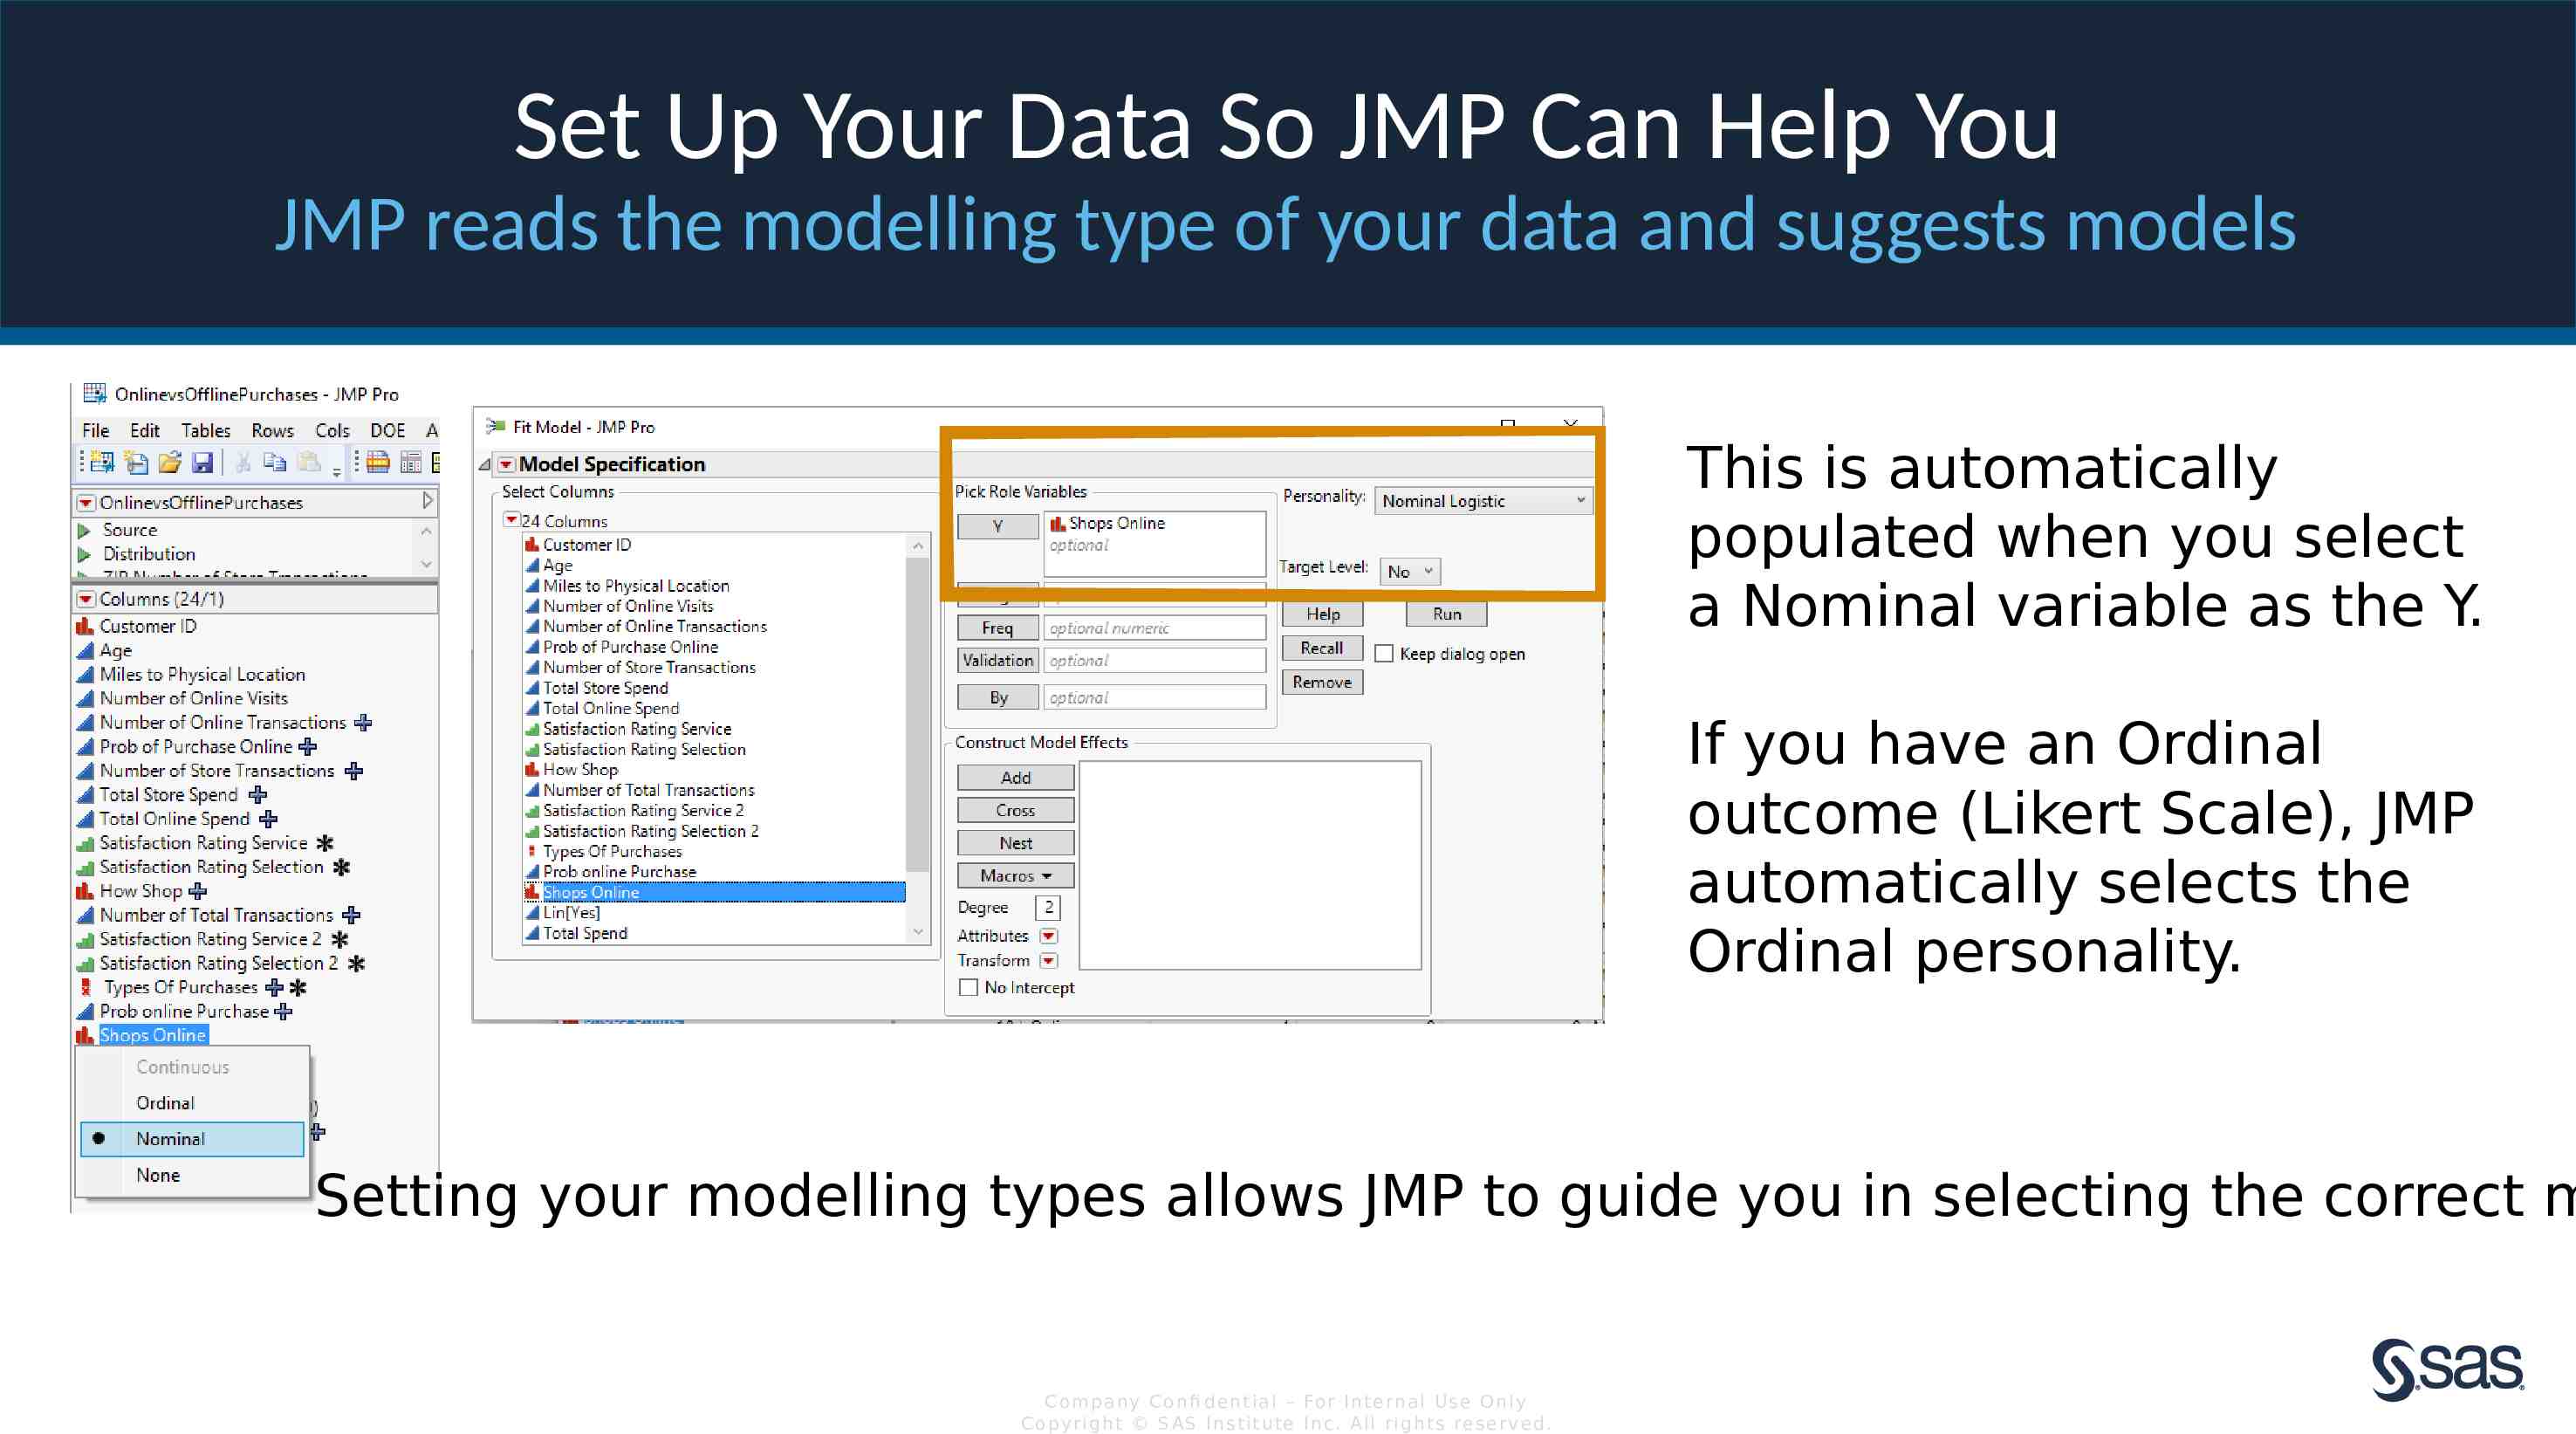
Set Up Your Data So JMP Can Help You JMP reads the modelling type of your data and suggests models This is automatically populated when you select a Nominal variable as the Y. If you have an Ordinal outcome (Likert Scale), JMP automatically selects the Ordinal personality. Setting your modelling types allows JMP to guide you in selecting the correct m Com pan y Con fi de n t ia l – For In t e rn a l Us e On ly Co pyr igh t S AS In s t it u te In c. All r igh ts re s er v ed.
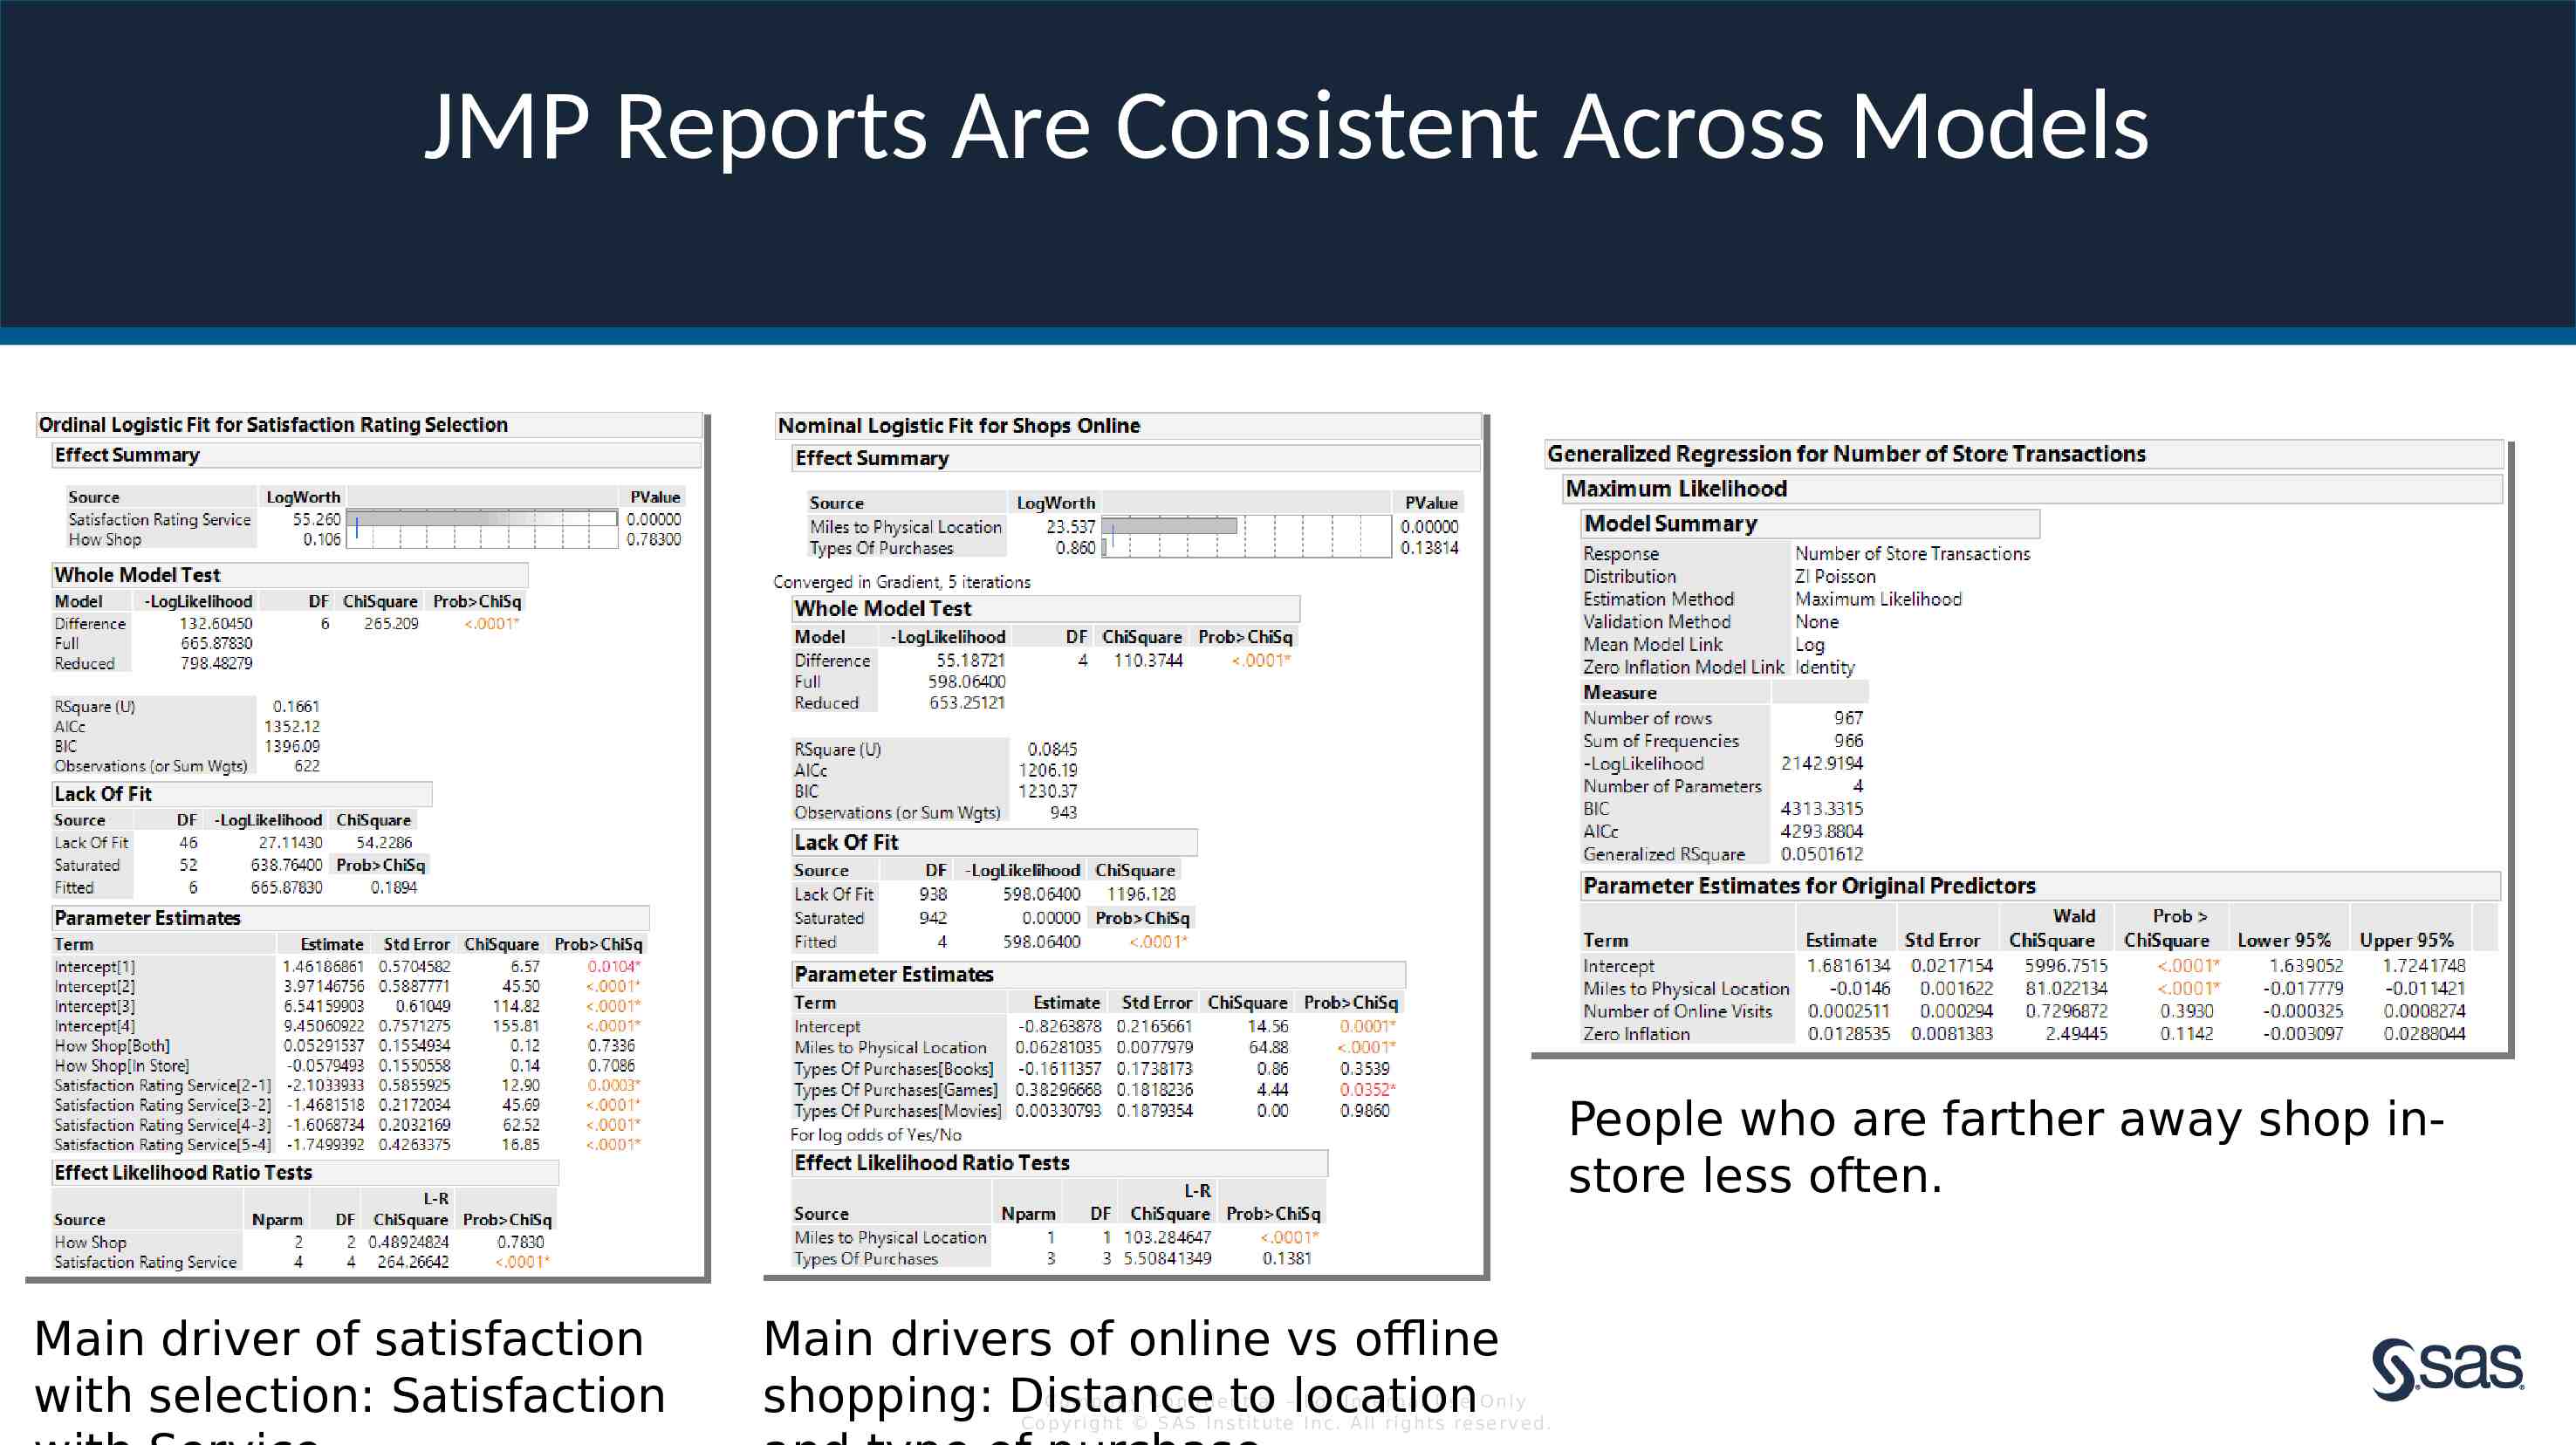
JMP Reports Are Consistent Across Models People who are farther away shop instore less often. Main driver of satisfaction with selection: Satisfaction Main drivers of online vs offline shopping: Distance to location Com pan y Con fi de n t ia l – For In t e rn a l Us e On ly Co pyr igh t S AS In s t it u te In c. All r igh ts re s er v ed.
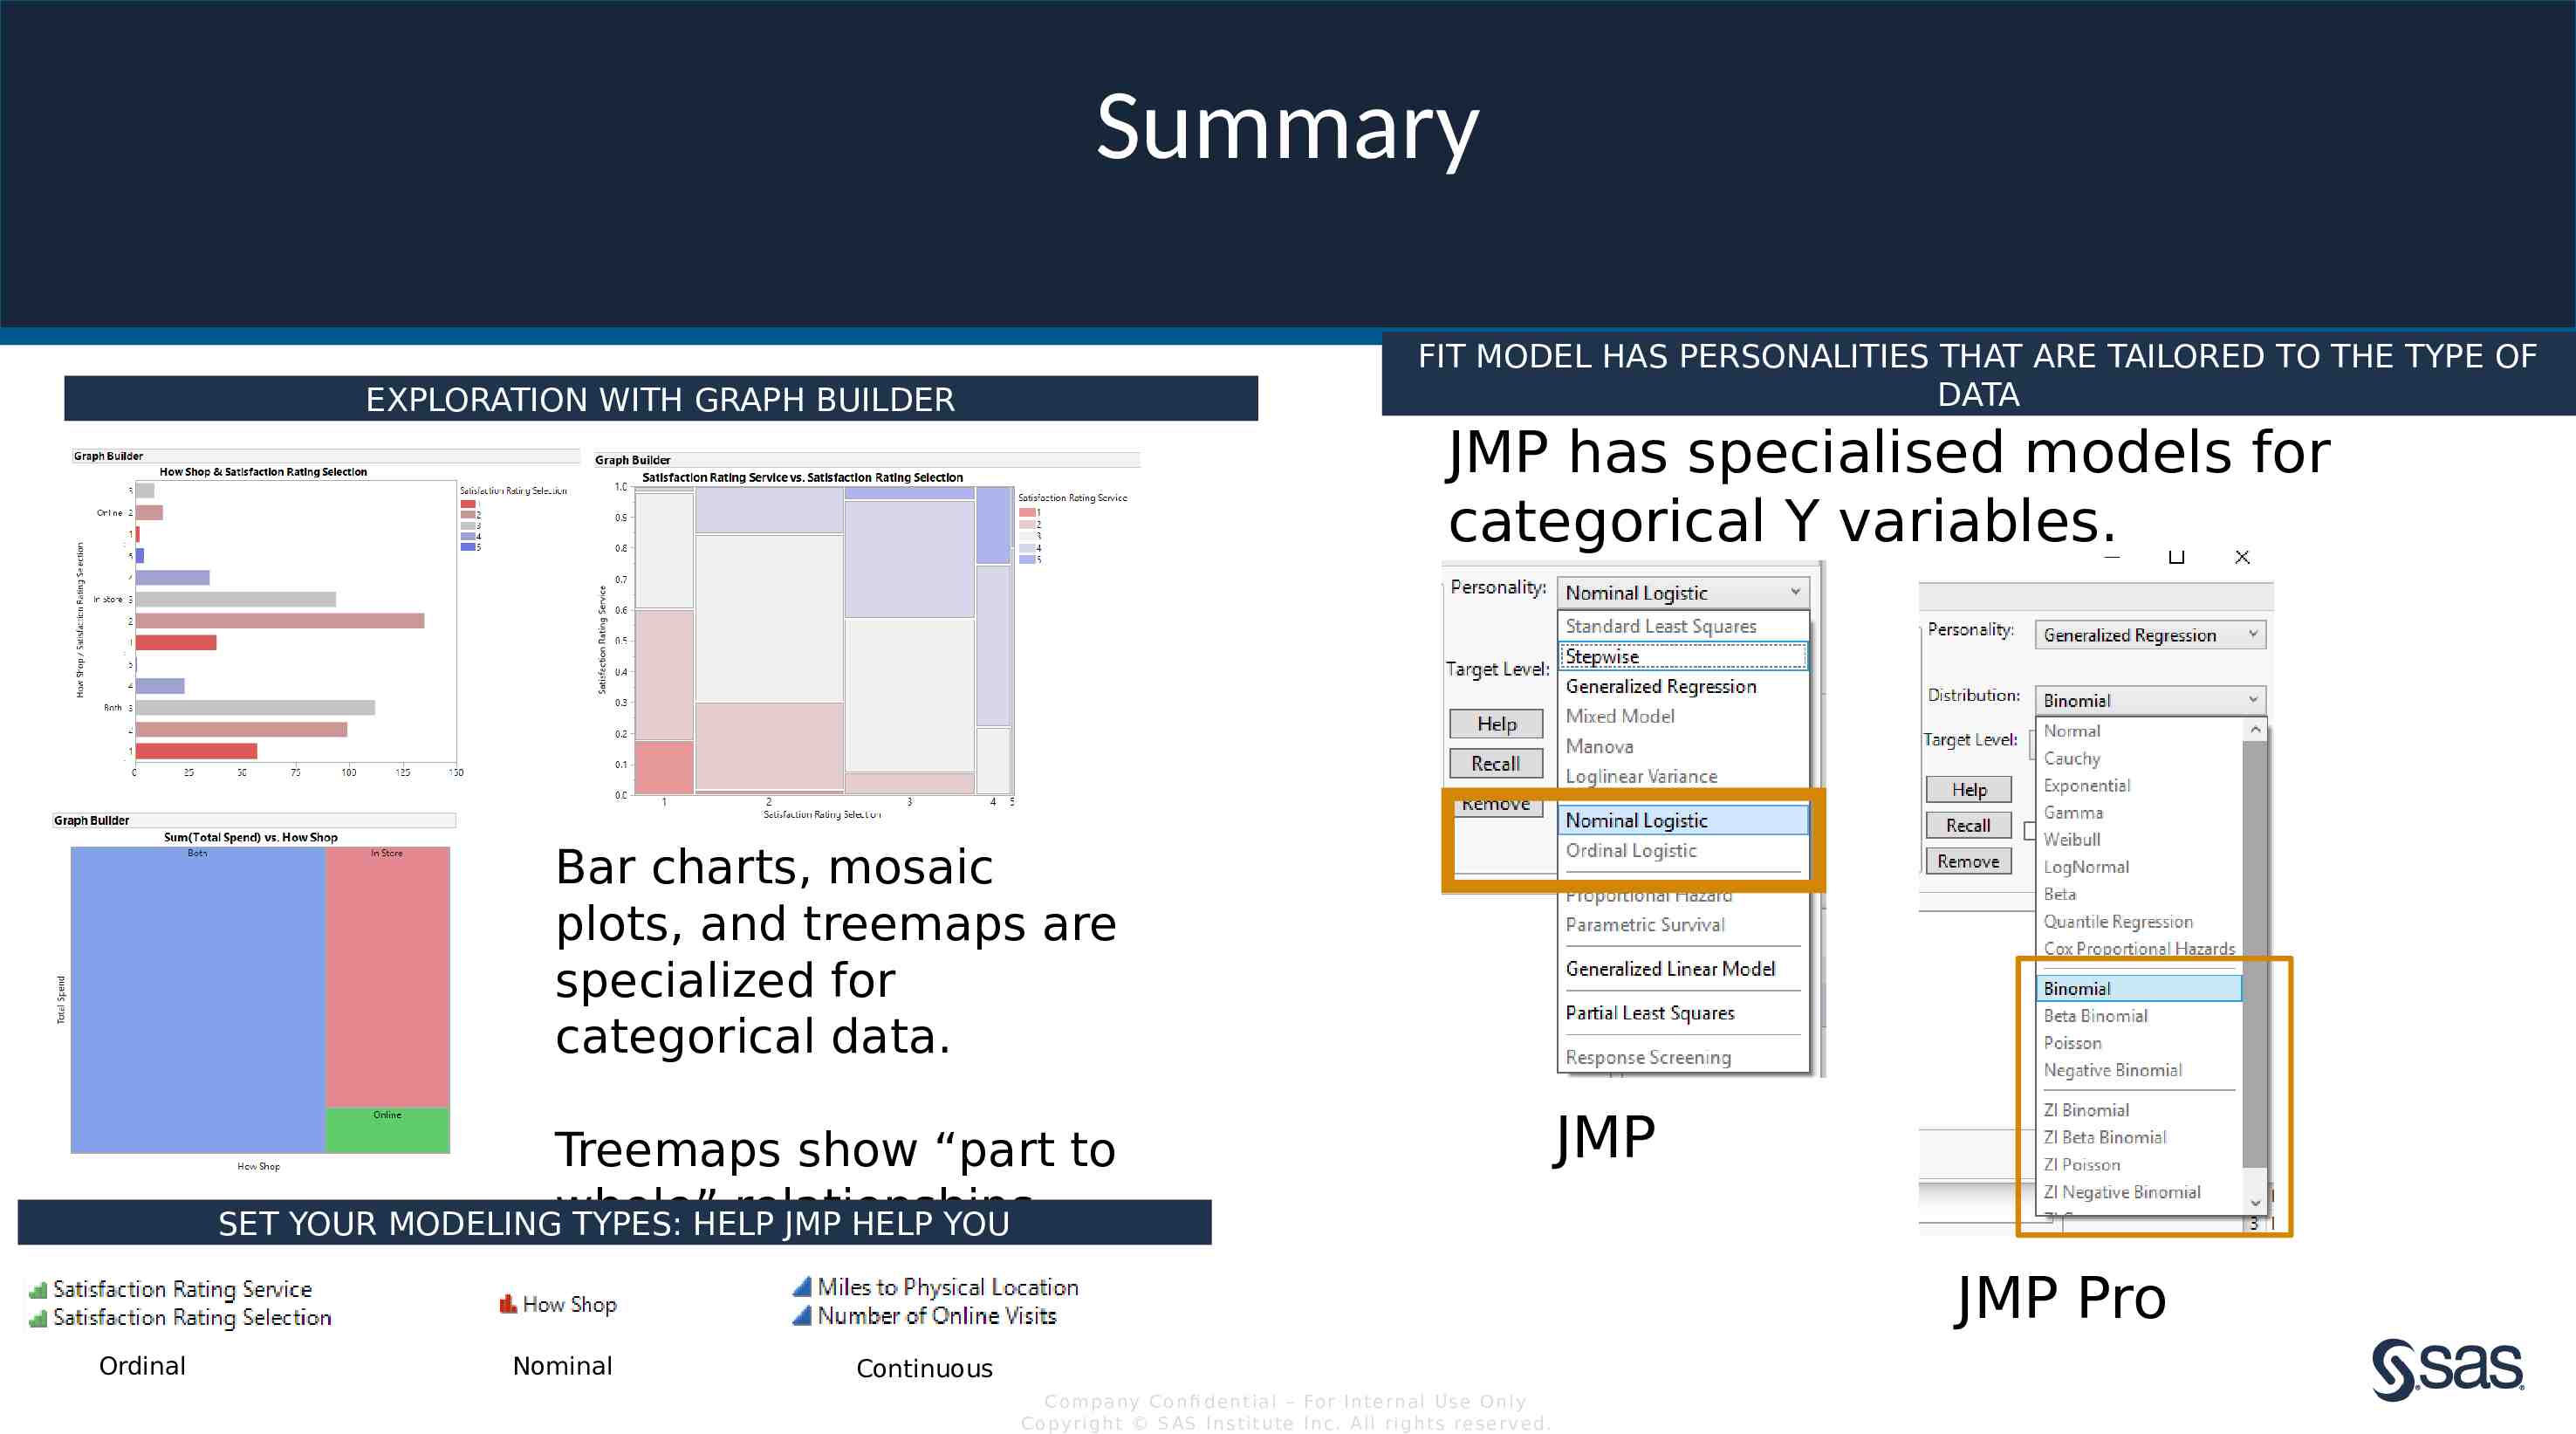
Summary FIT MODEL HAS PERSONALITIES THAT ARE TAILORED TO THE TYPE OF DATA EXPLORATION WITH GRAPH BUILDER JMP has specialised models for categorical Y variables. Bar charts, mosaic plots, and treemaps are specialized for categorical data. Treemaps show “part to relationships. SET YOUR MODELINGwhole” TYPES: HELP JMP HELP YOU JMP JMP Pro Ordinal Nominal Continuous Com pan y Con fi de n t ia l – For In t e rn a l Us e On ly Co pyr igh t S AS In s t it u te In c. All r igh ts re s er v ed.