Analysis of Variance (ANOVA)
12 Slides101.50 KB
Analysis of Variance (ANOVA)
Why ANOVA? In real life things do not typically result in two groups being compared – Test lines on I-64 in Frankfort Two-sample t-tests are problematic – Increasing the risk of a Type I error – At .05 level of significance, with 100 comparisons, 5 will show a difference when none exists (experimentwise error) – So the more t-tests you run, the greater the risk of a type I error (rejecting the null when there is no difference) ANOVA allows us to see if there are differences between means with an OMNIBUS test
When ANOVA? Data must be experimental If you do not have access to statistical software, an ANOVA can be computed by hand With many experimental designs, the sample sizes must be equal for the various factor level combinations A regression analysis will accomplish the same goal as an ANOVA. ANOVA formulas change from one experimental design to another
Variance – why do scores vary? A representation of the spread of scores What contributes to differences in scores? – Individual differences – Which group you are in
Variance to compare Means We are applying the variance concept to means – How do means of different groups compare to the overall mean Do the means vary so greatly from each other that they exceed individual differences within the groups?
Between/Within Groups Variance can be separated into two major components – Within groups – variability or differences in particular groups (individual differences) – Between groups - differences depending what group one is in or what treatment is received Formulas: page 550
Bottom Line We are examining the ratio of differences (variances) from treatment to variances from individual differences If the ratio is large there is a significant impact from treatment. We know if a ratio is “large enough” by calculating the ratio of the MST to MSE and conducting an F test.
Fundamental Concepts You are able to compare MULTIPLE means Between-group variance reflects differences in the way the groups were treated Within-group variance reflects individual differences Null hypothesis: no difference in means Alternative hypothesis: difference in means
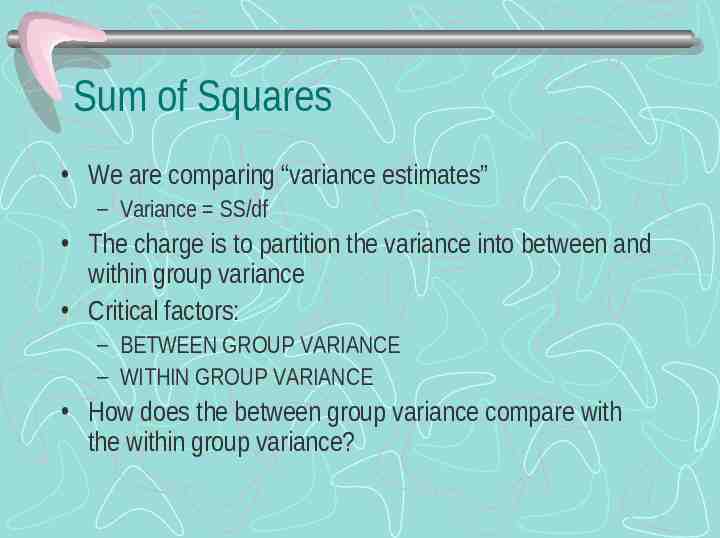
Sum of Squares We are comparing “variance estimates” – Variance SS/df The charge is to partition the variance into between and within group variance Critical factors: – BETWEEN GROUP VARIANCE – WITHIN GROUP VARIANCE How does the between group variance compare with the within group variance?
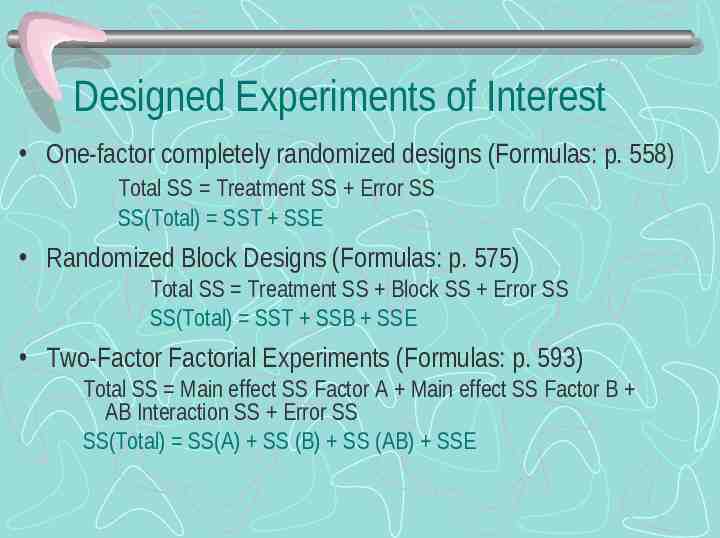
Designed Experiments of Interest One-factor completely randomized designs (Formulas: p. 558) Total SS Treatment SS Error SS SS(Total) SST SSE Randomized Block Designs (Formulas: p. 575) Total SS Treatment SS Block SS Error SS SS(Total) SST SSB SSE Two-Factor Factorial Experiments (Formulas: p. 593) Total SS Main effect SS Factor A Main effect SS Factor B AB Interaction SS Error SS SS(Total) SS(A) SS (B) SS (AB) SSE
Word check When I talk about between groups variability, what am I talking about? What does SS between represent? What does MS (either within or between) represent? What does the F ratio represent?
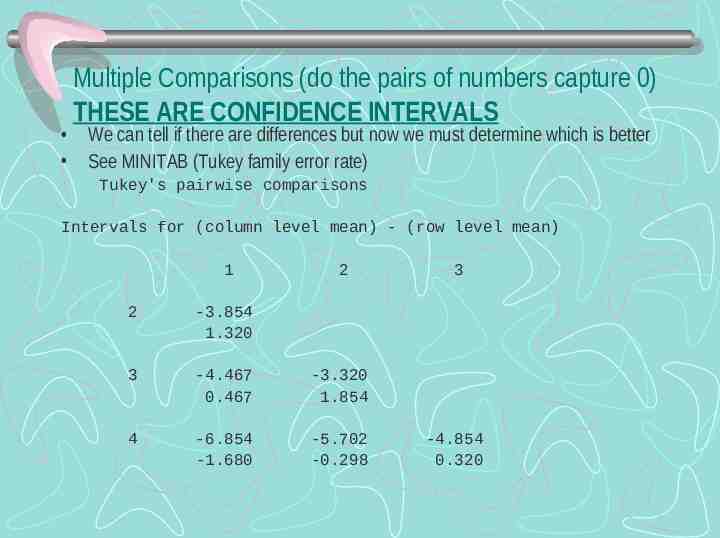
Multiple Comparisons (do the pairs of numbers capture 0) THESE ARE CONFIDENCE INTERVALS We can tell if there are differences but now we must determine which is better See MINITAB (Tukey family error rate) Tukey's pairwise comparisons Intervals for (column level mean) - (row level mean) 1 2 2 -3.854 1.320 3 -4.467 0.467 -3.320 1.854 4 -6.854 -1.680 -5.702 -0.298 3 -4.854 0.320