Visualizing Stats Canada Data Lucia Costanzo MA, MSc, MLIS

17 Slides3.45 MB
Visualizing Stats Canada Data Lucia Costanzo MA, MSc, MLIS McLaughlin Library www.lib.uoguelph.ca
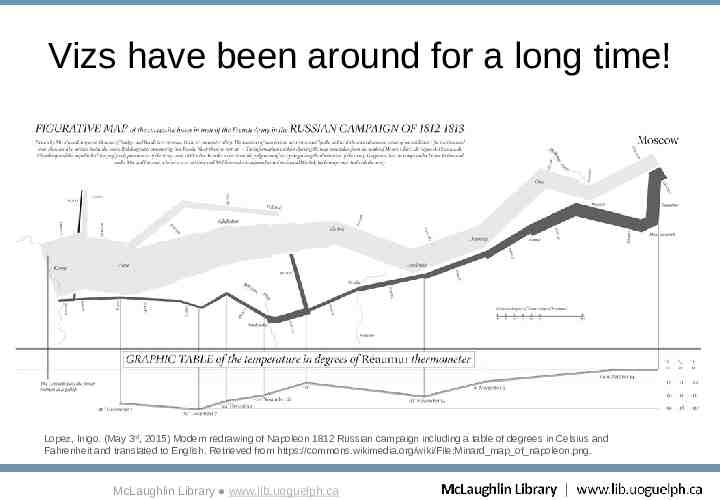
Vizs have been around for a long time! Lopez, Inigo. (May 3rd, 2015) Modern redrawing of Napoleon 1812 Russian campaign including a table of degrees in Celsius and Fahrenheit and translated to English. Retrieved from https://commons.wikimedia.org/wiki/File:Minard map of napoleon.png. McLaughlin Library www.lib.uoguelph.ca
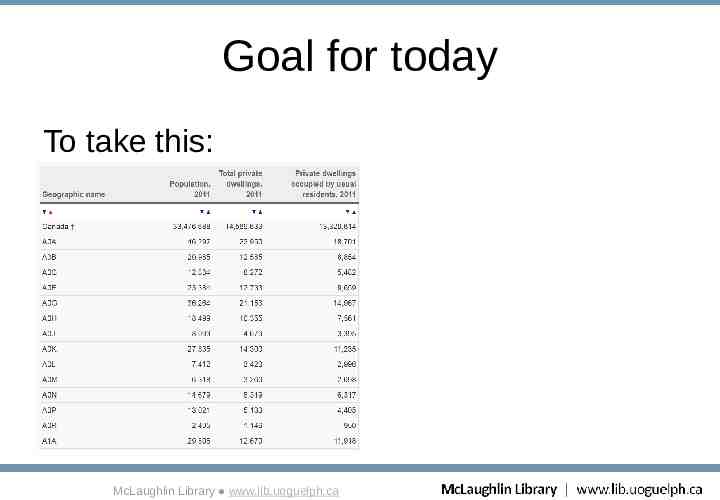
Goal for today To take this: McLaughlin Library www.lib.uoguelph.ca
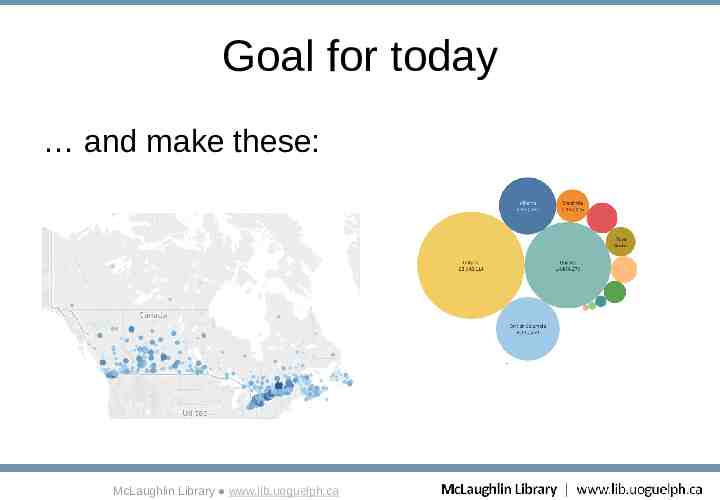
Goal for today and make these: McLaughlin Library www.lib.uoguelph.ca
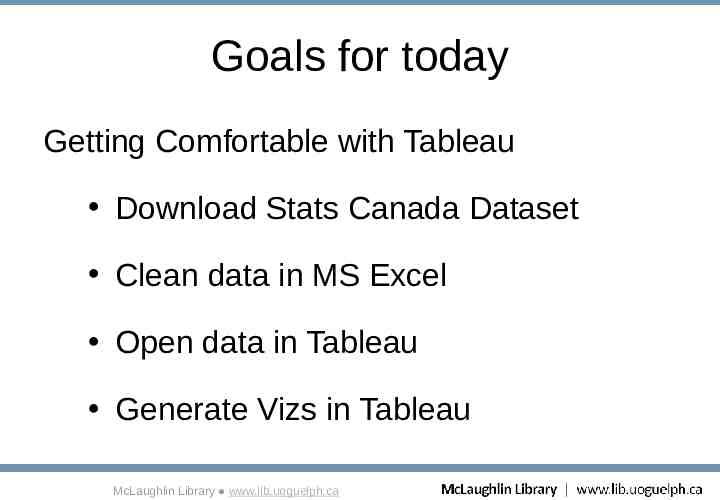
Goals for today Getting Comfortable with Tableau Download Stats Canada Dataset Clean data in MS Excel Open data in Tableau Generate Vizs in Tableau McLaughlin Library www.lib.uoguelph.ca
What’s the difference between various Tableau products? Tableau Desktop Tableau Server Tableau Online Tableau Public (free) Tableau Reader (free) McLaughlin Library www.lib.uoguelph.ca
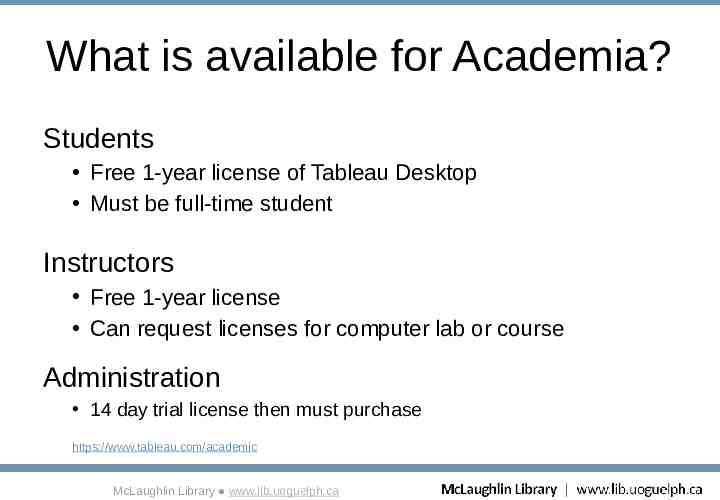
What is available for Academia? Students Free 1-year license of Tableau Desktop Must be full-time student Instructors Free 1-year license Can request licenses for computer lab or course Administration 14 day trial license then must purchase https://www.tableau.com/academic McLaughlin Library www.lib.uoguelph.ca
Tips for prepping data 1. Remove intro text and footers 2. Remove pre-aggregate data 3. Remove blank rows and columns 4. Normalize data http://onlinehelp.tableau.com/current/pro/desktop/en-us/help.htm#data tips.html McLaughlin Library www.lib.uoguelph.ca
Demo 2011 Census - Population and Dwelling Count Highlight Tables McLaughlin Library www.lib.uoguelph.ca
Demo Class Exercise Form into groups and work together to generate another visualization share with the group. Back at insert pm McLaughlin Library www.lib.uoguelph.ca
Tips for Creating Maps in Tableau Preparing Your Geographic Fields Creating Filled Maps How to create density maps using hexbins in Tableau How To: Hex Tile Maps in Tableau McLaughlin Library www.lib.uoguelph.ca
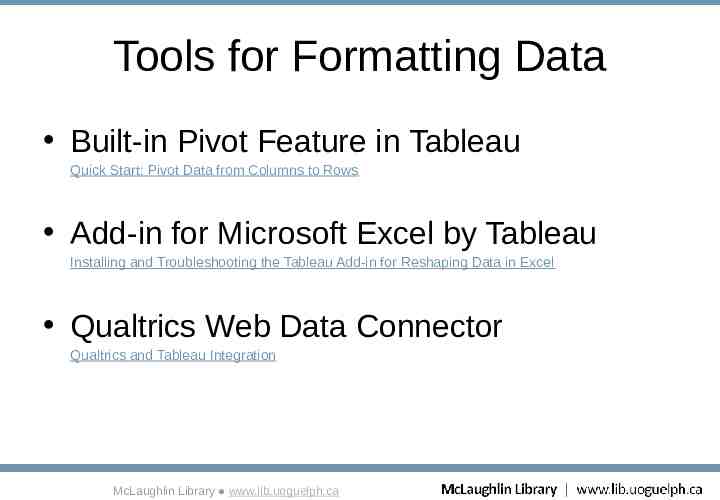
Tools for Formatting Data Built-in Pivot Feature in Tableau Quick Start: Pivot Data from Columns to Rows Add-in for Microsoft Excel by Tableau Installing and Troubleshooting the Tableau Add-in for Reshaping Data in Excel Qualtrics Web Data Connector Qualtrics and Tableau Integration McLaughlin Library www.lib.uoguelph.ca
Demo GSS Cycle 27, 2013 Social Identity & Giving, Volunteering and Participating McLaughlin Library www.lib.uoguelph.ca
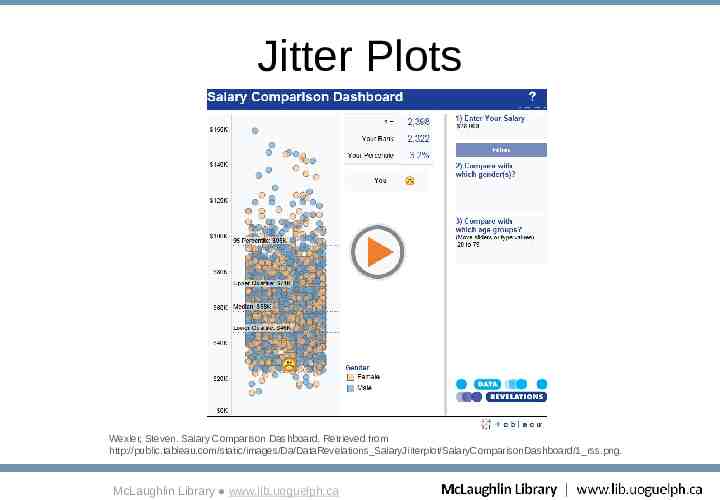
Jitter Plots Wexler, Steven. Salary Comparison Dashboard. Retrieved from http://public.tableau.com/static/images/Da/DataRevelations SalaryJiiterplot/SalaryComparisonDashboard/1 rss.png. McLaughlin Library www.lib.uoguelph.ca
Open Source Viz Software Alternatives Non Programmers Raw Gephi Weka Programmers D3.JS McLaughlin Library www.lib.uoguelph.ca
Help Resources Tableau Online Resources Online Training Videos, Forums, Live Online Training, Roadshows Tableau Libguides Duke Online Courses Data Visualization and Communication with Tableau McLaughlin Library www.lib.uoguelph.ca
Please fill in survey. https://goo.gl/6LUNkb THANK YOU McLaughlin Library www.lib.uoguelph.ca