A Course on Analytical Thinking


58 Slides210.50 KB
A Course on Analytical Thinking
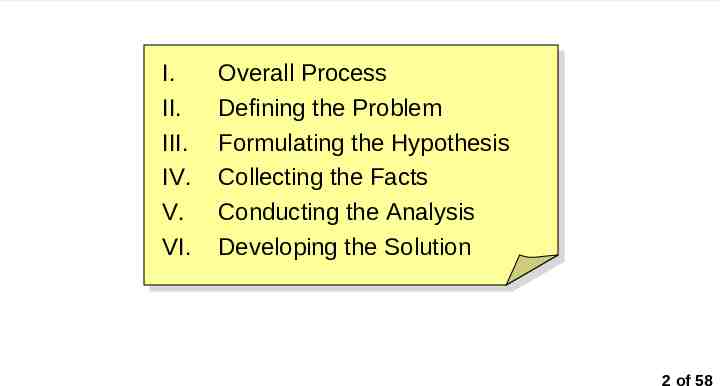
Course Outline I. II. III. IV. V. VI. Overall Process Defining the Problem Formulating the Hypothesis Collecting the Facts Conducting the Analysis Developing the Solution 2 of 58
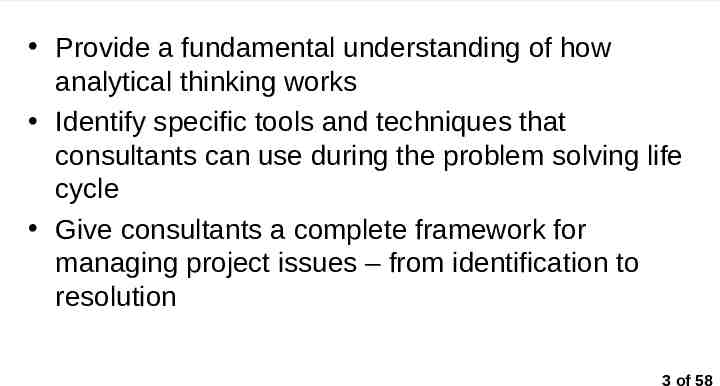
Course Objectives Provide a fundamental understanding of how analytical thinking works Identify specific tools and techniques that consultants can use during the problem solving life cycle Give consultants a complete framework for managing project issues – from identification to resolution 3 of 58
At the end of this session, participants should be able to . Understand the systematic process of problem solving Define the issue as a starting point for your project Focus on the “drivers” behind your issue Know how to apply specific techniques, such as brainstorming, root cause analysis, and SWOT Know how to test your proposed solutions before submission to the client Know how to present viable solutions for solving critical problems 4 of 58
OVERALL PROCESS
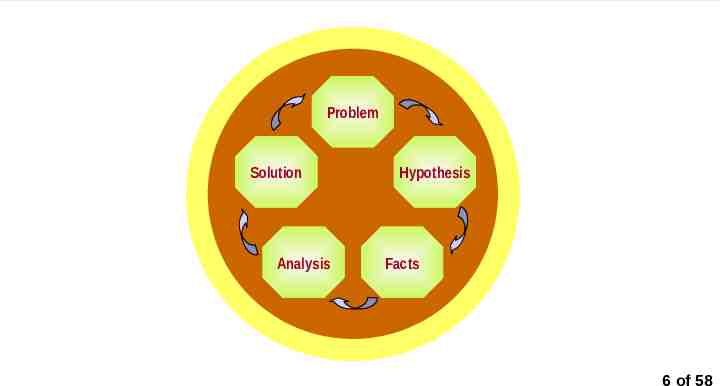
Analytical Thinking follows the scientific approach to problem solving Problem Solution Analysis Hypothesis Facts 6 of 58
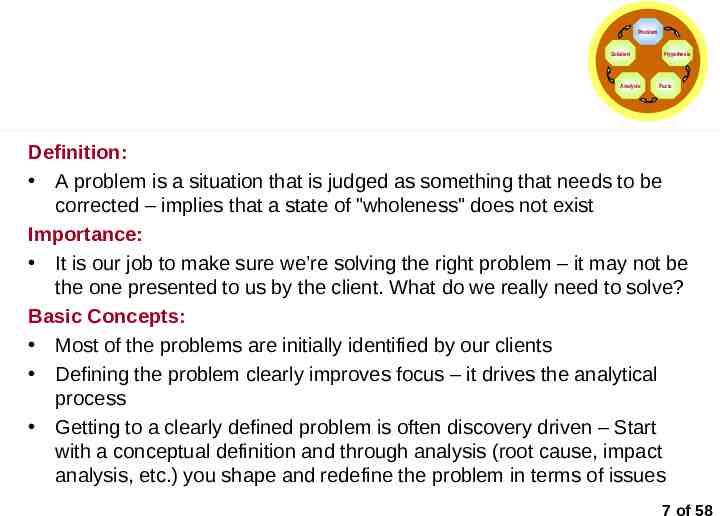
Defining the Problem Problem Solution Analysis Hypothesis Facts Definition: A problem is a situation that is judged as something that needs to be corrected – implies that a state of "wholeness" does not exist Importance: It is our job to make sure we’re solving the right problem – it may not be the one presented to us by the client. What do we really need to solve? Basic Concepts: Most of the problems are initially identified by our clients Defining the problem clearly improves focus – it drives the analytical process Getting to a clearly defined problem is often discovery driven – Start with a conceptual definition and through analysis (root cause, impact analysis, etc.) you shape and redefine the problem in terms of issues 7 of 58
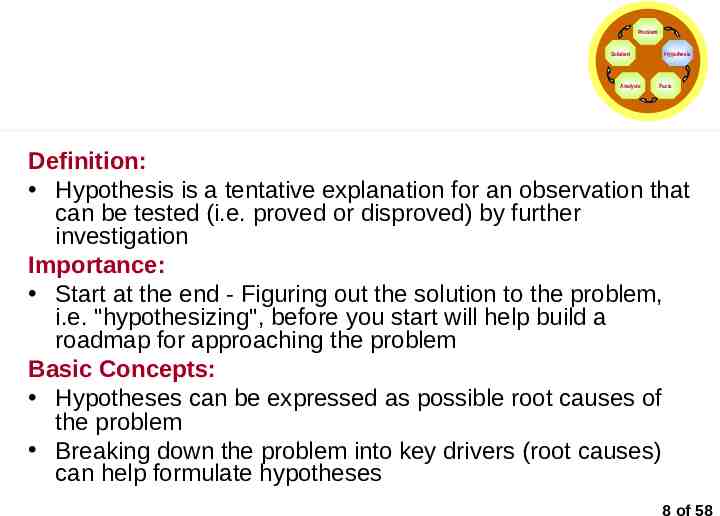
Formulating the Hypotheses Problem Solution Analysis Hypothesis Facts Definition: Hypothesis is a tentative explanation for an observation that can be tested (i.e. proved or disproved) by further investigation Importance: Start at the end - Figuring out the solution to the problem, i.e. "hypothesizing", before you start will help build a roadmap for approaching the problem Basic Concepts: Hypotheses can be expressed as possible root causes of the problem Breaking down the problem into key drivers (root causes) can help formulate hypotheses 8 of 58
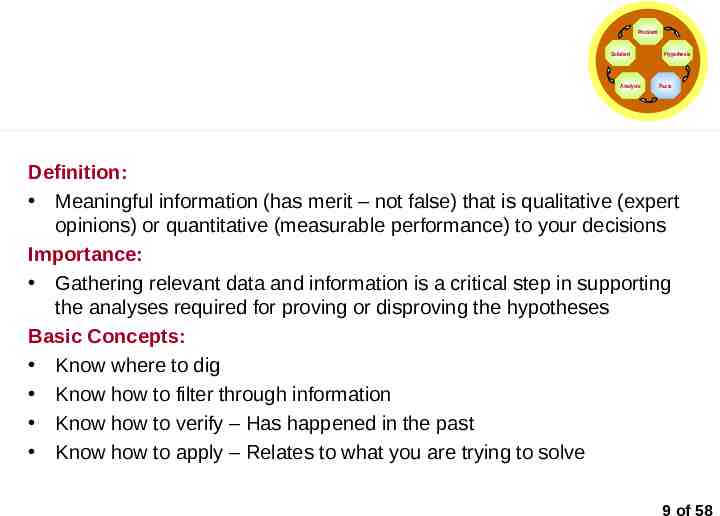
Collecting the Facts Problem Solution Analysis Hypothesis Facts Definition: Meaningful information (has merit – not false) that is qualitative (expert opinions) or quantitative (measurable performance) to your decisions Importance: Gathering relevant data and information is a critical step in supporting the analyses required for proving or disproving the hypotheses Basic Concepts: Know where to dig Know how to filter through information Know how to verify – Has happened in the past Know how to apply – Relates to what you are trying to solve 9 of 58
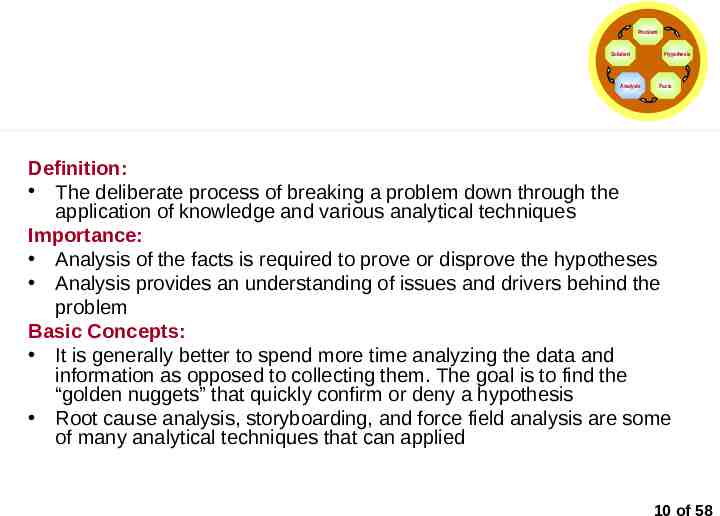
Conducting the Analysis Problem Solution Analysis Hypothesis Facts Definition: The deliberate process of breaking a problem down through the application of knowledge and various analytical techniques Importance: Analysis of the facts is required to prove or disprove the hypotheses Analysis provides an understanding of issues and drivers behind the problem Basic Concepts: It is generally better to spend more time analyzing the data and information as opposed to collecting them. The goal is to find the “golden nuggets” that quickly confirm or deny a hypothesis Root cause analysis, storyboarding, and force field analysis are some of many analytical techniques that can applied 10 of 58
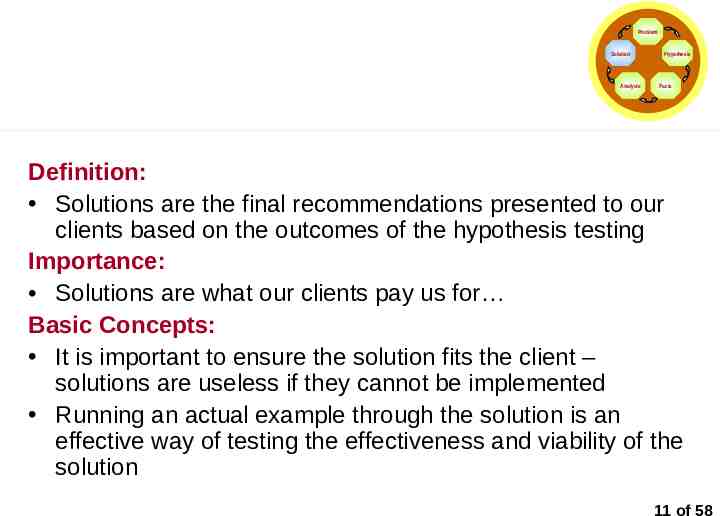
Developing the Solution Problem Solution Analysis Hypothesis Facts Definition: Solutions are the final recommendations presented to our clients based on the outcomes of the hypothesis testing Importance: Solutions are what our clients pay us for Basic Concepts: It is important to ensure the solution fits the client – solutions are useless if they cannot be implemented Running an actual example through the solution is an effective way of testing the effectiveness and viability of the solution 11 of 58
TOOLS AND TECHNIQUES FOR "DEFINING THE PROBLEM"
Problem Identification A problem becomes known when a person observes a discrepancy between the way things are and the way things ought to be. Problems can be identified through: – Comparative/benchmarking studies – Performance reporting - assessment of current performance against goals and objectives – SWOT Analysis – assessment of strengths, weaknesses, opportunities, and threats – Complaints – Surveys – Etc. 13 of 58
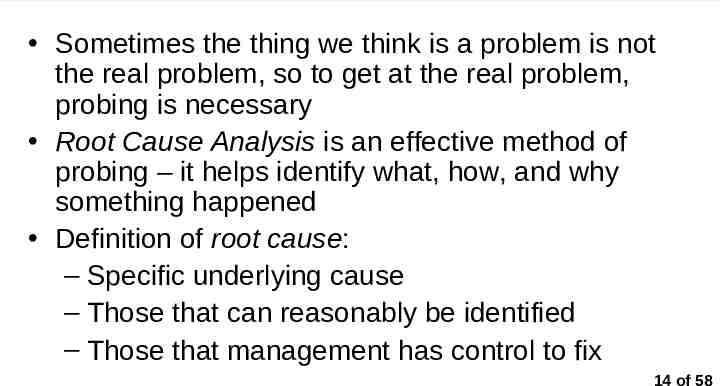
Getting to the "Root" of the Problem Sometimes the thing we think is a problem is not the real problem, so to get at the real problem, probing is necessary Root Cause Analysis is an effective method of probing – it helps identify what, how, and why something happened Definition of root cause: – Specific underlying cause – Those that can reasonably be identified – Those that management has control to fix 14 of 58
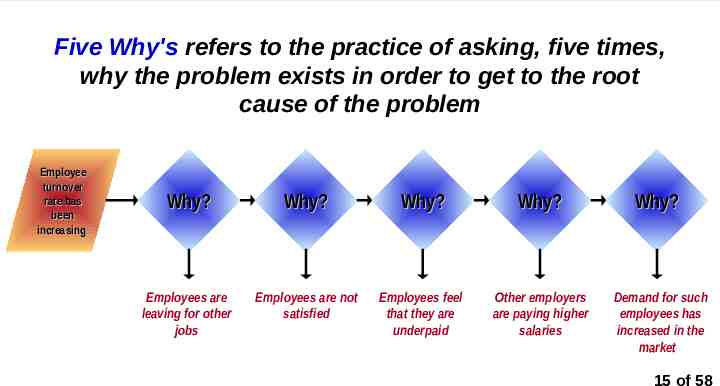
Root Cause Analysis Technique - Five Why’s Five Why's refers to the practice of asking, five times, why the problem exists in order to get to the root cause of the problem Employee turnover rate has been increasing Why? Why? Why? Why? Why? Employees are leaving for other jobs Employees are not satisfied Employees feel that they are underpaid Other employers are paying higher salaries Demand for such employees has increased in the market 15 of 58
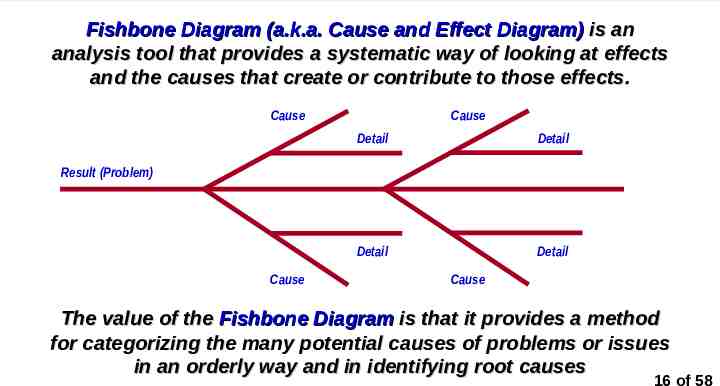
Root Cause Analysis Technique – Fishbone Diagram Fishbone Diagram (a.k.a. Cause and Effect Diagram) is an analysis tool that provides a systematic way of looking at effects and the causes that create or contribute to those effects. Cause Cause Detail Detail Detail Detail Result (Problem) Cause Cause The value of the Fishbone Diagram is that it provides a method for categorizing the many potential causes of problems or issues in an orderly way and in identifying root causes 16 of 58
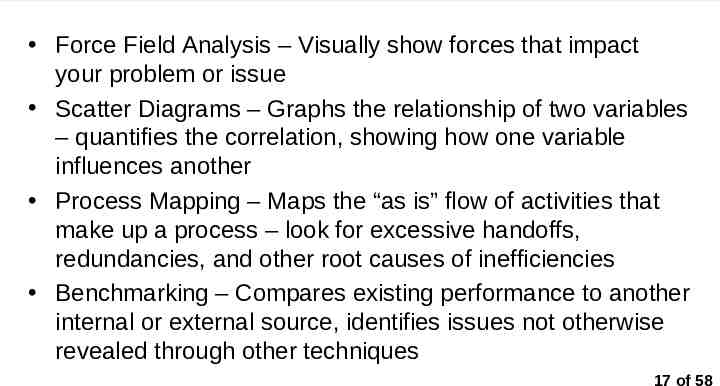
Other Root Cause Analysis Techniques Force Field Analysis – Visually show forces that impact your problem or issue Scatter Diagrams – Graphs the relationship of two variables – quantifies the correlation, showing how one variable influences another Process Mapping – Maps the “as is” flow of activities that make up a process – look for excessive handoffs, redundancies, and other root causes of inefficiencies Benchmarking – Compares existing performance to another internal or external source, identifies issues not otherwise revealed through other techniques 17 of 58
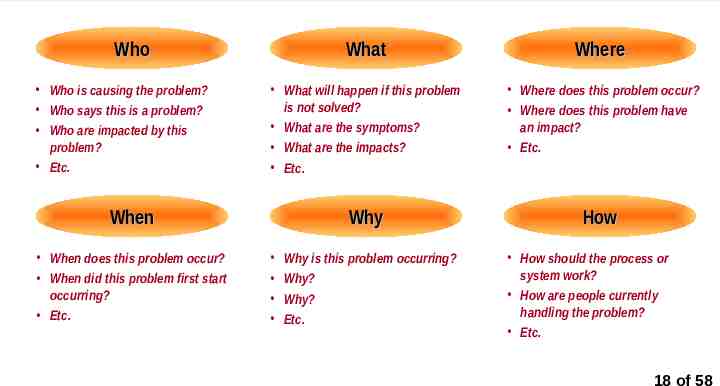
Basic Questions to Ask in Defining the Problem (regardless of the technique used) Who Who is causing the problem? Who says this is a problem? Who are impacted by this problem? Etc. What Where What will happen if this problem is not solved? What are the symptoms? What are the impacts? Etc. Where does this problem occur? Where does this problem have an impact? Etc. Why How When When does this problem occur? When did this problem first start occurring? Etc. Why is this problem occurring? Why? Why? Etc. How should the process or system work? How are people currently handling the problem? Etc. 18 of 58
TOOLS AND TECHNIQUES FOR "FORMULATING THE HYPOTHESES"
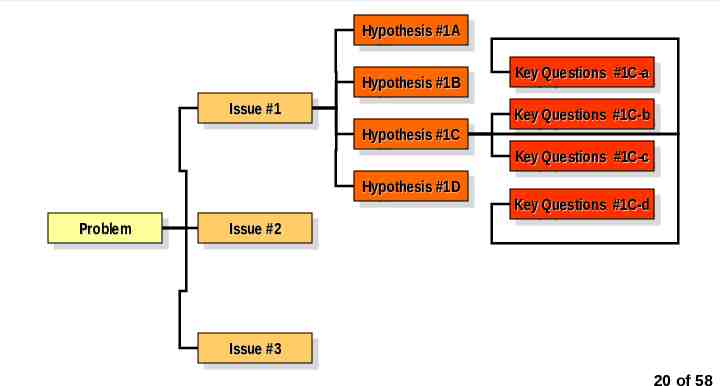
Issue Diagram is an effective method for breaking down problems and formulating hypotheses Hypothesis Hypothesis#1A #1A Hypothesis Hypothesis#1B #1B Issue Issue#1 #1 Hypothesis Hypothesis#1C #1C Hypothesis Hypothesis#1D #1D Problem Problem Issue Issue#2 #2 Key KeyQuestions Questions #1C-a #1C-a Key KeyQuestions Questions #1C-b #1C-b Key KeyQuestions Questions #1C-c #1C-c Key KeyQuestions Questions #1C-d #1C-d Issue Issue#3 #3 20 of 58
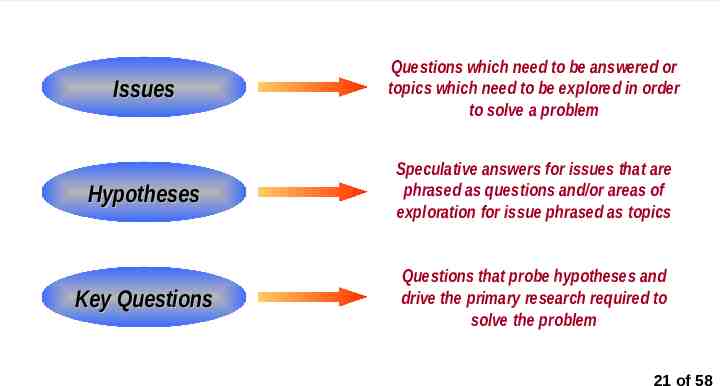
Key Components of Issue Diagram Issues Questions which need to be answered or topics which need to be explored in order to solve a problem Hypotheses Speculative answers for issues that are phrased as questions and/or areas of exploration for issue phrased as topics Key Questions Questions that probe hypotheses and drive the primary research required to solve the problem 21 of 58
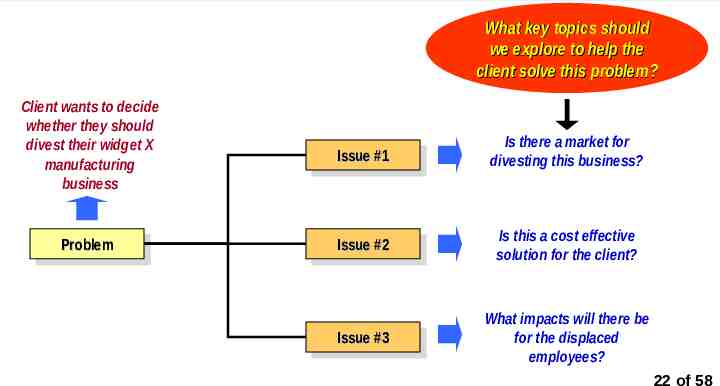
Identifying the Issues What key topics should we explore to help the client solve this problem? Client wants to decide whether they should divest their widget X manufacturing business Problem Problem Issue Issue#1 #1 Is there a market for divesting this business? Issue Issue#2 #2 Is this a cost effective solution for the client? Issue Issue#3 #3 What impacts will there be for the displaced employees? 22 of 58
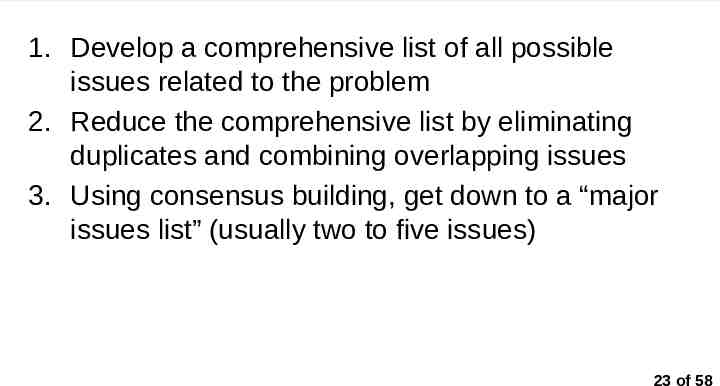
Key to Identifying Issues 1. Develop a comprehensive list of all possible issues related to the problem 2. Reduce the comprehensive list by eliminating duplicates and combining overlapping issues 3. Using consensus building, get down to a “major issues list” (usually two to five issues) 23 of 58
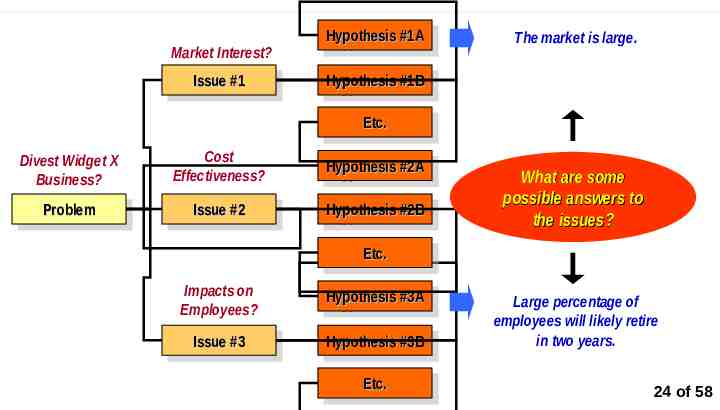
Formulating the Hypotheses Market Interest? Issue Issue#1 #1 Hypothesis Hypothesis#1A #1A The market is large. Hypothesis Hypothesis#1B #1B Etc. Etc. Divest Widget X Business? Cost Effectiveness? Hypothesis Hypothesis#2A #2A Problem Problem Issue Issue#2 #2 Hypothesis Hypothesis#2B #2B What are some possible answers to the issues? Etc. Etc. Impacts on Employees? Hypothesis Hypothesis#3A #3A Issue Issue#3 #3 Hypothesis Hypothesis#3B #3B Etc. Etc. Large percentage of employees will likely retire in two years. 24 of 58
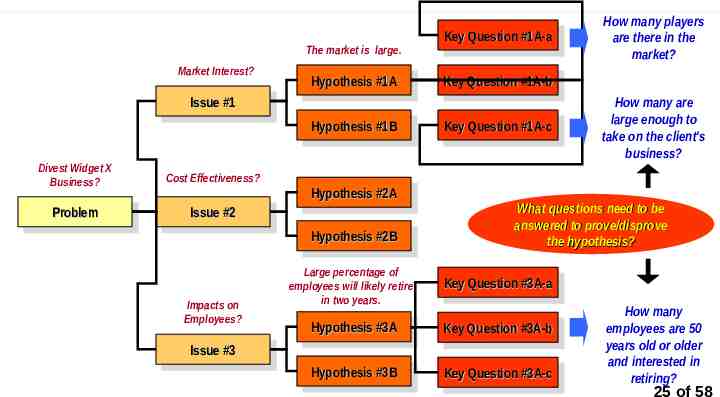
Framing the Key Questions The market is large. Market Interest? Issue Issue#1#1 Divest Widget X Business? Cost Effectiveness? Problem Problem Issue Issue#2#2 Hypothesis Hypothesis#1A #1A Key KeyQuestion Question#1A-b #1A-b Hypothesis Hypothesis#1B #1B Key KeyQuestion Question#1A-c #1A-c Hypothesis Hypothesis#2A #2A Hypothesis Hypothesis#2B #2B Impacts on Employees? Issue Issue#3#3 Key KeyQuestion Question#1A-a #1A-a Large percentage of employees will likely retire in two years. How many players are there in the market? How many are large enough to take on the client's business? What questions need to be answered to prove/disprove the hypothesis? Key KeyQuestion Question#3A-a #3A-a Hypothesis Hypothesis#3A #3A Key KeyQuestion Question#3A-b #3A-b Hypothesis Hypothesis#3B #3B Key KeyQuestion Question#3A-c #3A-c How many employees are 50 years old or older and interested in retiring? 25 of 58
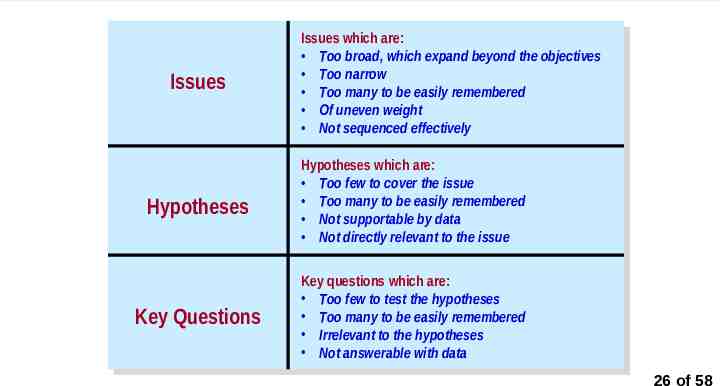
Common Pitfalls in Creating Issue Diagram Issues Issues which are: Too broad, which expand beyond the objectives Too narrow Too many to be easily remembered Of uneven weight Not sequenced effectively Hypotheses Hypotheses which are: Too few to cover the issue Too many to be easily remembered Not supportable by data Not directly relevant to the issue Key Questions Key questions which are: Too few to test the hypotheses Too many to be easily remembered Irrelevant to the hypotheses Not answerable with data 26 of 58
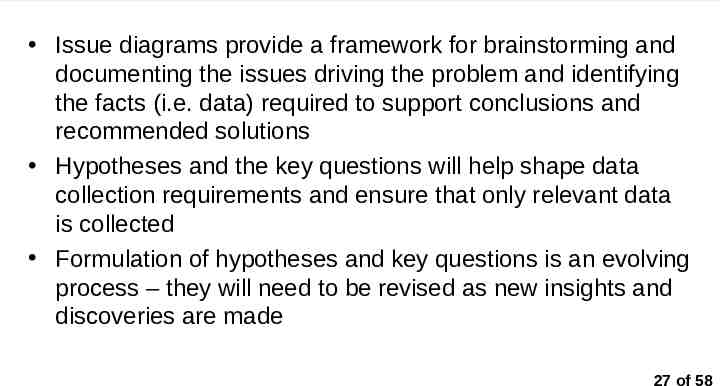
Key Messages Issue diagrams provide a framework for brainstorming and documenting the issues driving the problem and identifying the facts (i.e. data) required to support conclusions and recommended solutions Hypotheses and the key questions will help shape data collection requirements and ensure that only relevant data is collected Formulation of hypotheses and key questions is an evolving process – they will need to be revised as new insights and discoveries are made 27 of 58
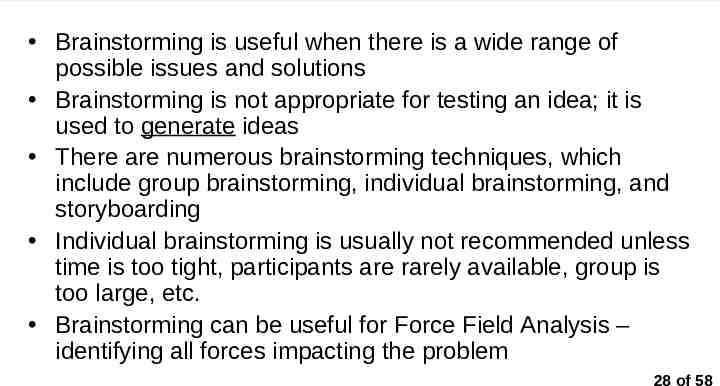
Brainstorming – A Method for Identifying Issues and Formulating Hypotheses Brainstorming is useful when there is a wide range of possible issues and solutions Brainstorming is not appropriate for testing an idea; it is used to generate ideas There are numerous brainstorming techniques, which include group brainstorming, individual brainstorming, and storyboarding Individual brainstorming is usually not recommended unless time is too tight, participants are rarely available, group is too large, etc. Brainstorming can be useful for Force Field Analysis – identifying all forces impacting the problem 28 of 58
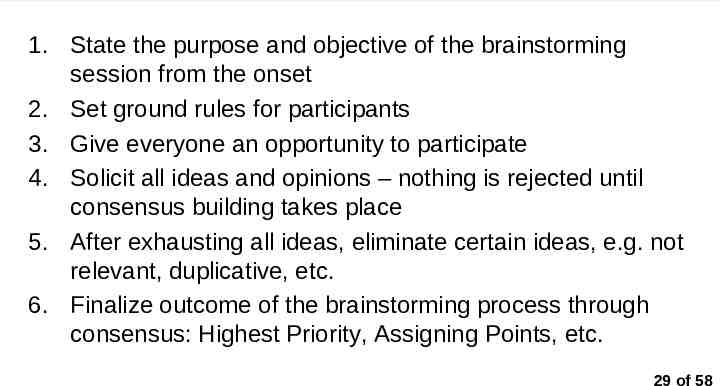
Tips for Brainstorming 1. State the purpose and objective of the brainstorming session from the onset 2. Set ground rules for participants 3. Give everyone an opportunity to participate 4. Solicit all ideas and opinions – nothing is rejected until consensus building takes place 5. After exhausting all ideas, eliminate certain ideas, e.g. not relevant, duplicative, etc. 6. Finalize outcome of the brainstorming process through consensus: Highest Priority, Assigning Points, etc. 29 of 58
TOOLS AND TECHNIQUES FOR "COLLECTING THE FACTS"
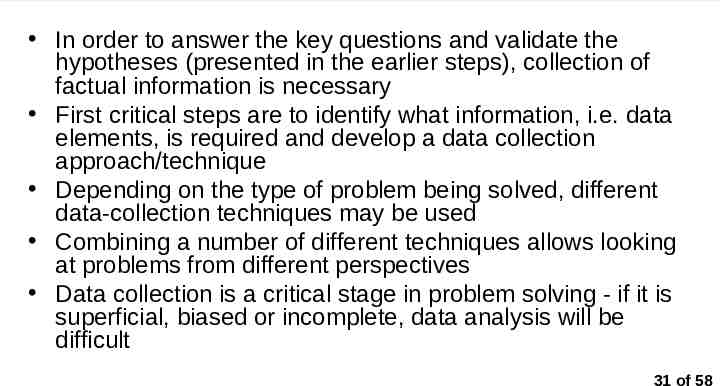
Getting to the Facts In order to answer the key questions and validate the hypotheses (presented in the earlier steps), collection of factual information is necessary First critical steps are to identify what information, i.e. data elements, is required and develop a data collection approach/technique Depending on the type of problem being solved, different data-collection techniques may be used Combining a number of different techniques allows looking at problems from different perspectives Data collection is a critical stage in problem solving - if it is superficial, biased or incomplete, data analysis will be difficult 31 of 58
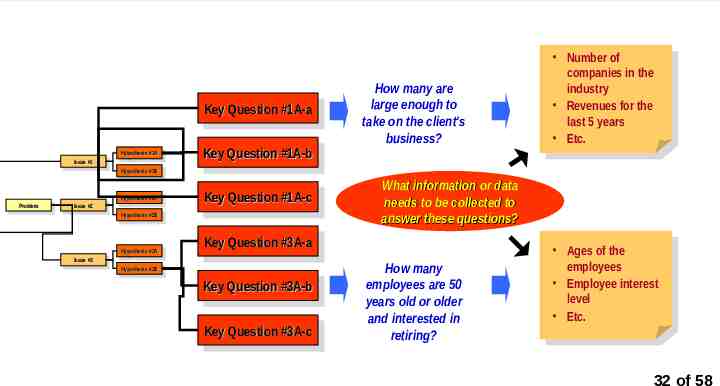
Using the Issue Diagram to identify data and information needs Key KeyQuestion Question#1A-a #1A-a Issue #1 Issue #1 Problem Problem Issue Issue#2#2 Issue #3 Issue #3 Hypothesis Hypothesis#1A #1A Key KeyQuestion Question#1A-b #1A-b Hypothesis #1B Hypothesis #1B Hypothesis #2A Hypothesis #2A Hypothesis Hypothesis#2B #2B Hypothesis #3A Hypothesis #3A Key KeyQuestion Question#1A-c #1A-c How many are large enough to take on the client's business? What information or data needs to be collected to answer these questions? Key KeyQuestion Question#3A-a #3A-a Hypothesis #3B Hypothesis #3B Key KeyQuestion Question#3A-b #3A-b Key KeyQuestion Question#3A-c #3A-c Number of companies in the industry Revenues for the last 5 years Etc. How many employees are 50 years old or older and interested in retiring? Ages of the employees Employee interest level Etc. 32 of 58
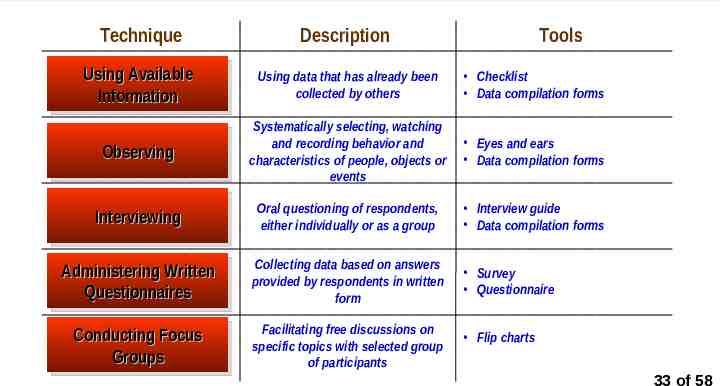
Data Collection Techniques Technique Description Tools Using UsingAvailable Available Information Information Using data that has already been collected by others Checklist Data compilation forms Observing Observing Systematically selecting, watching and recording behavior and characteristics of people, objects or events Eyes and ears Data compilation forms Interviewing Interviewing Oral questioning of respondents, either individually or as a group Interview guide Data compilation forms Administering AdministeringWritten Written Questionnaires Questionnaires Collecting data based on answers provided by respondents in written form Conducting ConductingFocus Focus Groups Groups Facilitating free discussions on specific topics with selected group of participants Survey Questionnaire Flip charts 33 of 58
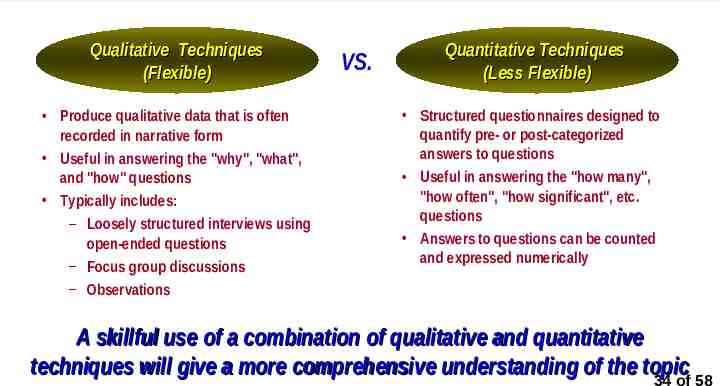
Importance of Combining Different Data Collection Techniques Qualitative Techniques (Flexible) Produce qualitative data that is often recorded in narrative form Useful in answering the "why", "what", and "how" questions Typically includes: – Loosely structured interviews using open-ended questions – Focus group discussions – Observations VS. Quantitative Techniques (Less Flexible) Structured questionnaires designed to quantify pre- or post-categorized answers to questions Useful in answering the "how many", "how often", "how significant", etc. questions Answers to questions can be counted and expressed numerically A skillful use of a combination of qualitative and quantitative techniques will give a more comprehensive understanding of the topic 34 of 58
TOOLS AND TECHNIQUES FOR "CONDUCTING THE ANALYSIS"
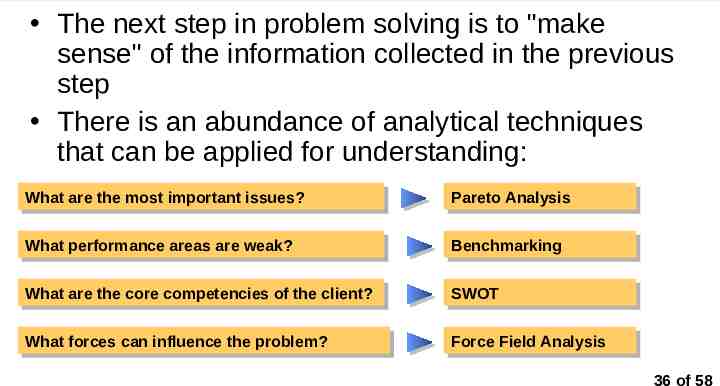
Conducting the Analysis The next step in problem solving is to "make sense" of the information collected in the previous step There is an abundance of analytical techniques that can be applied for understanding: What Whatare arethe themost mostimportant importantissues? issues? Pareto ParetoAnalysis Analysis What Whatperformance performanceareas areasare areweak? weak? Benchmarking Benchmarking What Whatare arethe thecore corecompetencies competenciesof ofthe theclient? client? SWOT SWOT What Whatforces forcescan caninfluence influencethe theproblem? problem? Force Force Field FieldAnalysis Analysis 36 of 58
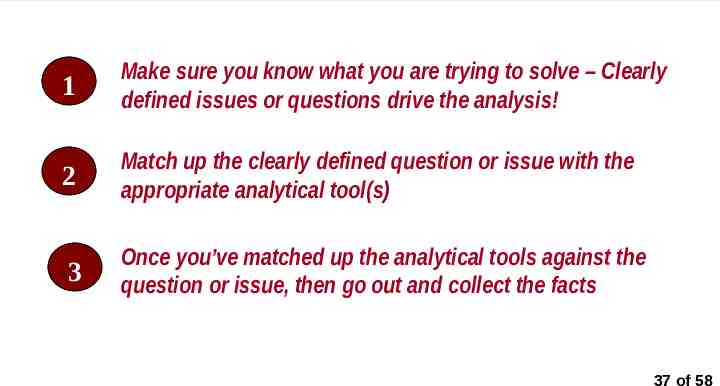
Specific Sequential Steps that lead up to the Analysis 1 Make sure you know what you are trying to solve – Clearly defined issues or questions drive the analysis! 2 Match up the clearly defined question or issue with the appropriate analytical tool(s) 3 Once you’ve matched up the analytical tools against the question or issue, then go out and collect the facts 37 of 58
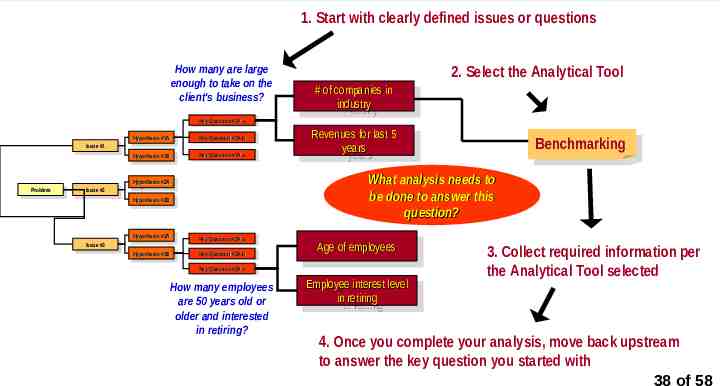
Apply analytical tools and move back upstream 1. Start with clearly defined issues or questions How many are large enough to take on the client's business? Key KeyQuestion Question#1A-a #1A-a Issue Issue#1#1 Problem Problem Issue Issue#2#2 Issue #3 Issue #3 Hypothesis Hypothesis#1A #1A Key KeyQuestion Question#1A-b #1A-b Hypothesis Hypothesis#1B #1B Key KeyQuestion Question#1A-c #1A-c 2. Select the Analytical Tool # of companies in # of companies in industry industry Revenues Revenuesforforlast last5 5 years years Benchmarking What analysis needs to be done to answer this question? Hypothesis #2A Hypothesis #2A Hypothesis Hypothesis#2B #2B Hypothesis Hypothesis#3A #3A Key KeyQuestion Question#3A-a #3A-a Hypothesis Hypothesis#3B #3B Key KeyQuestion Question#3A-b #3A-b Age of employees Age of employees Key KeyQuestion Question#3A-c #3A-c How many employees are 50 years old or older and interested in retiring? Employee interest level Employee interest level in retiring in retiring 3. Collect required information per the Analytical Tool selected 4. Once you complete your analysis, move back upstream to answer the key question you started with 38 of 58
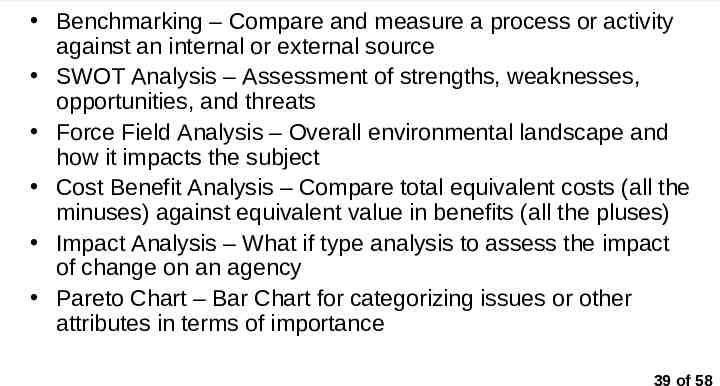
Analytical Techniques Benchmarking – Compare and measure a process or activity against an internal or external source SWOT Analysis – Assessment of strengths, weaknesses, opportunities, and threats Force Field Analysis – Overall environmental landscape and how it impacts the subject Cost Benefit Analysis – Compare total equivalent costs (all the minuses) against equivalent value in benefits (all the pluses) Impact Analysis – What if type analysis to assess the impact of change on an agency Pareto Chart – Bar Chart for categorizing issues or other attributes in terms of importance 39 of 58
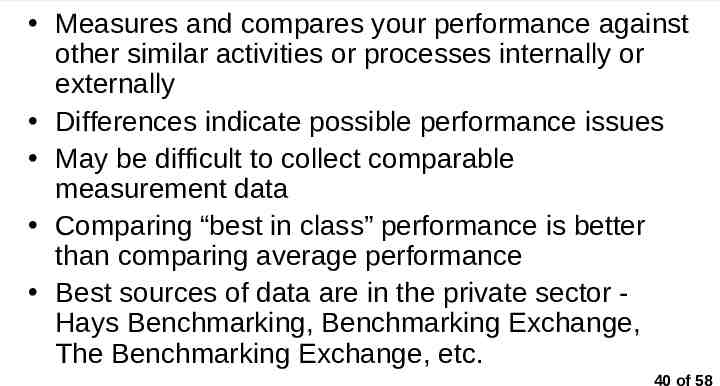
Benchmarking Measures and compares your performance against other similar activities or processes internally or externally Differences indicate possible performance issues May be difficult to collect comparable measurement data Comparing “best in class” performance is better than comparing average performance Best sources of data are in the private sector Hays Benchmarking, Benchmarking Exchange, The Benchmarking Exchange, etc. 40 of 58
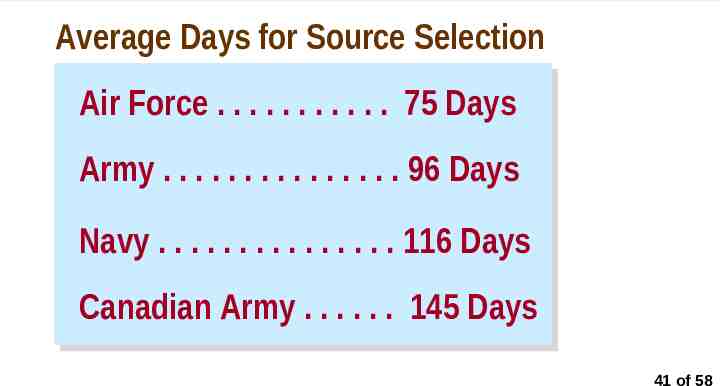
Benchmarking Example Average Days for Source Selection Air Force . . . . . . . . . . . 75 Days Army . . . . . . . . . . . . . . . 96 Days Navy . . . . . . . . . . . . . . . 116 Days Canadian Army . . . . . . 145 Days 41 of 58
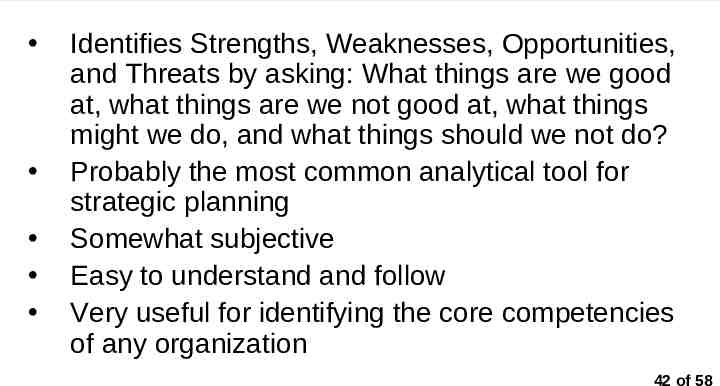
SWOT – Strengths Weaknesses Opportunities Threats Identifies Strengths, Weaknesses, Opportunities, and Threats by asking: What things are we good at, what things are we not good at, what things might we do, and what things should we not do? Probably the most common analytical tool for strategic planning Somewhat subjective Easy to understand and follow Very useful for identifying the core competencies of any organization 42 of 58
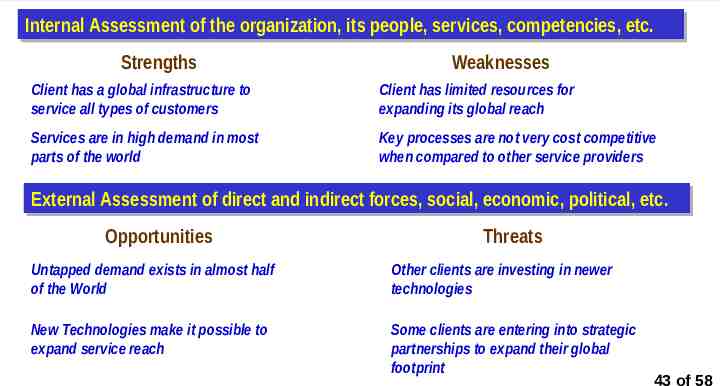
SWOT Example Internal Internal Assessment Assessment of of the the organization, organization, its its people, people, services, services, competencies, competencies, etc. etc. Strengths Weaknesses Client has a global infrastructure to service all types of customers Client has limited resources for expanding its global reach Services are in high demand in most parts of the world Key processes are not very cost competitive when compared to other service providers External External Assessment Assessment of of direct direct and and indirect indirect forces, forces, social, social, economic, economic, political, political, etc. etc. Opportunities Threats Untapped demand exists in almost half of the World Other clients are investing in newer technologies New Technologies make it possible to expand service reach Some clients are entering into strategic partnerships to expand their global footprint 43 of 58
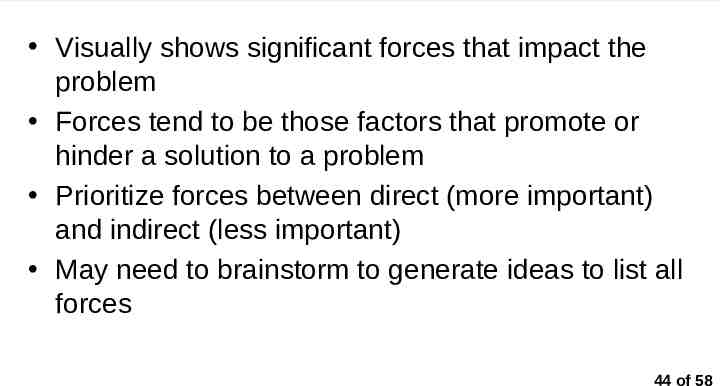
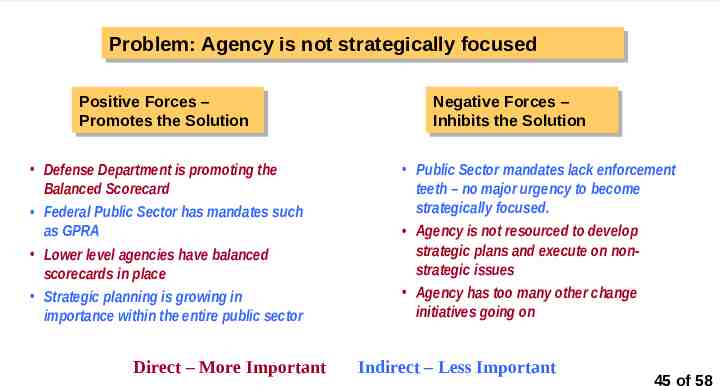
Force Field Visually shows significant forces that impact the problem Forces tend to be those factors that promote or hinder a solution to a problem Prioritize forces between direct (more important) and indirect (less important) May need to brainstorm to generate ideas to list all forces 44 of 58
Force Field Example Problem: Problem: Agency Agency is is not not strategically strategically focused focused Positive PositiveForces Forces–– Promotes Promotesthe theSolution Solution Defense Department is promoting the Balanced Scorecard Federal Public Sector has mandates such as GPRA Lower level agencies have balanced scorecards in place Strategic planning is growing in importance within the entire public sector Direct – More Important Negative NegativeForces Forces–– Inhibits Inhibits the theSolution Solution Public Sector mandates lack enforcement teeth – no major urgency to become strategically focused. Agency is not resourced to develop strategic plans and execute on nonstrategic issues Agency has too many other change initiatives going on Indirect – Less Important 45 of 58
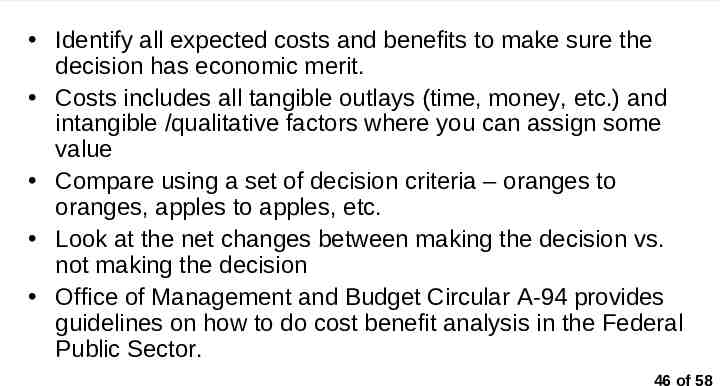
Cost Benefit Identify all expected costs and benefits to make sure the decision has economic merit. Costs includes all tangible outlays (time, money, etc.) and intangible /qualitative factors where you can assign some value Compare using a set of decision criteria – oranges to oranges, apples to apples, etc. Look at the net changes between making the decision vs. not making the decision Office of Management and Budget Circular A-94 provides guidelines on how to do cost benefit analysis in the Federal Public Sector. 46 of 58
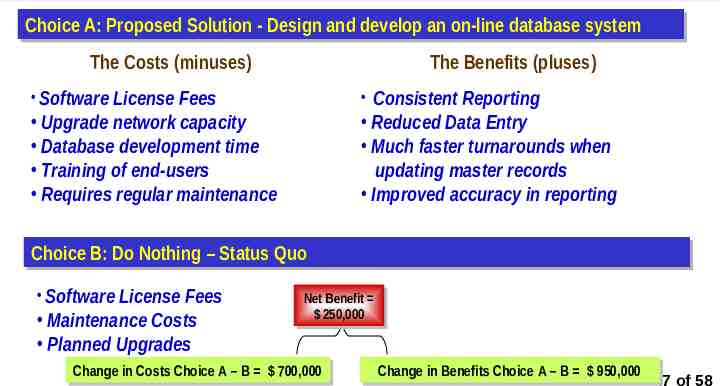
Cost Benefit Example Choice Choice A: A: Proposed Proposed Solution Solution -- Design Design and and develop develop an an on-line on-line database database system system The Costs (minuses) The Benefits (pluses) Software License Fees Consistent Reporting Reduced Data Entry Much faster turnarounds when updating master records Improved accuracy in reporting Upgrade network capacity Database development time Training of end-users Requires regular maintenance Choice Choice B: B: Do Do Nothing Nothing –– Status Status Quo Quo Software License Fees Maintenance Costs Planned Upgrades Net NetBenefit Benefit 250,000 250,000 Change Changein in Costs CostsChoice ChoiceAA–– BB 700,000 700,000 Change Changein in Benefits BenefitsChoice ChoiceAA ––BB 950,000 950,000 47 of 58
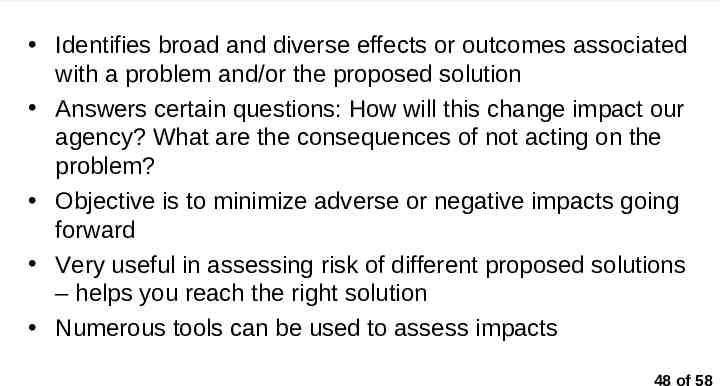
Impact Analysis Identifies broad and diverse effects or outcomes associated with a problem and/or the proposed solution Answers certain questions: How will this change impact our agency? What are the consequences of not acting on the problem? Objective is to minimize adverse or negative impacts going forward Very useful in assessing risk of different proposed solutions – helps you reach the right solution Numerous tools can be used to assess impacts 48 of 58
Impact Analysis Tools Scenario Playing – Storyboarding out how the future will unfold between alternatives: Do Nothing vs. Solution Cost Benefit Analysis - Used to quantify impacts Decision Tree Analysis – Build a tree and assign probabilities to each alternative to arrive at the most likely solution Simulation – Modeling a process and seeing how it changes when one or more variables change Prototype Model – Build and test the solution on a small scale before implementation to flush out lessons learned 49 of 58
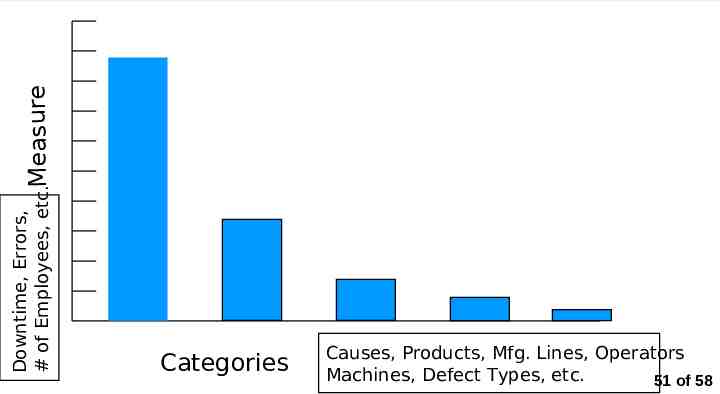
Pareto Analysis Quantifies what is most important on a graph – 80 / 20 Rule Puts focus on the significant problems or issues Must group problems or issues based on a common and measurable attribute (such as reworks, errors, downtime, hours, etc.) Left Vertical Axis of Bar Chart Must categorize problems or issues – what type is it? (poor quality, long wait times, etc.) Right Horizontal Axis of Bar Chart Plot the data and rank according to frequency – descending order from left to right 50 of 58
Downtime, Errors, # of Employees, etc.Measure Pareto Chart Categories Causes, Products, Mfg. Lines, Operators Machines, Defect Types, etc. 51 of 58
Key Messages Don’t rush out and collect information until you know what analytical tools you need to use – each tool has its own information needs Use a combination of tools to cover all the bases All decisions involve some assumptions – so you will never have all the facts Analysis is a discover driven process, it moves incrementally in baby steps – you learn, adjust and go through numerous iterations until you have insights; i.e. you can now take action on the issue or problem 52 of 58
TOOLS AND TECHNIQUES FOR "DEVELOPING THE SOLUTION"
Basic Concepts Select and plan the solution that has the greatest impact on solving the problem Use a solutions rating matrix to weigh different solutions based on selection criteria (costs, probability of success, ease of implementation) Solutions should have support from your previous analysis that you can clearly communicate to the client Test your solutions as much as you can – use some of the Impact Analysis Tools 54 of 58
Key Messages 100% out-of-the box solutions don’t exist No solution is a guarantee – be flexible with implementation and be willing to revisit your requirements Solutions rarely work unless you get buy-in and commitment from the client – if the client refuses to accept the solution, it will not work! Be prepared to back up your solution with an implementation plan, complete with milestones to measure performance 55 of 58
Common Land Mines that Blow Analytical Thinking Apart Once a problem is defined, Professional Consultants must have some ability to develop a possible solution. If the Consultant has no control to make recommendations for a problem, then the problem has been defined outside the scope of the project. The client’s definition of the problem may not be correct. The client may lack the knowledge and experience that Professional Consultants have. Since most problems are not unique, Professional Consultants may be able to validate the problem and possible solutions against other sources (past projects, other experts, etc.). The best solutions to a problem are often too difficult for the client to implement. So be careful about recommending the optimal solution to a problem. Most solutions require some degree of compromise for implementation. 56 of 58
Summary Analytical Thinking follows the Scientific Approach Five Step Process for Consultants: - Define the Problem - Test in the form of Hypothesis - Focus on Facts - Analysis (Various Analytical Tools) - Recommend a Solution 57 of 58
Questions and Comments Thanks for your participation! 58 of 58