40a. Number of fatalities in construction, by class of
5 Slides343.38 KB
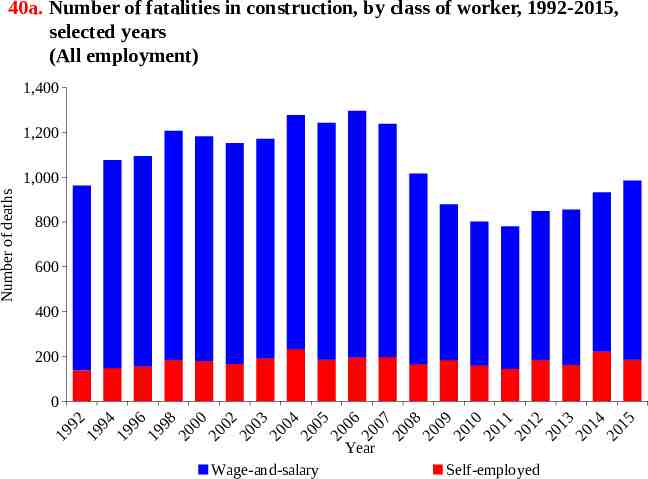
40a. Number of fatalities in construction, by class of worker, 1992-2015, selected years (All employment) 1,400 1,200 Number of deaths 1,000 800 600 400 200 0 9 2 994 99 6 998 000 002 003 004 00 5 006 00 7 00 8 009 01 0 011 012 013 014 015 9 1 1 1 1 2 2 2 2 2 2 2 2 2 2 2 2 2 2 2 Year Wage-and-salary Self-employed
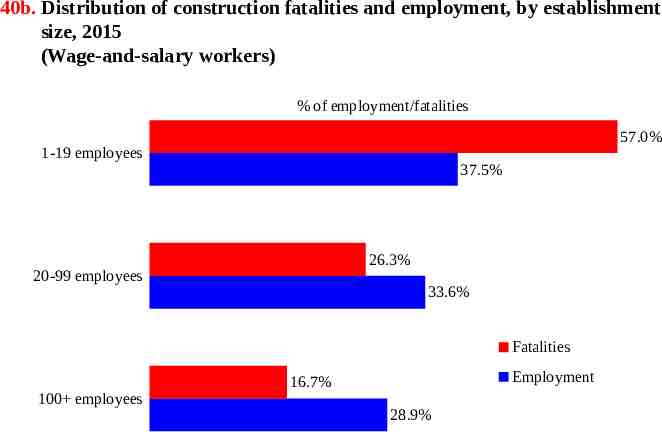
40b. Distribution of construction fatalities and employment, by establishment size, 2015 (Wage-and-salary workers) % of employment/fatalities 57.0% 1-19 employees 37.5% 26.3% 20-99 employees 33.6% Fatalities 100 employees Employment 16.7% 28.9%
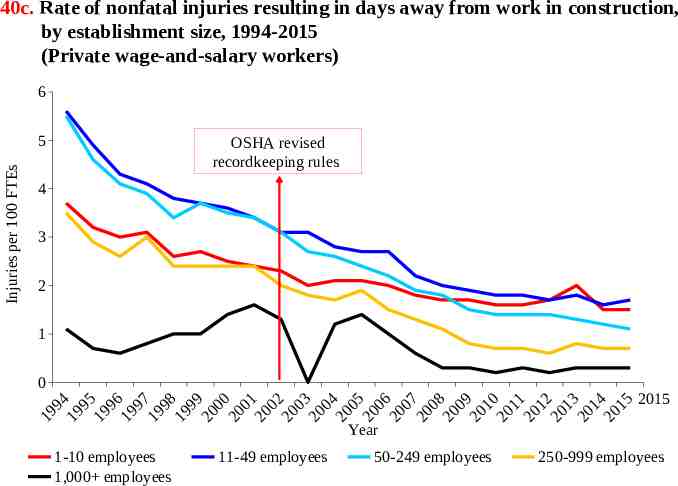
40c. Rate of nonfatal injuries resulting in days away from work in construction, by establishment size, 1994-2015 (Private wage-and-salary workers) 6 Injuries per 100 FTEs 5 OSHA revised recordkeeping rules 4 3 2 1 0 4 95 96 97 98 99 00 01 02 03 04 05 06 07 08 09 10 11 12 13 14 15 2015 9 19 19 19 19 19 19 20 20 20 20 20 20 20 20 20 20 20 20 20 20 20 20 Year 1-10 employees 1,000 employees 11-49 employees 50-249 employees 250-999 employees
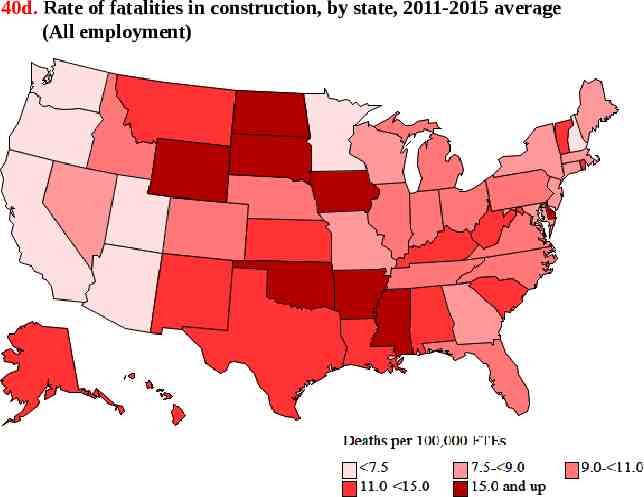
40d. Rate of fatalities in construction, by state, 2011-2015 average (All employment)
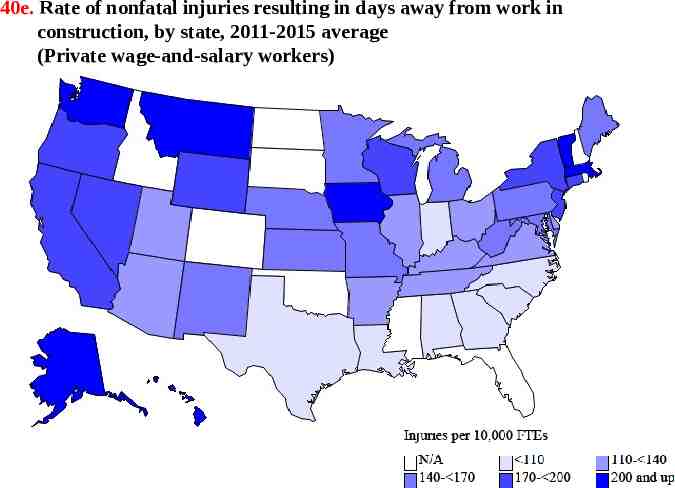
40e. Rate of nonfatal injuries resulting in days away from work in construction, by state, 2011-2015 average (Private wage-and-salary workers)