2020 Census Self-Response Rates for Deep East Texas Council of


13 Slides3.47 MB
2020 Census Self-Response Rates for Deep East Texas Council of Governments DETCOG Board Meeting June 25, 2020 @TexasDemography
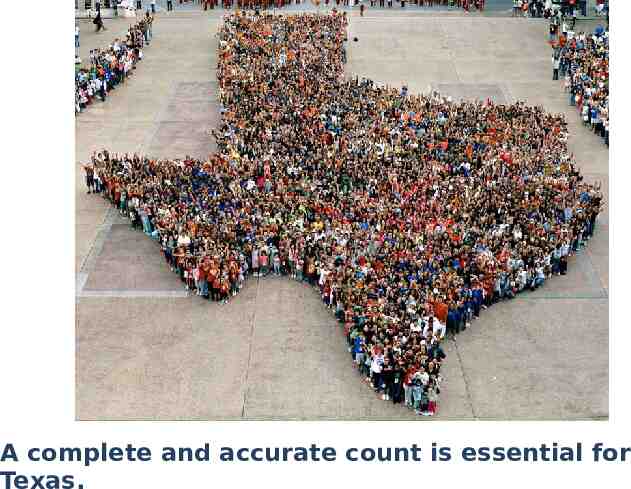
A complete and accurate count is essential for
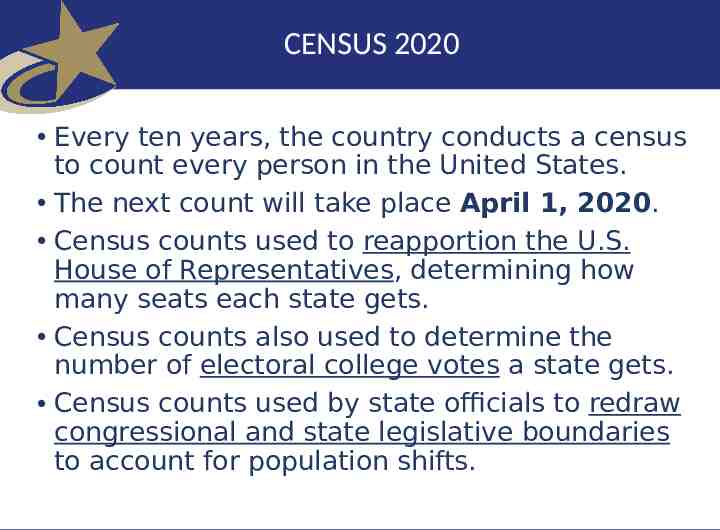
CENSUS 2020 Every ten years, the country conducts a census to count every person in the United States. The next count will take place April 1, 2020. Census counts used to reapportion the U.S. House of Representatives, determining how many seats each state gets. Census counts also used to determine the number of electoral college votes a state gets. Census counts used by state officials to redraw congressional and state legislative boundaries to account for population shifts.
CENSUS 2020 Businesses rely on Census data for market research, locations, and economic development. Census derived data are used to allocate over 1.5 trillion in federal funds to support healthcare, education, transportation, or other service programs.
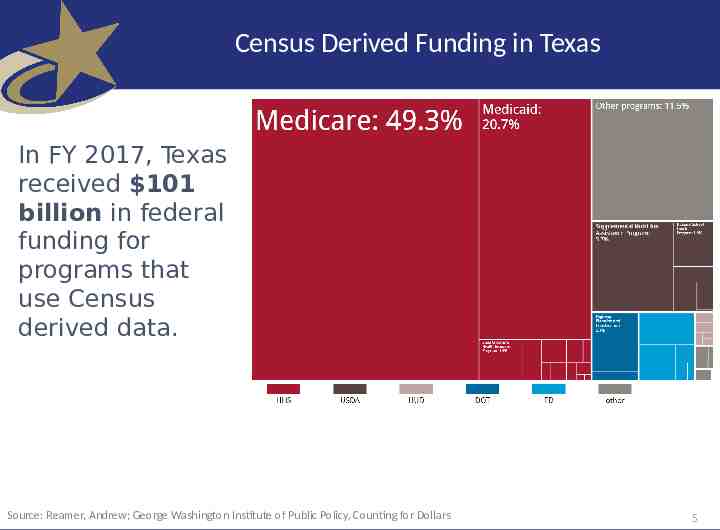
Census Derived Funding in Texas In FY 2017, Texas received 101 billion in federal funding for programs that use Census derived data. Source: Reamer, Andrew; George Washington Institute of Public Policy, Counting for Dollars 5
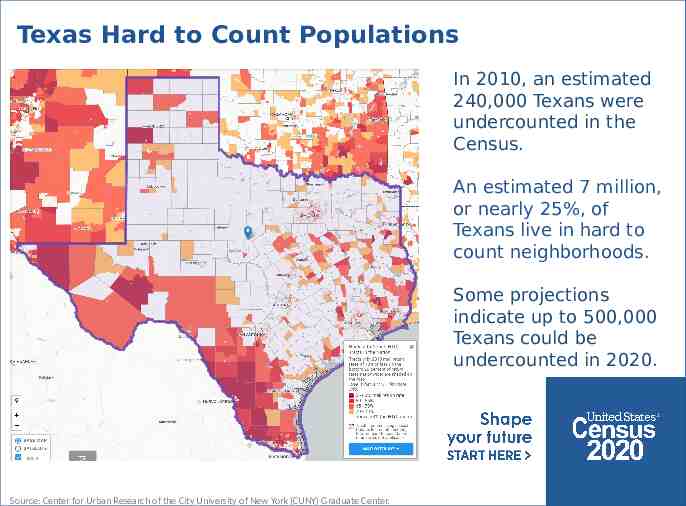
Texas Hard to Count Populations In 2010, an estimated 240,000 Texans were undercounted in the Census. An estimated 7 million, or nearly 25%, of Texans live in hard to count neighborhoods. Some projections indicate up to 500,000 Texans could be undercounted in 2020. Source: Center for Urban Research of the City University of New York (CUNY) Graduate Center.
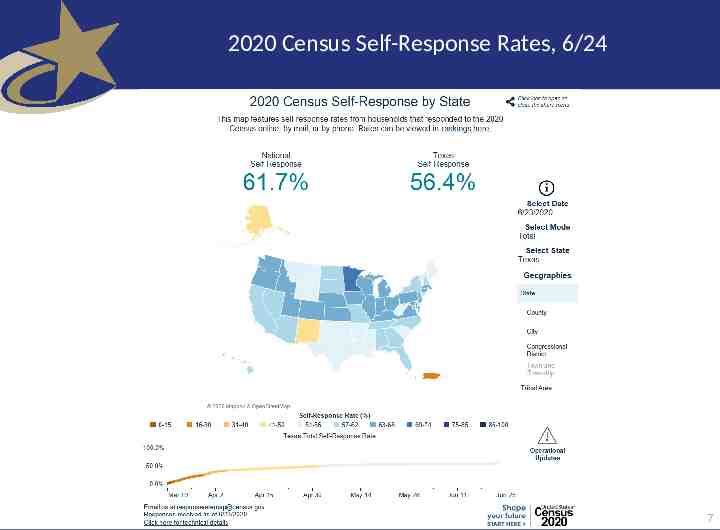
2020 Census Self-Response Rates, 6/24 7
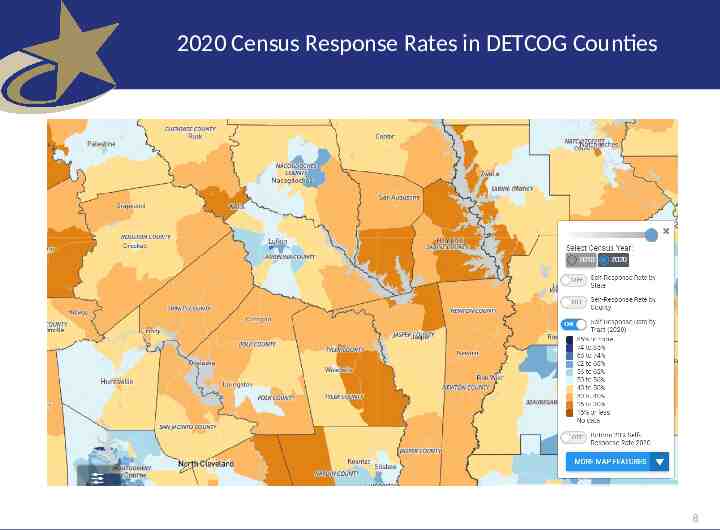
2020 Census Response Rates in DETCOG Counties 8
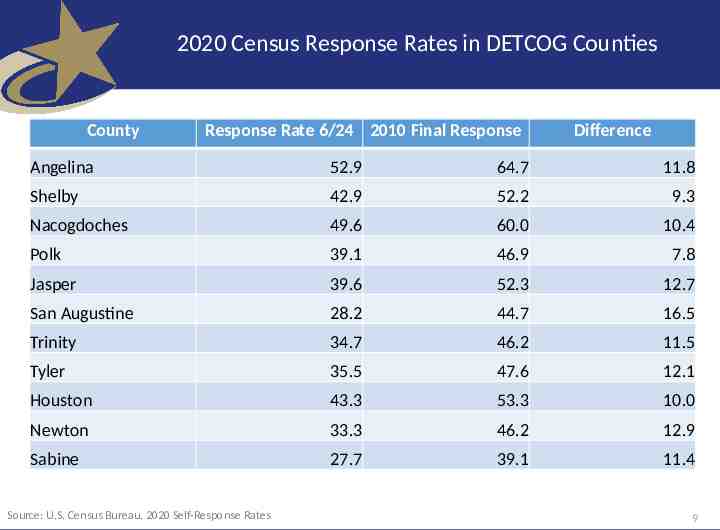
2020 Census Response Rates in DETCOG Counties County Response Rate 6/24 2010 Final Response Difference Angelina 52.9 64.7 11.8 Shelby 42.9 52.2 9.3 Nacogdoches 49.6 60.0 10.4 Polk 39.1 46.9 7.8 Jasper 39.6 52.3 12.7 San Augustine 28.2 44.7 16.5 Trinity 34.7 46.2 11.5 Tyler 35.5 47.6 12.1 Houston 43.3 53.3 10.0 Newton 33.3 46.2 12.9 Sabine 27.7 39.1 11.4 Source: U.S. Census Bureau, 2020 Self-Response Rates 9
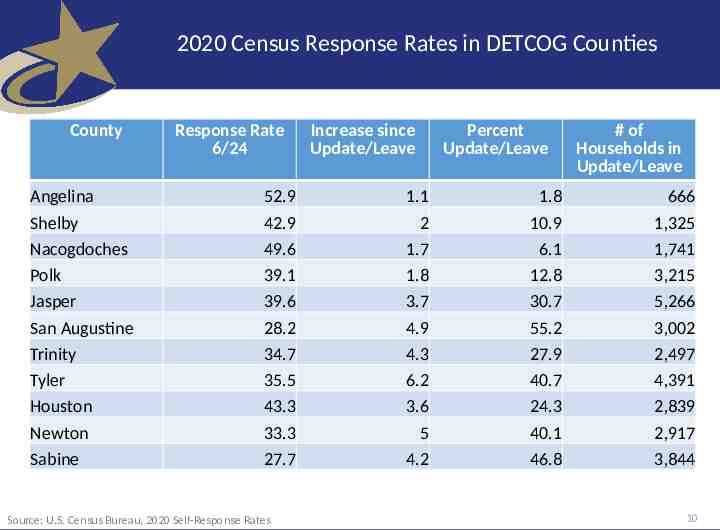
2020 Census Response Rates in DETCOG Counties County Angelina Shelby Nacogdoches Polk Jasper San Augustine Trinity Tyler Houston Newton Sabine Response Rate 6/24 52.9 42.9 49.6 39.1 39.6 28.2 34.7 35.5 43.3 33.3 27.7 Source: U.S. Census Bureau, 2020 Self-Response Rates Increase since Update/Leave 1.1 2 1.7 1.8 3.7 4.9 4.3 6.2 3.6 5 4.2 Percent Update/Leave 1.8 10.9 6.1 12.8 30.7 55.2 27.9 40.7 24.3 40.1 46.8 # of Households in Update/Leave 666 1,325 1,741 3,215 5,266 3,002 2,497 4,391 2,839 2,917 3,844 10
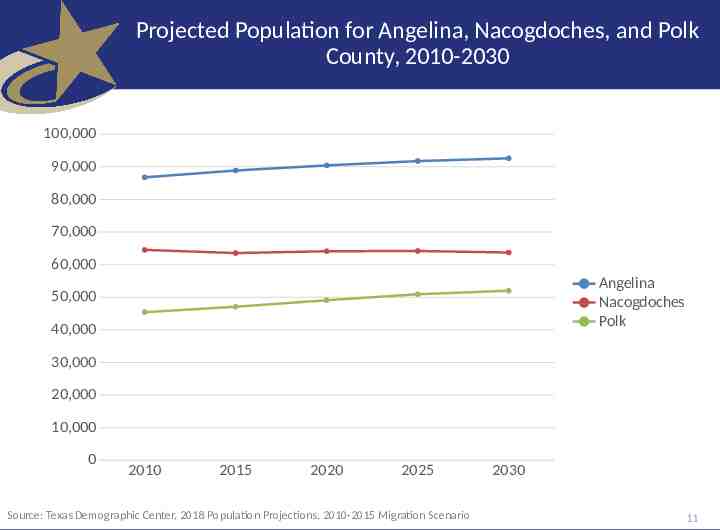
Projected Population for Angelina, Nacogdoches, and Polk County, 2010-2030 100,000 90,000 80,000 70,000 60,000 Angelina Nacogdoches Polk 50,000 40,000 30,000 20,000 10,000 0 2010 2015 2020 2025 Source: Texas Demographic Center, 2018 Population Projections, 2010-2015 Migration Scenario 2030 11
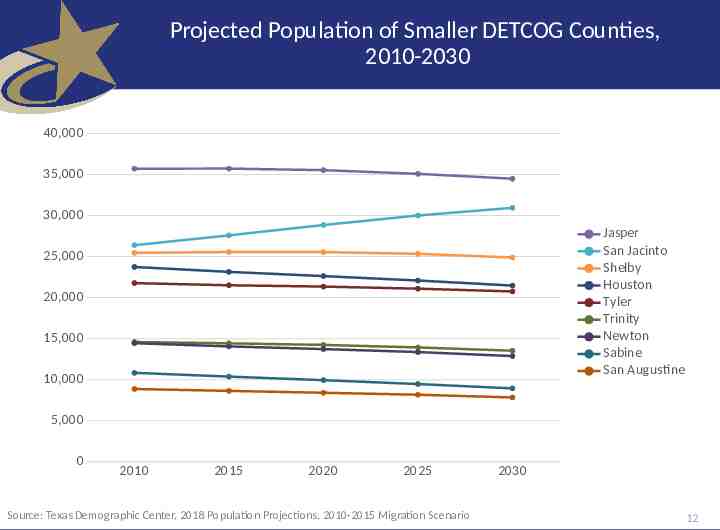
Projected Population of Smaller DETCOG Counties, 2010-2030 40,000 35,000 30,000 Jasper San Jacinto Shelby Houston Tyler Trinity Newton Sabine San Augustine 25,000 20,000 15,000 10,000 5,000 0 2010 2015 2020 2025 Source: Texas Demographic Center, 2018 Population Projections, 2010-2015 Migration Scenario 2030 12
Lila Valencia, Ph.D. (512) 936-3542 [email protected] demographics.texas.gov @TexasDemography 13