2014 State Superintendent’s Conference 2014-15: The Year of New
25 Slides3.97 MB
2014 State Superintendent’s Conference 2014-15: The Year of New Assessments Preparing for Assessment Transitions and the Implications for Accountability For updates & more details visit: http://oea/dpi.wi.gov
Today Context: accountability results summary Assessment overview Looking ahead Your turn
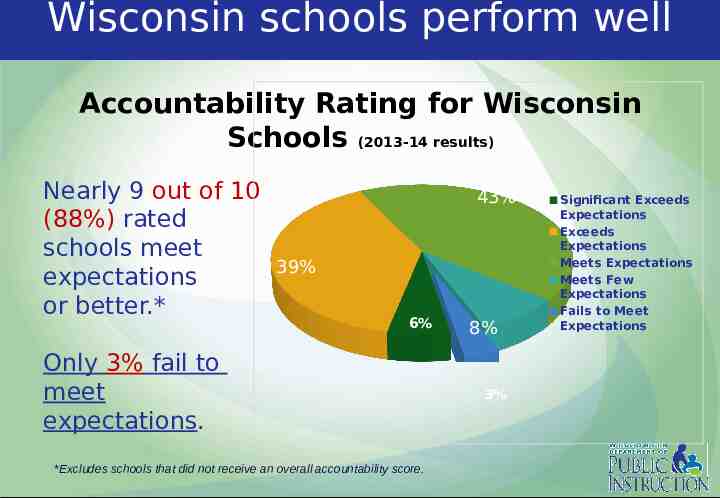
Wisconsin schools perform well Accountability Rating for Wisconsin Schools (2013-14 results) Nearly 9 out of 10 (88%) rated schools meet expectations or better.* 43% 39% 6% Only 3% fail to meet expectations. *Excludes schools that did not receive an overall accountability score. 8% 3% Significant Exceeds Expectations Exceeds Expectations Meets Expectations Meets Few Expectations Fails to Meet Expectations
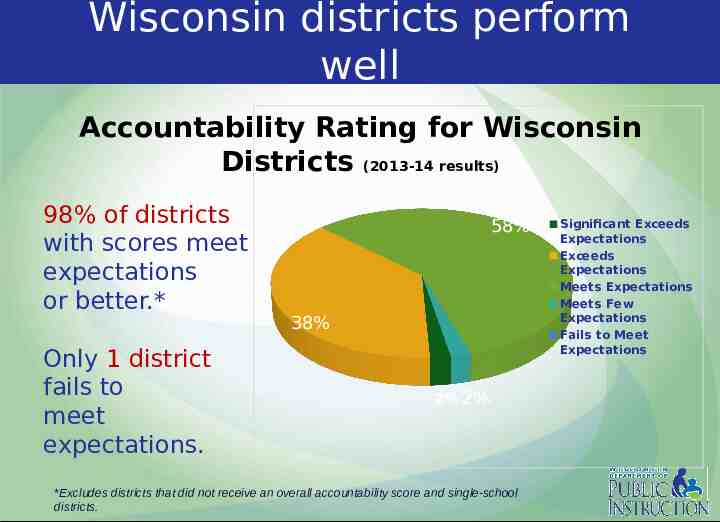
Wisconsin districts perform well Accountability Rating for Wisconsin Districts (2013-14 results) 98% of districts with scores meet expectations or better.* Only 1 district fails to meet expectations. 58% 38% 2% 2% *Excludes districts that did not receive an overall accountability score and single-school districts. Significant Exceeds Expectations Exceeds Expectations Meets Expectations Meets Few Expectations Fails to Meet Expectations
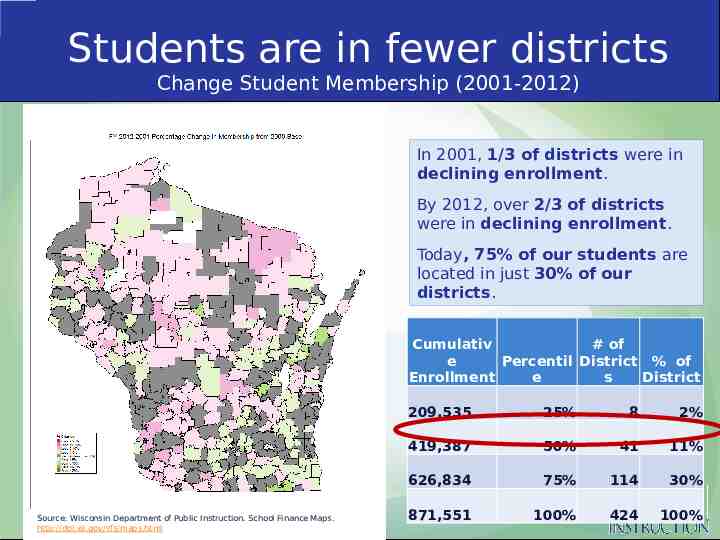
Students are in fewer districts Change Student Membership (2001-2012) In 2001, 1/3 of districts were in declining enrollment. Wisconsin FRL Rate Doubles 2001: 21% 2012: 43% By 2012, over 2/3 of districts were in declining enrollment. Today, 75% of our students are located in just 30% of our districts. Cumulativ # of e Percentil District % of Enrollment e s District Source: Wisconsin Department of Public Instruction. School Finance Maps. http://dpi.wi.gov/sfs/maps.html 209,535 25% 8 2% 419,387 50% 41 11% 626,834 75% 114 30% 871,551 100% 424 100%
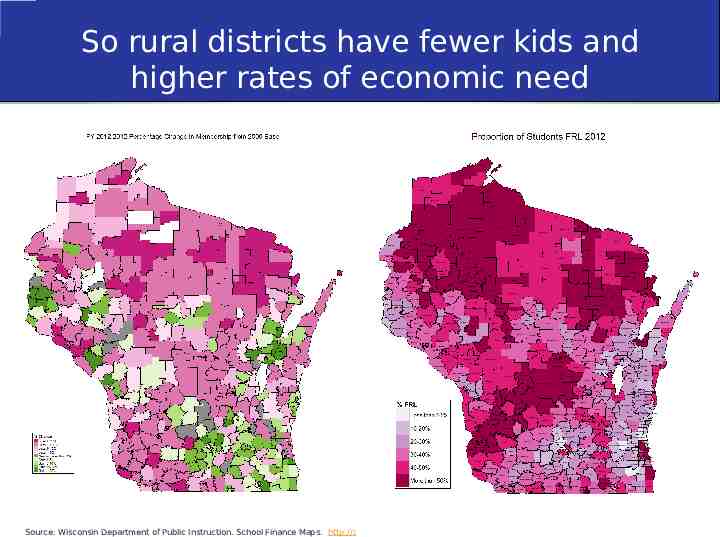
So rural districts have fewer kids and higher rates of economic need Wisconsin FRL Rate Doubles 2001: 21% 2012: 43% Source: Wisconsin Department of Public Instruction. School Finance Maps. http://dpi.wi.gov/sfs/maps.html
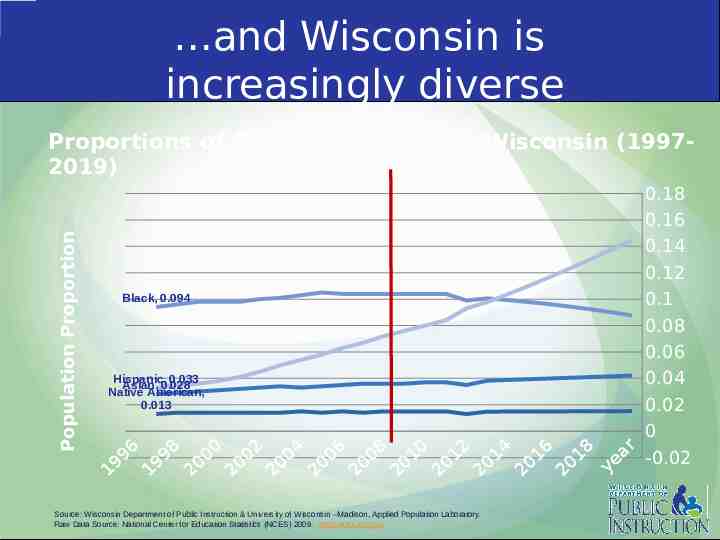
and Wisconsin is increasingly diverse Population Proportion Proportions of Students of Color in Wisconsin (19972019) 0.18 0.16 0.14 0.12 Black, 0.094 0.1 0.08 0.06 Hispanic, 0.033 0.04 Asian, 0.028 Native American, 0.013 0.02 0 r 6 98 00 02 04 06 08 10 12 14 16 18 a -0.02 9 e 9 9 0 0 0 0 0 0 0 0 0 0 y 1 1 2 2 2 2 2 2 2 2 2 2 Source: Wisconsin Department of Public Instruction & University of Wisconsin –Madison, Applied Population Laboratory. Raw Data Source: National Center for Education Statistics (NCES) 2009. http://nces.ed.gov/
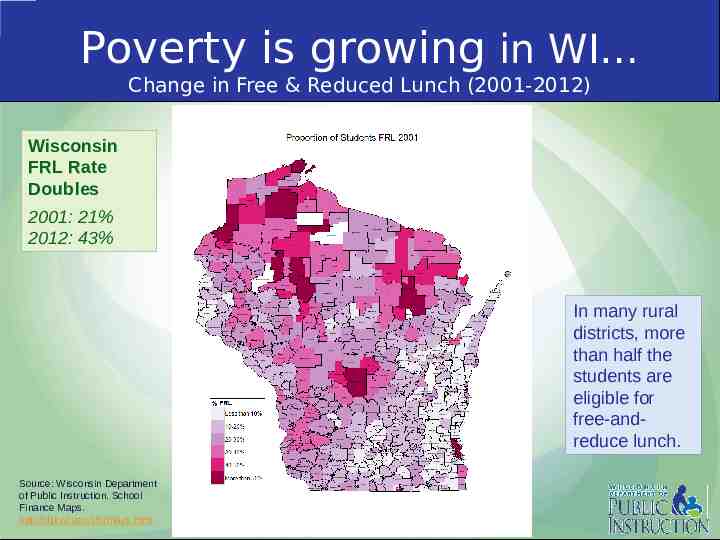
Poverty is growing in WI Change in Free & Reduced Lunch (2001-2012) Wisconsin FRL Rate Doubles 2001: 21% 2012: 43% In many rural districts, more than half the students are eligible for free-andreduce lunch. Source: Wisconsin Department of Public Instruction. School Finance Maps. http://dpi.wi.gov/sfs/maps.html
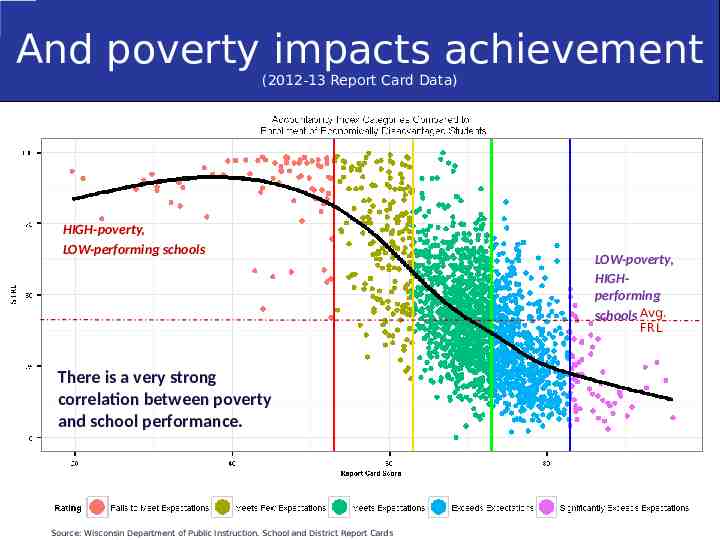
And poverty impacts achievement (2012-13 Report Card Data) HIGH-poverty, LOW-performing schools LOW-poverty, HIGHperforming schools Avg. FRL There is a very strong correlation between poverty and school performance. Source: Wisconsin Department of Public Instruction. School and District Report Cards
What does this all mean? Planning Ahead for Accountability in Wisconsin Tasks: Incorporate measures of college and career readiness – in a FAIR, VALID, and RELIABLE WAY Provide results that are FAIR, VALID, and RELIABLE during a major transition to new assessments Goals: Open communication and transparency Technical accuracy Continued improvement of the accountability system as a whole Connecting schools around promising practices and promising outcomes
Measuring College and Career Readiness (CCR) What measures come to mind? (To name a few ) WorkKeys CTE concentration Postsecondary enrollment Challenges Schools and districts vary greatly across the state How do we incorporate new measures in a way that reflects the import of CCR while accounting for local decisions and access/opportunity? and still measure the “same thing” in schools across the state
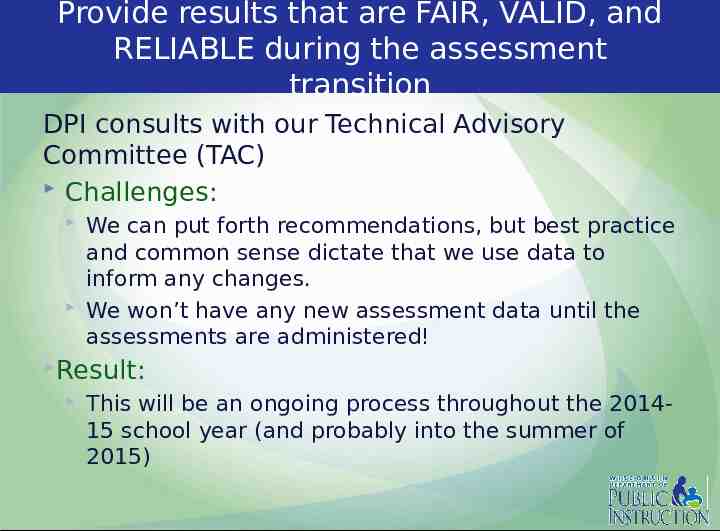
Provide results that are FAIR, VALID, and RELIABLE during the assessment transition DPI consults with our Technical Advisory Committee (TAC) Challenges: We can put forth recommendations, but best practice and common sense dictate that we use data to inform any changes. We won’t have any new assessment data until the assessments are administered! Result: This will be an ongoing process throughout the 201415 school year (and probably into the summer of 2015)
2014-15: THE YEAR OF NEW ASSESSMENTS
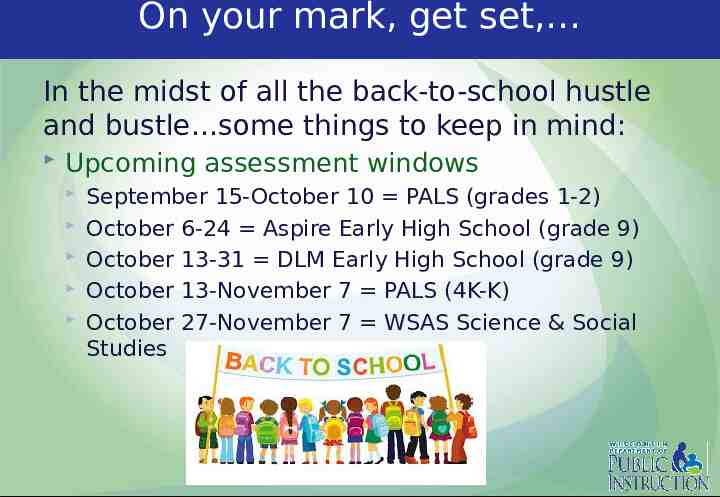
On your mark, get set, In the midst of all the back-to-school hustle and bustle some things to keep in mind: Upcoming assessment windows September 15-October 10 PALS (grades 1-2) October 6-24 Aspire Early High School (grade 9) October 13-31 DLM Early High School (grade 9) October 13-November 7 PALS (4K-K) October 27-November 7 WSAS Science & Social Studies
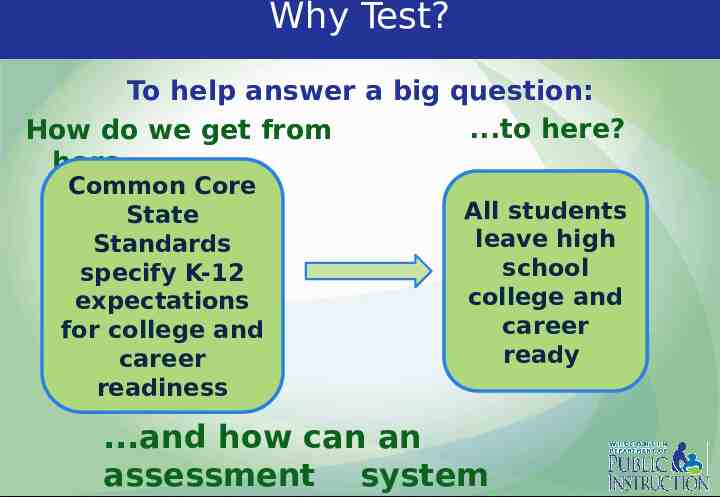
Why Test? To help answer a big question: .to here? How do we get from here. Common Core State Standards specify K-12 expectations for college and career readiness All students leave high school college and career ready .and how can an assessment system
A balanced assessment system is integral to this work The purpose of balanced assessment: To provide students, educators, parents and the public with a range of information about academic achievement, and to determine the best practices and policies that will result in improvements to student learning.
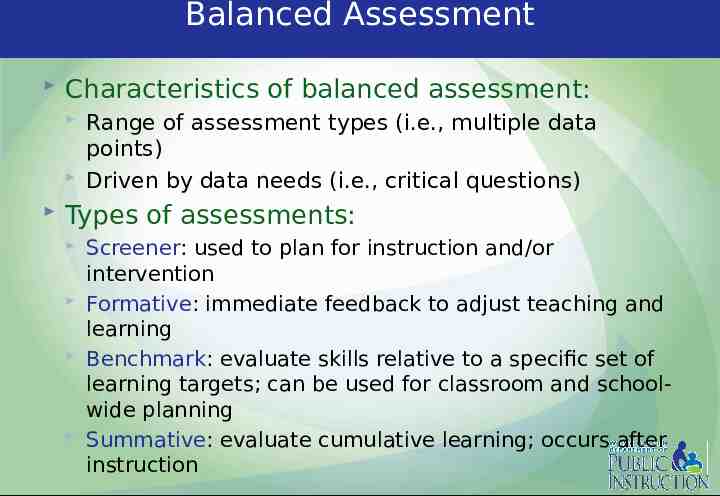
Balanced Assessment Characteristics of balanced assessment: Range of assessment types (i.e., multiple data points) Driven by data needs (i.e., critical questions) Types of assessments: Screener: used to plan for instruction and/or intervention Formative: immediate feedback to adjust teaching and learning Benchmark: evaluate skills relative to a specific set of learning targets; can be used for classroom and schoolwide planning Summative: evaluate cumulative learning; occurs after instruction
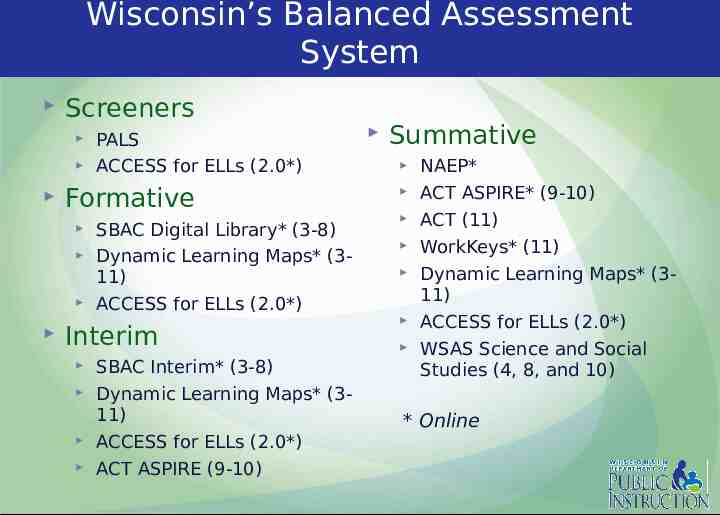
Wisconsin’s Balanced Assessment System Screeners Formative PALS ACCESS for ELLs (2.0*) SBAC Digital Library* (3-8) Dynamic Learning Maps* (311) ACCESS for ELLs (2.0*) Interim SBAC Interim* (3-8) Dynamic Learning Maps* (311) ACCESS for ELLs (2.0*) ACT ASPIRE (9-10) Summative NAEP* ACT ASPIRE* (9-10) ACT (11) WorkKeys* (11) Dynamic Learning Maps* (311) ACCESS for ELLs (2.0*) WSAS Science and Social Studies (4, 8, and 10) * Online
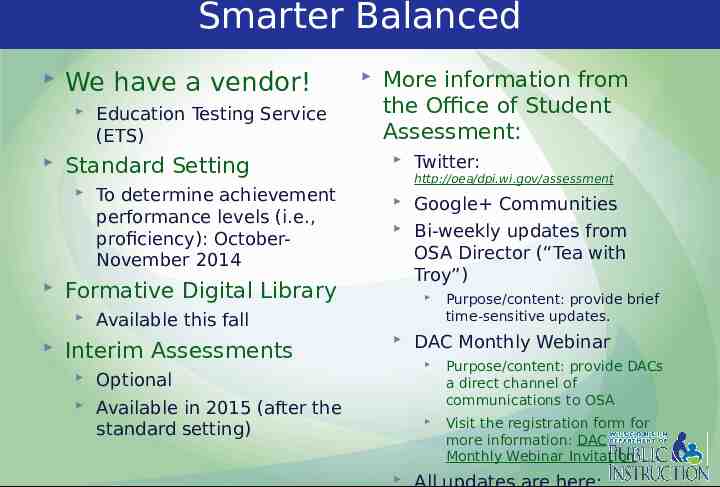
Smarter Balanced We have a vendor! Standard Setting To determine achievement performance levels (i.e., proficiency): OctoberNovember 2014 More information from the Office of Student Assessment: Twitter: http://oea/dpi.wi.gov/assessment Google Communities Bi-weekly updates from OSA Director (“Tea with Troy”) Formative Digital Library Education Testing Service (ETS) Available this fall Interim Assessments Optional Available in 2015 (after the standard setting) Purpose/content: provide brief time-sensitive updates. DAC Monthly Webinar Purpose/content: provide DACs a direct channel of communications to OSA Visit the registration form for more information: DAC Monthly Webinar Invitation
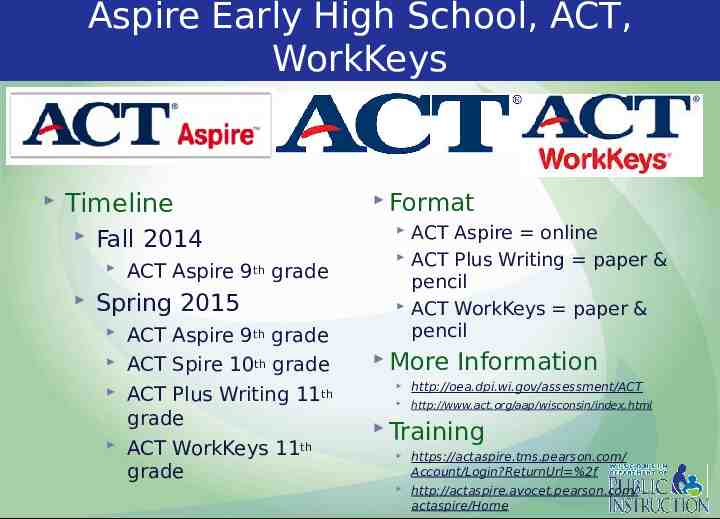
Aspire Early High School, ACT, WorkKeys Format Timeline Fall 2014 ACT Aspire 9 grade th Spring 2015 ACT Aspire 9th grade ACT Spire 10th grade ACT Plus Writing 11th grade ACT WorkKeys 11th grade ACT Aspire online ACT Plus Writing paper & pencil ACT WorkKeys paper & pencil More Information http://oea.dpi.wi.gov/assessment/ACT http://www.act.org/aap/wisconsin/index.html Training https://actaspire.tms.pearson.com/ Account/Login?ReturnUrl %2f http://actaspire.avocet.pearson.com/ actaspire/Home
2014-15 is just the start LOOKING AHEAD FOR ASSESSMENT & ACCOUNTABILITY
Looking ahead for assessment DAC support Single sign on Adjusting for issues which arise ACT Expansion and Online Peer Review ACCESS 2.0 Legislative support
Looking ahead for accountability ESEA Flexibility DPI will again apply for a waiver Opportunities: further integrate accountability and support collect more input on the system incorporate changes into accountability Possible State Legislation Could specify changes to report cards Using data to connect schools
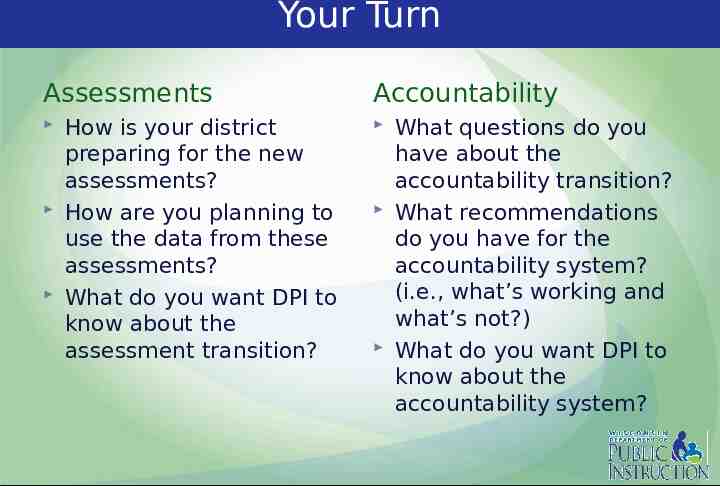
Your Turn Assessments How is your district preparing for the new assessments? How are you planning to use the data from these assessments? What do you want DPI to know about the assessment transition? Accountability What questions do you have about the accountability transition? What recommendations do you have for the accountability system? (i.e., what’s working and what’s not?) What do you want DPI to know about the accountability system?
THANK YOU! Troy Couillard, Director, Office of Student Assessment Laura Pinsonneault, Director, Office of Educational Accountability Reach us at 608-267-1072