1.040/1.401/ESD.018 Project Management Spring 2007 Lecture 14 Project

60 Slides734.50 KB
1.040/1.401/ESD.018 Project Management Spring 2007 Lecture 14 Project Monitoring Sam Labi and Fred Moavenzadeh Department of Civil and Environmental Engineering Massachusetts Institute of Technology
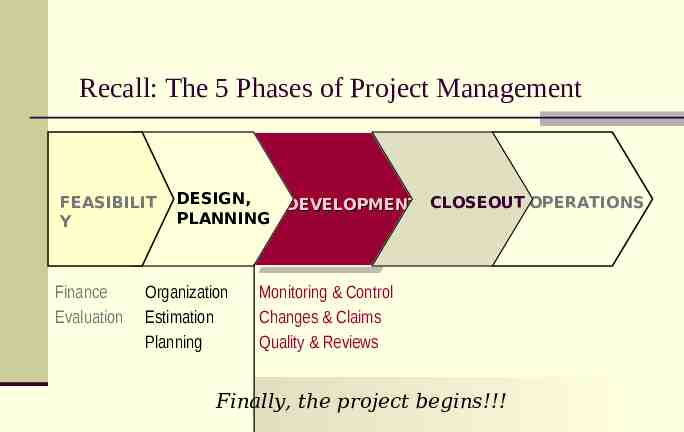
Recall: The 5 Phases of Project Management FEASIBILIT Y Finance Evaluation DESIGN, CLOSEOUT OPERATIONS DEVELOPMENTCLOSEOUT PLANNING Organization Estimation Planning Monitoring & Control Changes & Claims Quality & Reviews Finally, the project begins!!!
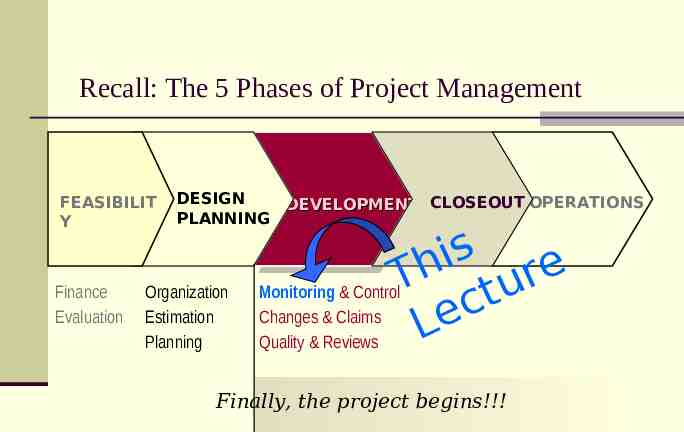
Recall: The 5 Phases of Project Management FEASIBILIT Y Finance Evaluation DESIGN CLOSEOUT OPERATIONS DEVELOPMENTCLOSEOUT PLANNING Organization Estimation Planning s i h e r T Monitoring & Control u t c Changes & Claims e L Quality & Reviews Finally, the project begins!!!
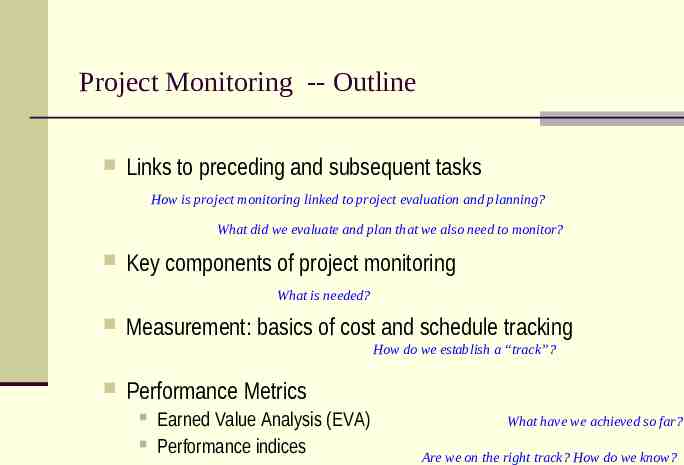
Project Monitoring -- Outline Links to preceding and subsequent tasks How is project monitoring linked to project evaluation and planning? What did we evaluate and plan that we also need to monitor? Key components of project monitoring What is needed? Measurement: basics of cost and schedule tracking How do we establish a “track”? Performance Metrics Earned Value Analysis (EVA) Performance indices What have we achieved so far? Are we on the right track? How do we know?
PART 1 Links between Project Monitoring and its Preceding or Succeeding Phases
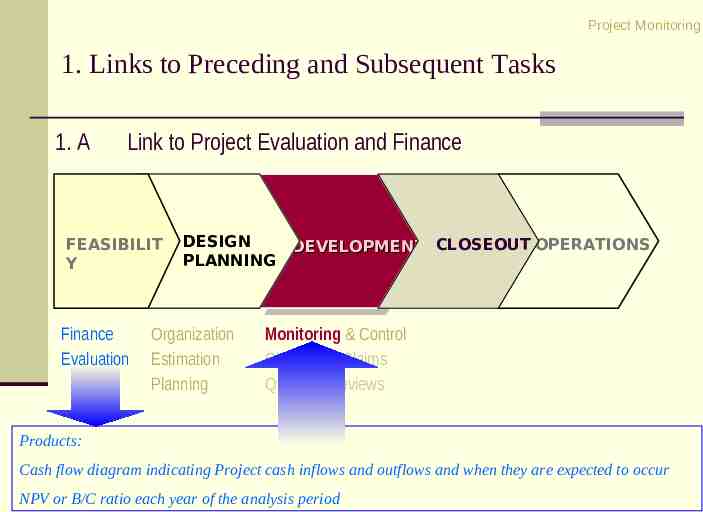
Project Monitoring 1. Links to Preceding and Subsequent Tasks 1. A Link to Project Evaluation and Finance CLOSEOUT FEASIBILIT Y Finance Evaluation DESIGN DEVELOPMENT CLOSEOUT OPERATIONS PLANNING Organization Estimation Planning Monitoring & Control Changes & Claims Quality & Reviews Products: Cash flow diagram indicating Project cash inflows and outflows and when they are expected to occur NPV or B/C ratio each year of the analysis period
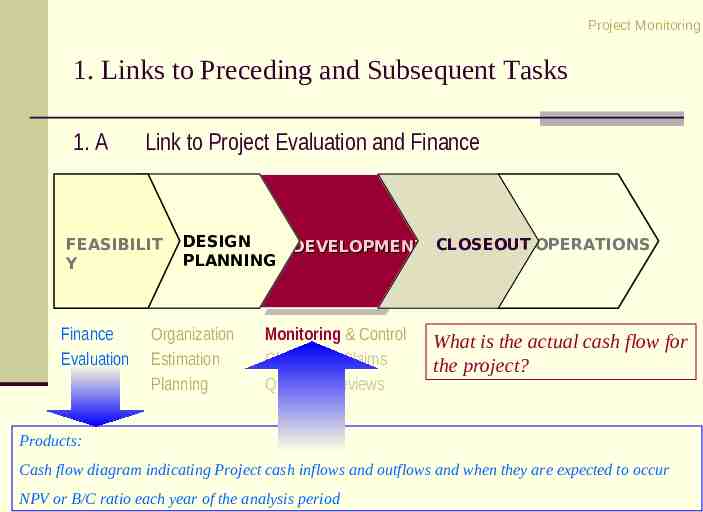
Project Monitoring 1. Links to Preceding and Subsequent Tasks 1. A Link to Project Evaluation and Finance CLOSEOUT FEASIBILIT Y Finance Evaluation DESIGN DEVELOPMENT CLOSEOUT OPERATIONS PLANNING Organization Estimation Planning Monitoring & Control Changes & Claims Quality & Reviews What is the actual cash flow for the project? Products: Cash flow diagram indicating Project cash inflows and outflows and when they are expected to occur NPV or B/C ratio each year of the analysis period
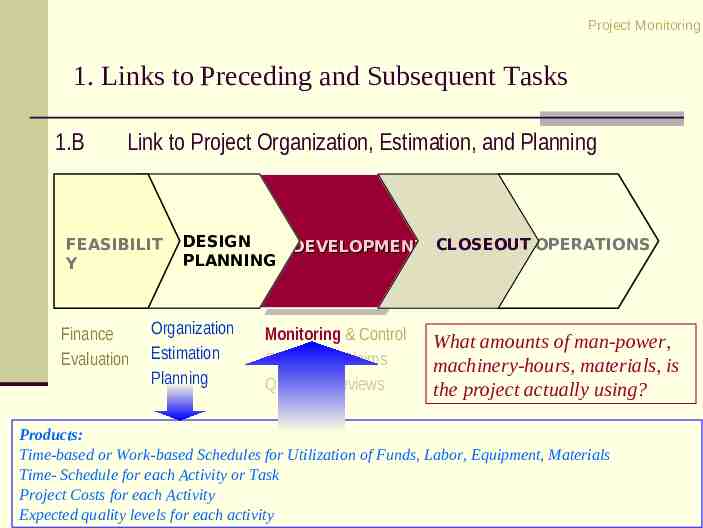
Project Monitoring 1. Links to Preceding and Subsequent Tasks 1.B Link to Project Organization, Estimation, and Planning CLOSEOUT FEASIBILIT Y Finance Evaluation DESIGN DEVELOPMENT CLOSEOUT OPERATIONS PLANNING Organization Estimation Planning Monitoring & Control Changes & Claims Quality & Reviews What amounts of man-power, machinery-hours, materials, is the project actually using? Products: Time-based or Work-based Schedules for Utilization of Funds, Labor, Equipment, Materials Time- Schedule for each Activity or Task Project Costs for each Activity Expected quality levels for each activity
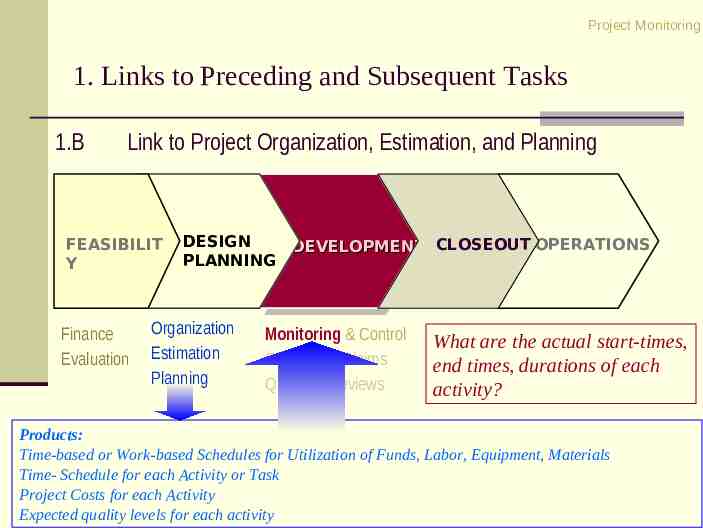
Project Monitoring 1. Links to Preceding and Subsequent Tasks 1.B Link to Project Organization, Estimation, and Planning CLOSEOUT FEASIBILIT Y Finance Evaluation DESIGN DEVELOPMENT CLOSEOUT OPERATIONS PLANNING Organization Estimation Planning Monitoring & Control Changes & Claims Quality & Reviews What are the actual start-times, end times, durations of each activity? Products: Time-based or Work-based Schedules for Utilization of Funds, Labor, Equipment, Materials Time- Schedule for each Activity or Task Project Costs for each Activity Expected quality levels for each activity
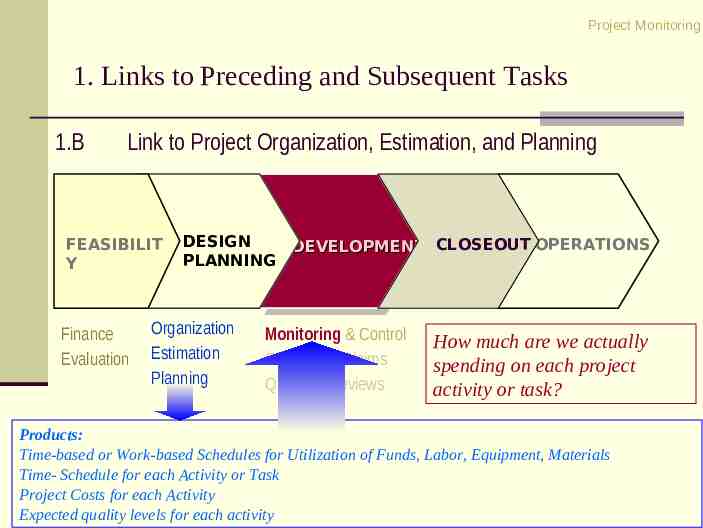
Project Monitoring 1. Links to Preceding and Subsequent Tasks 1.B Link to Project Organization, Estimation, and Planning CLOSEOUT FEASIBILIT Y Finance Evaluation DESIGN DEVELOPMENT CLOSEOUT OPERATIONS PLANNING Organization Estimation Planning Monitoring & Control Changes & Claims Quality & Reviews How much are we actually spending on each project activity or task? Products: Time-based or Work-based Schedules for Utilization of Funds, Labor, Equipment, Materials Time- Schedule for each Activity or Task Project Costs for each Activity Expected quality levels for each activity
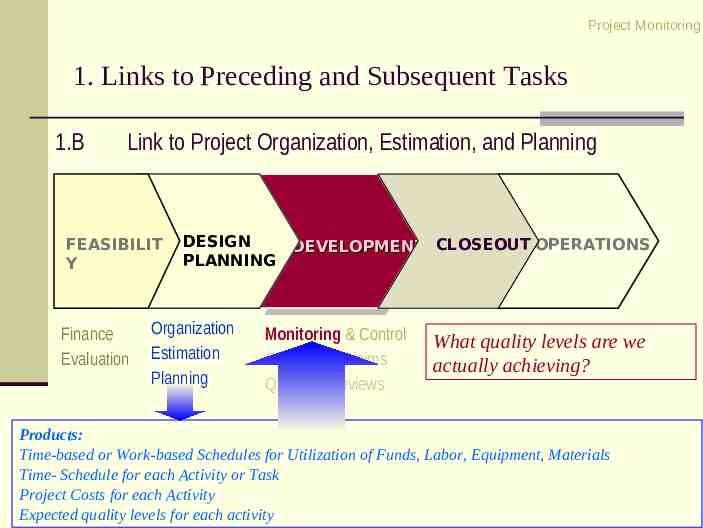
Project Monitoring 1. Links to Preceding and Subsequent Tasks 1.B Link to Project Organization, Estimation, and Planning CLOSEOUT FEASIBILIT Y Finance Evaluation DESIGN DEVELOPMENT CLOSEOUT OPERATIONS PLANNING Organization Estimation Planning Monitoring & Control Changes & Claims Quality & Reviews What quality levels are we actually achieving? Products: Time-based or Work-based Schedules for Utilization of Funds, Labor, Equipment, Materials Time- Schedule for each Activity or Task Project Costs for each Activity Expected quality levels for each activity
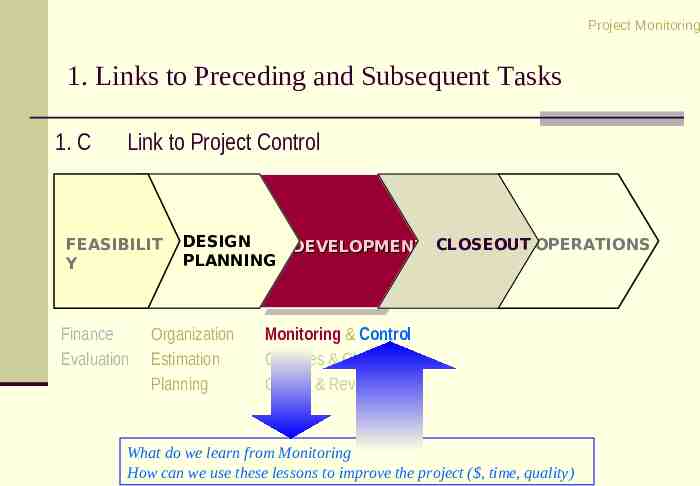
Project Monitoring 1. Links to Preceding and Subsequent Tasks 1. C Link to Project Control CLOSEOUT FEASIBILIT Y Finance Evaluation DESIGN DEVELOPMENT CLOSEOUT OPERATIONS PLANNING Organization Estimation Planning Monitoring & Control Changes & Claims Quality & Reviews What do we learn from Monitoring How can we use these lessons to improve the project ( , time, quality)
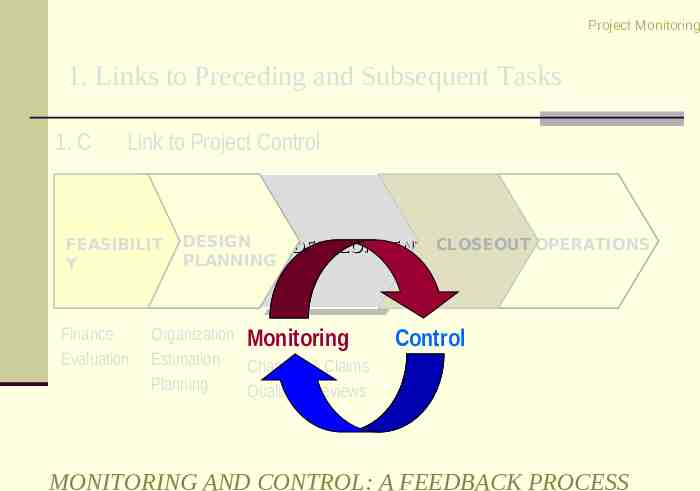
Project Monitoring 1. Links to Preceding and Subsequent Tasks 1. C Link to Project Control CLOSEOUT FEASIBILIT Y Finance Evaluation DESIGN DEVELOPMENT CLOSEOUT OPERATIONS PLANNING Organization Monitoring Estimation Changes & Claims Planning Quality & Reviews Control MONITORING AND CONTROL: A FEEDBACK PROCESS
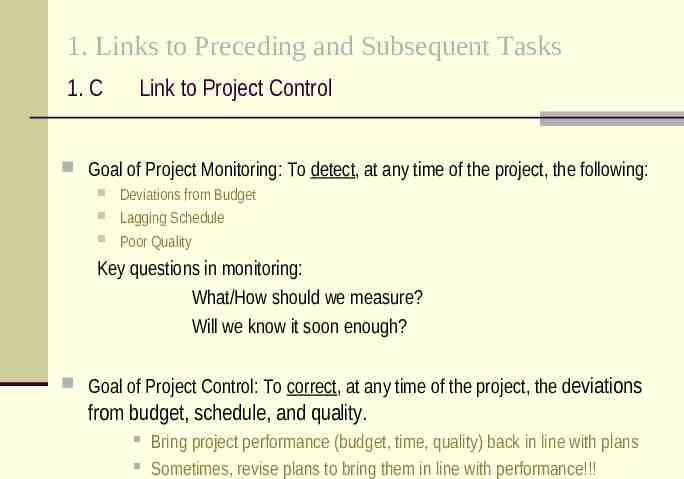
1. Links to Preceding and Subsequent Tasks 1. C Link to Project Control Goal of Project Monitoring: To detect, at any time of the project, the following: Deviations from Budget Lagging Schedule Poor Quality Key questions in monitoring: What/How should we measure? Will we know it soon enough? Goal of Project Control: To correct, at any time of the project, the deviations from budget, schedule, and quality. Bring project performance (budget, time, quality) back in line with plans Sometimes, revise plans to bring them in line with performance!!!
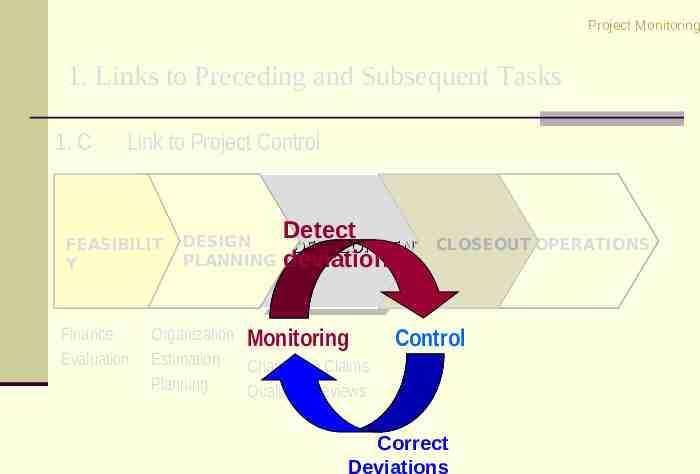
Project Monitoring 1. Links to Preceding and Subsequent Tasks 1. C Link to Project Control CLOSEOUT FEASIBILIT Y Finance Evaluation Detect DESIGN DEVELOPMENT CLOSEOUT OPERATIONS PLANNING deviations Organization Monitoring Estimation Changes & Claims Planning Quality & Reviews Control Correct Deviations
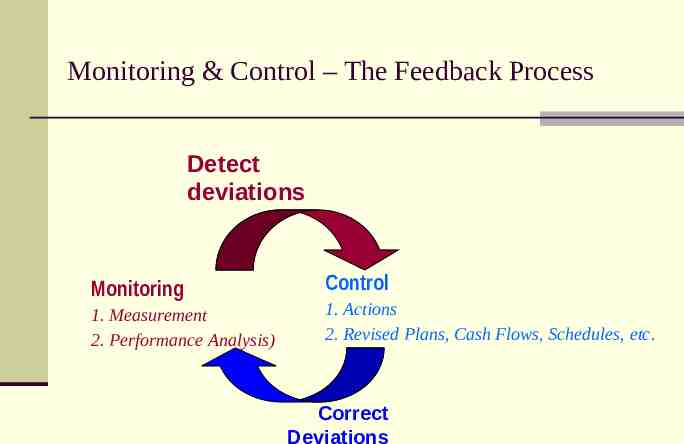
Monitoring & Control – The Feedback Process Detect deviations Monitoring 1. Measurement 2. Performance Analysis) Control 1. Actions 2. Revised Plans, Cash Flows, Schedules, etc. Correct Deviations
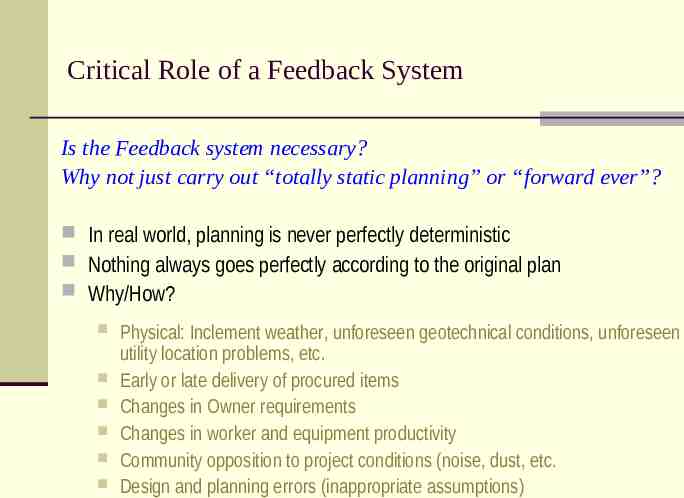
Critical Role of a Feedback System Is the Feedback system necessary? Why not just carry out “totally static planning” or “forward ever”? In real world, planning is never perfectly deterministic Nothing always goes perfectly according to the original plan Why/How? Physical: Inclement weather, unforeseen geotechnical conditions, unforeseen utility location problems, etc. Early or late delivery of procured items Changes in Owner requirements Changes in worker and equipment productivity Community opposition to project conditions (noise, dust, etc. Design and planning errors (inappropriate assumptions)
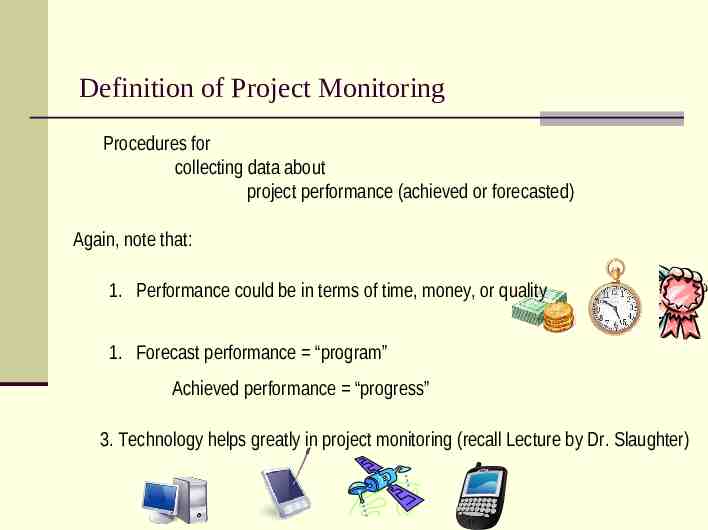
Definition of Project Monitoring Procedures for collecting data about project performance (achieved or forecasted) Again, note that: 1. Performance could be in terms of time, money, or quality 1. Forecast performance “program” Achieved performance “progress” 3. Technology helps greatly in project monitoring (recall Lecture by Dr. Slaughter)
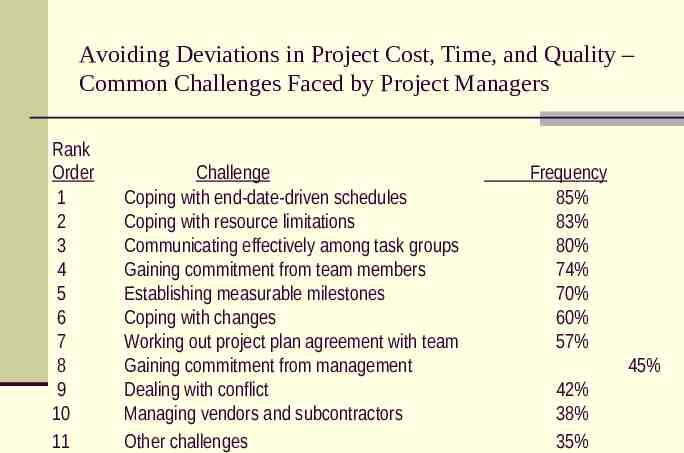
Avoiding Deviations in Project Cost, Time, and Quality – Common Challenges Faced by Project Managers Rank Order 1 2 3 4 5 6 7 8 9 10 11 Challenge Coping with end-date-driven schedules Coping with resource limitations Communicating effectively among task groups Gaining commitment from team members Establishing measurable milestones Coping with changes Working out project plan agreement with team Gaining commitment from management Dealing with conflict Managing vendors and subcontractors Other challenges Frequency 85% 83% 80% 74% 70% 60% 57% 45% 42% 38% 35%
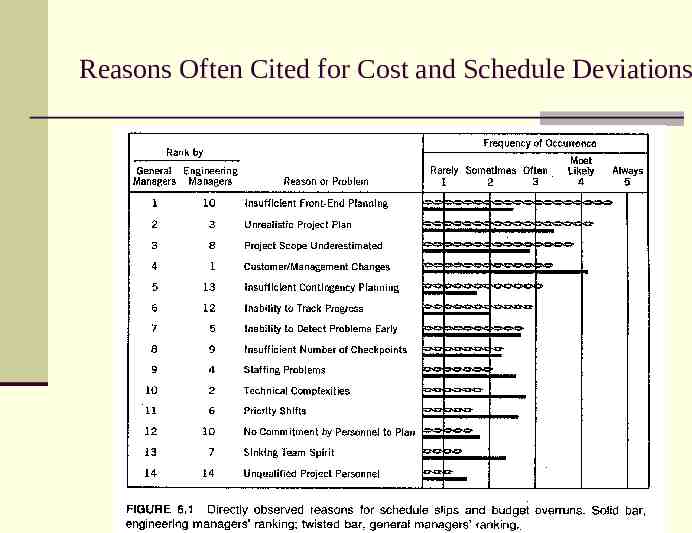
Reasons Often Cited for Cost and Schedule Deviations
PART 2 Key Components of Effective Monitoring
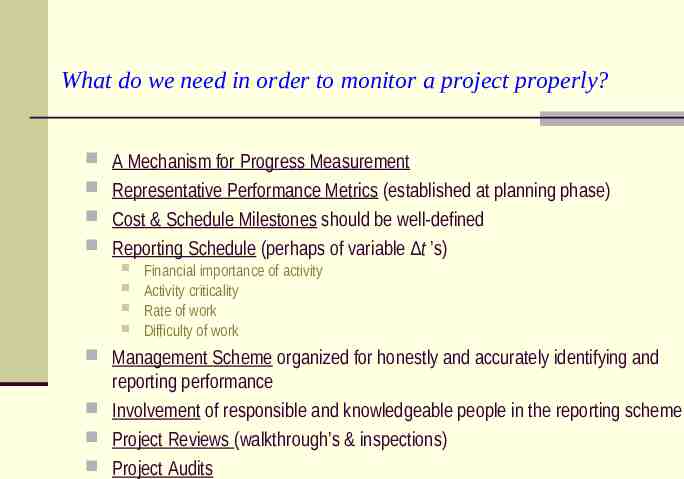
What do we need in order to monitor a project properly? A Mechanism for Progress Measurement Representative Performance Metrics (established at planning phase) Cost & Schedule Milestones should be well-defined Reporting Schedule (perhaps of variable Δt ’s) Financial importance of activity Activity criticality Rate of work Difficulty of work Management Scheme organized for honestly and accurately identifying and reporting performance Involvement of responsible and knowledgeable people in the reporting scheme Project Reviews (walkthrough’s & inspections) Project Audits
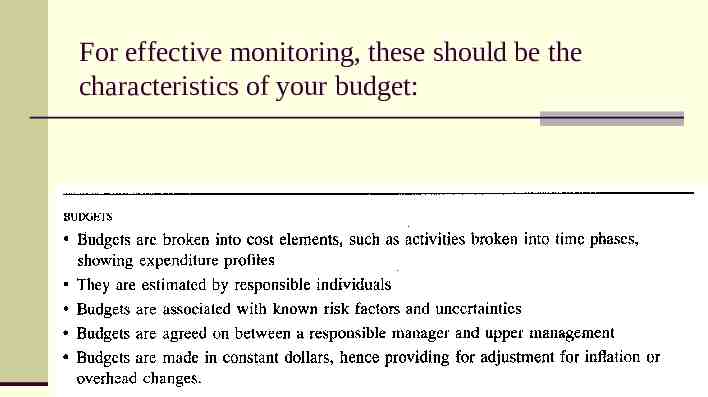
For effective monitoring, these should be the characteristics of your budget:
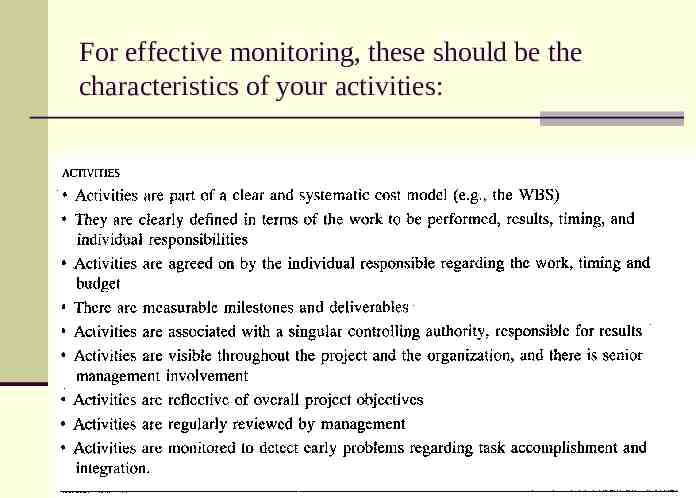
For effective monitoring, these should be the characteristics of your activities:
PART 3 Measurement of Project Progress: The basics of cost and schedule tracking
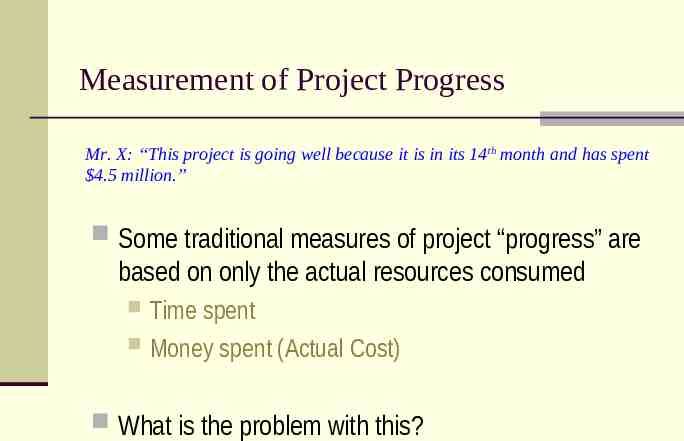
Measurement of Project Progress Mr. X: “This project is going well because it is in its 14th month and has spent 4.5 million.” Some traditional measures of project “progress” are based on only the actual resources consumed Time spent Money spent (Actual Cost) What is the problem with this?
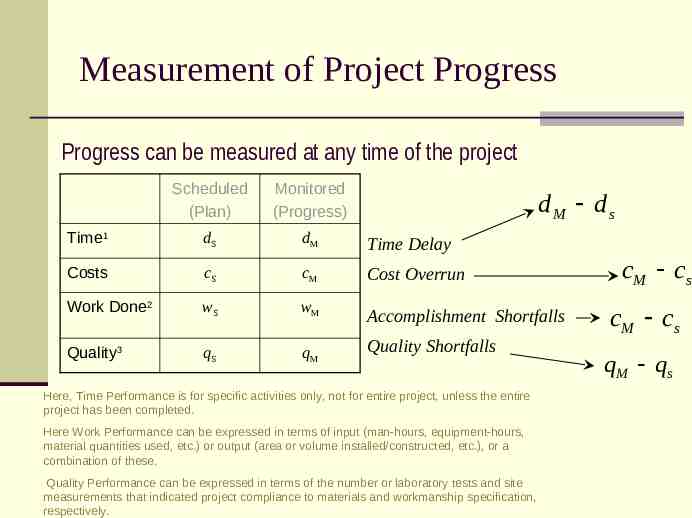
Measurement of Project Progress Progress can be measured at any time of the project Scheduled (Plan) Monitored (Progress) Time1 dS dM Time Delay Costs cS cM Cost Overrun Work Done2 wS wM Accomplishment Shortfalls Quality3 qS qM dM ds Quality Shortfalls Here, Time Performance is for specific activities only, not for entire project, unless the entire project has been completed. Here Work Performance can be expressed in terms of input (man-hours, equipment-hours, material quantities used, etc.) or output (area or volume installed/constructed, etc.), or a combination of these. Quality Performance can be expressed in terms of the number or laboratory tests and site measurements that indicated project compliance to materials and workmanship specification, respectively. cM cs cM cs qM qs
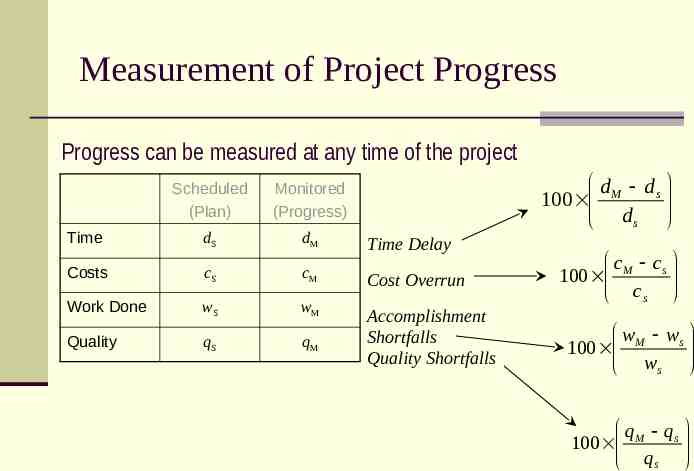
Measurement of Project Progress Progress can be measured at any time of the project dM ds 100 ds Scheduled (Plan) Monitored (Progress) Time dS dM Costs cS cM Cost Overrun Work Done wS wM Quality qS qM Accomplishment Shortfalls Quality Shortfalls Time Delay c cs 100 M cs w ws 100 M ws qM qs 100 qs
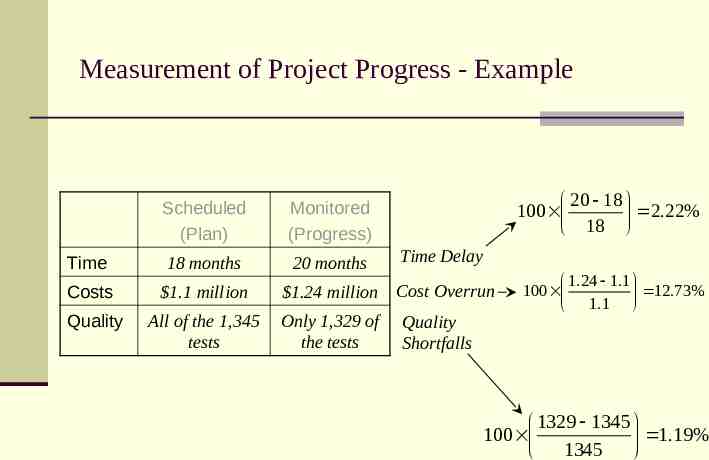
Measurement of Project Progress - Example 20 18 100 2.22% 18 Scheduled (Plan) Monitored (Progress) Time 18 months 20 months Time Delay Costs 1.1 million 1.24 million Cost Overrun Quality All of the 1,345 tests Only 1,329 of the tests Quality Shortfalls 1.24 1.1 100 12.73% 1.1 1329 1345 100 1.19% 1345
Some Terminology Deviation in cost/expenditure Cost overrun or excess expenditure Cost underrun Deviation in time Time Delay or Schedule Slip Deviation in quality – Workmanship Quality Lapses Workmanship/material/product Quality Lapses Workmanship/material/product Quality Compliance
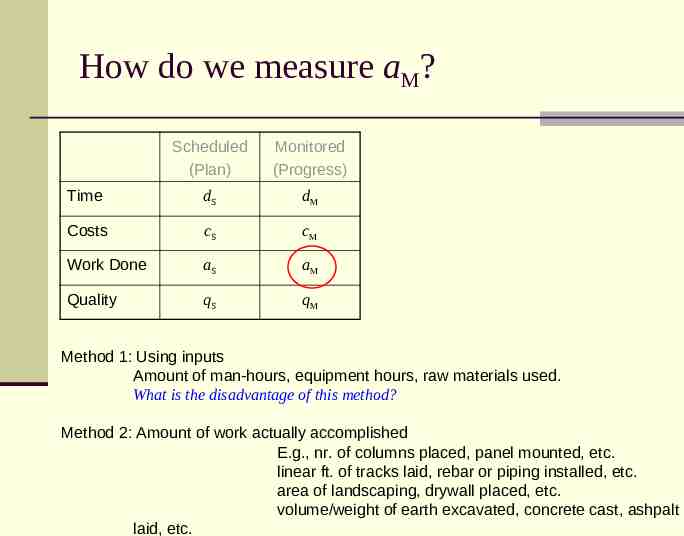
How do we measure aM? Scheduled (Plan) Monitored (Progress) Time dS dM Costs cS cM Work Done aS aM Quality qS qM Method 1: Using inputs Amount of man-hours, equipment hours, raw materials used. What is the disadvantage of this method? Method 2: Amount of work actually accomplished E.g., nr. of columns placed, panel mounted, etc. linear ft. of tracks laid, rebar or piping installed, etc. area of landscaping, drywall placed, etc. volume/weight of earth excavated, concrete cast, ashpalt laid, etc.
How do we collect the data for measuring aM? Foremen/superintendents note work inputs and accomplishments on timesheets (or PDAs) Identify appropriate cost categories associated to each work activity Enter quantities in Quantities Book Enter worked hours in Timesheets - Hours worked can be obtained from project’s payroll clerk
How frequently do we monitor? Hourly? Daily? Weekly? Bi-weekly? Monthly? Quarterly? Yearly? etc. Monitoring Frequency Depends On Size/Duration of the project Practicality What performance measure are we monitoring? Its importance What detail of performance is needed? (Granularity) Financial cost of what is being monitored Criticality of the activity to be monitored Familiarity of the monitoring procedure Cost of monitoring and Resources available for monitoring
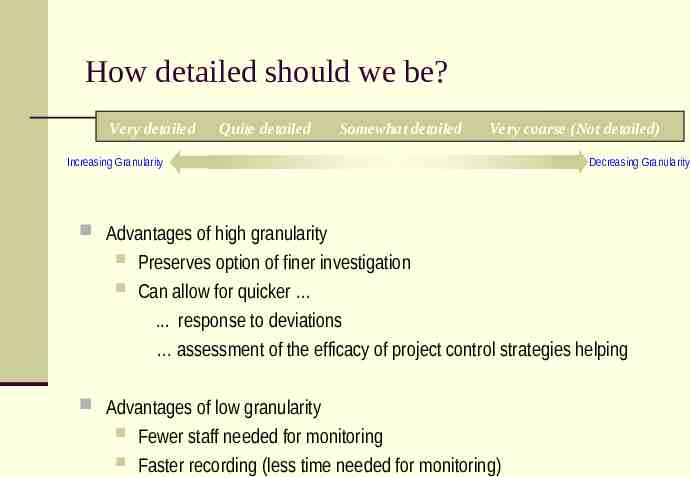
How detailed should we be? Very detailed Quite detailed Somewhat detailed Very coarse (Not detailed) Increasing Granularity Decreasing Granularity Advantages of high granularity Preserves option of finer investigation Can allow for quicker . response to deviations assessment of the efficacy of project control strategies helping Advantages of low granularity Fewer staff needed for monitoring Faster recording (less time needed for monitoring)
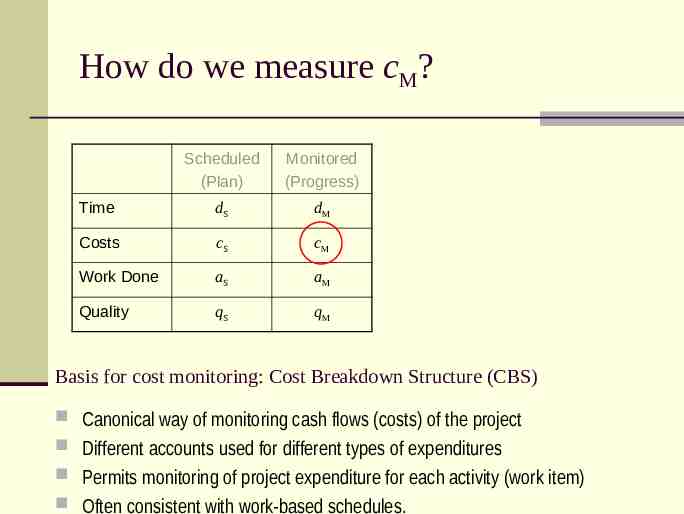
How do we measure cM? Scheduled (Plan) Monitored (Progress) Time dS dM Costs cS cM Work Done aS aM Quality qS qM Basis for cost monitoring: Cost Breakdown Structure (CBS) Canonical way of monitoring cash flows (costs) of the project Different accounts used for different types of expenditures Permits monitoring of project expenditure for each activity (work item) Often consistent with work-based schedules.
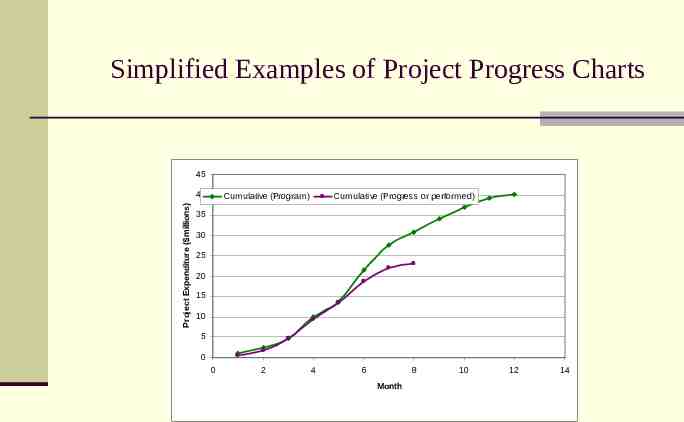
Simplified Examples of Project Progress Charts 45 Project Expenditure ( millions) 40 Cumulative (Program) Cumulative (Progress or performed) 35 30 25 20 15 10 5 0 0 2 4 6 8 Month 10 12 14
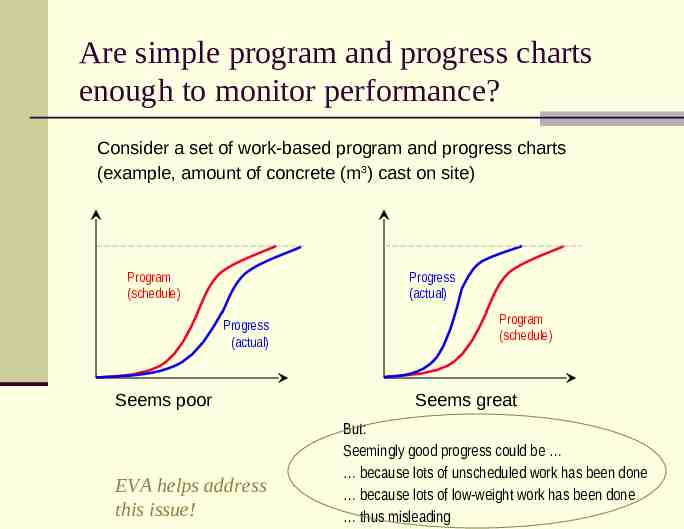
Are simple program and progress charts enough to monitor performance? Consider a set of work-based program and progress charts (example, amount of concrete (m3) cast on site) Program (schedule) Progress (actual) Progress (actual) Seems poor EVA helps address this issue! Program (schedule) Seems great But: Seemingly good progress could be because lots of unscheduled work has been done because lots of low-weight work has been done thus misleading
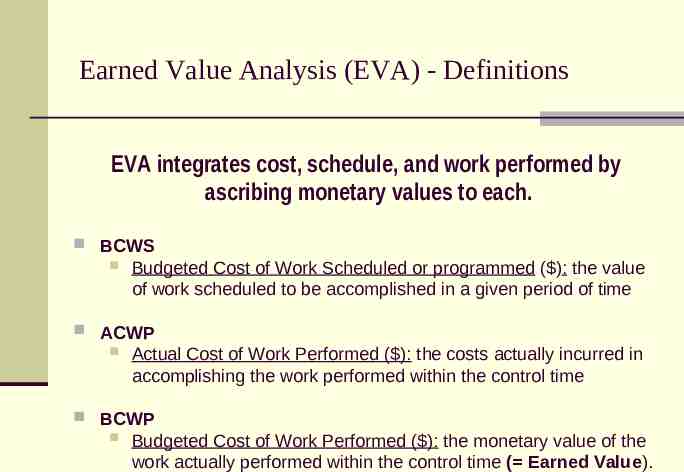
Earned Value Analysis (EVA) - Definitions EVA integrates cost, schedule, and work performed by ascribing monetary values to each. BCWS Budgeted Cost of Work Scheduled or programmed ( ): the value of work scheduled to be accomplished in a given period of time ACWP Actual Cost of Work Performed ( ): the costs actually incurred in accomplishing the work performed within the control time BCWP Budgeted Cost of Work Performed ( ): the monetary value of the work actually performed within the control time ( Earned Value).
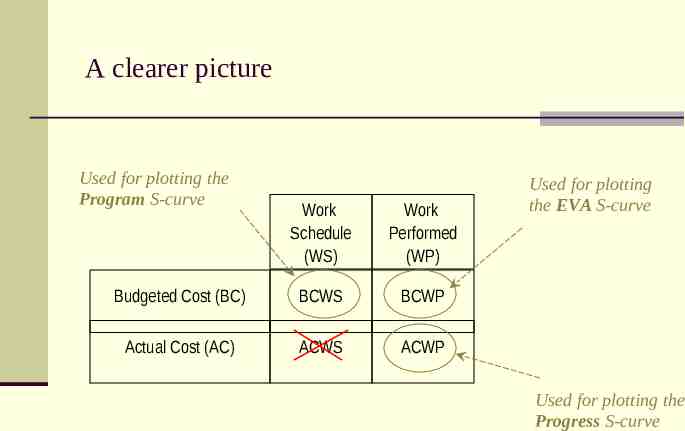
A clearer picture Used for plotting the Program S-curve Work Schedule (WS) Work Performed (WP) Budgeted Cost (BC) BCWS BCWP Actual Cost (AC) ACWS ACWP Used for plotting the EVA S-curve Used for plotting the Progress S-curve
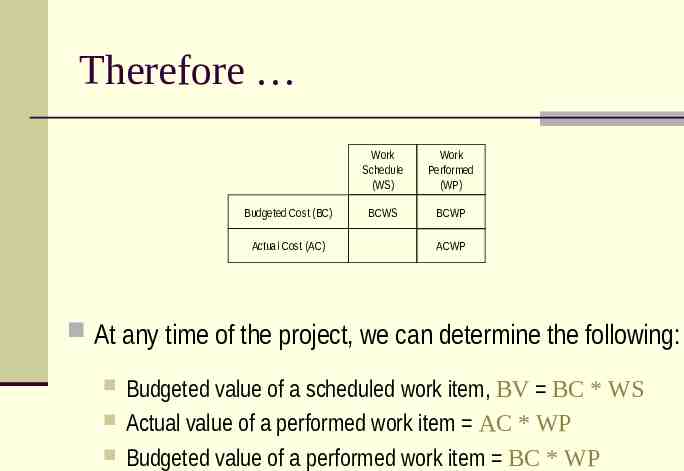
Therefore Budgeted Cost (BC) Actual Cost (AC) Work Schedule (WS) Work Performed (WP) BCWS BCWP ACWP At any time of the project, we can determine the following: Budgeted value of a scheduled work item, BV BC * WS Actual value of a performed work item AC * WP Budgeted value of a performed work item BC * WP
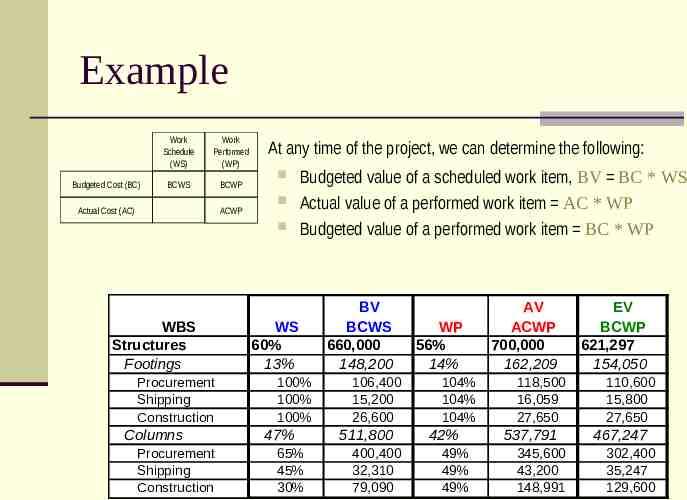
Example Budgeted Cost (BC) Work Schedule (WS) Work Performed (WP) BCWS BCWP Actual Cost (AC) ACWP At any time of the project, we can determine the following: WBS Structures Footings Procurement Shipping Construction Columns Procurement Shipping Construction Budgeted value of a scheduled work item, BV BC * WS Actual value of a performed work item AC * WP Budgeted value of a performed work item BC * WP WS 60% 13% 100% 100% 100% 47% 65% 45% 30% BV BCWS 660,000 148,200 106,400 15,200 26,600 511,800 400,400 32,310 79,090 WP 56% 14% 104% 104% 104% 42% 49% 49% 49% AV ACWP 700,000 162,209 118,500 16,059 27,650 537,791 345,600 43,200 148,991 EV BCWP 621,297 154,050 110,600 15,800 27,650 467,247 302,400 35,247 129,600 BV-A -40,000 -14,00 -12,1 -859 -1,05 -25,99 54,8 -10,8 -69,9
PART 4 Performance Metrics 1.Performance metrics based on Earned Value Analysis (EVA) 2. Other performance indices
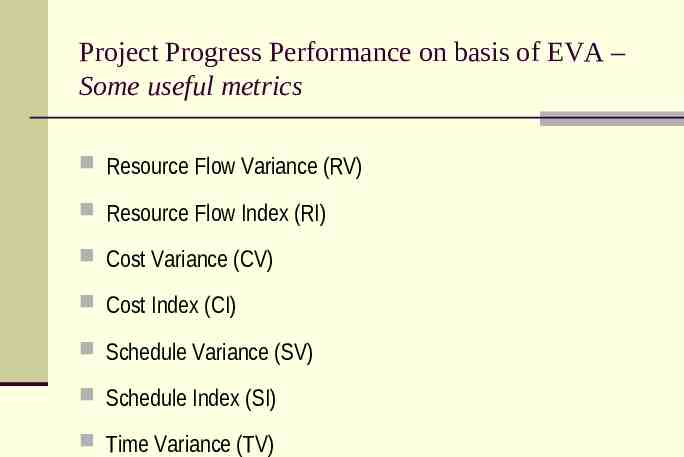
Project Progress Performance on basis of EVA – Some useful metrics Resource Flow Variance (RV) Resource Flow Index (RI) Cost Variance (CV) Cost Index (CI) Schedule Variance (SV) Schedule Index (SI) Time Variance (TV)
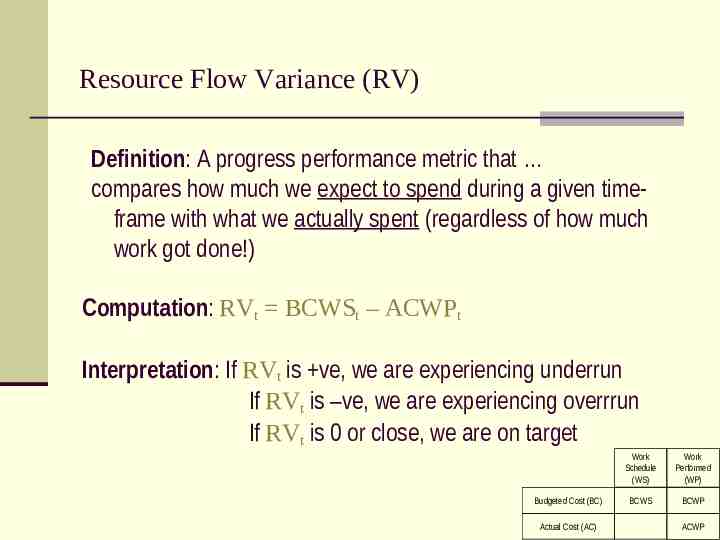
Resource Flow Variance (RV) Definition: A progress performance metric that compares how much we expect to spend during a given timeframe with what we actually spent (regardless of how much work got done!) Computation: RVt BCWSt – ACWPt Interpretation: If RVt is ve, we are experiencing underrun If RVt is –ve, we are experiencing overrrun If RVt is 0 or close, we are on target Budgeted Cost (BC) Actual Cost (AC) Work Schedule (WS) Work Performed (WP) BCWS BCWP ACWP
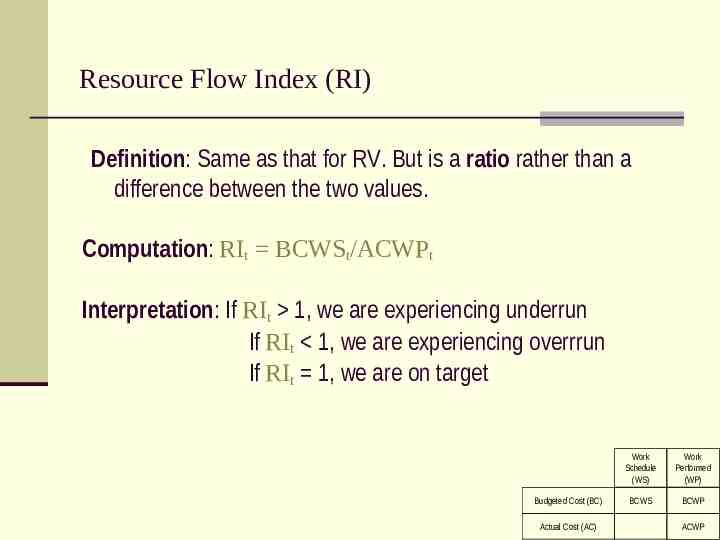
Resource Flow Index (RI) Definition: Same as that for RV. But is a ratio rather than a difference between the two values. Computation: RIt BCWSt/ACWPt Interpretation: If RIt 1, we are experiencing underrun If RIt 1, we are experiencing overrrun If RIt 1, we are on target Budgeted Cost (BC) Actual Cost (AC) Work Schedule (WS) Work Performed (WP) BCWS BCWP ACWP
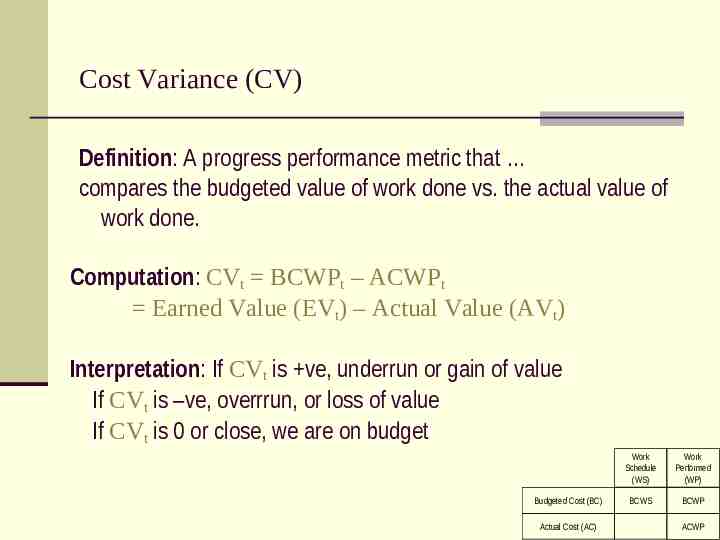
Cost Variance (CV) Definition: A progress performance metric that compares the budgeted value of work done vs. the actual value of work done. Computation: CVt BCWPt – ACWPt Earned Value (EVt) – Actual Value (AVt) Interpretation: If CVt is ve, underrun or gain of value If CVt is –ve, overrrun, or loss of value If CVt is 0 or close, we are on budget Budgeted Cost (BC) Actual Cost (AC) Work Schedule (WS) Work Performed (WP) BCWS BCWP ACWP
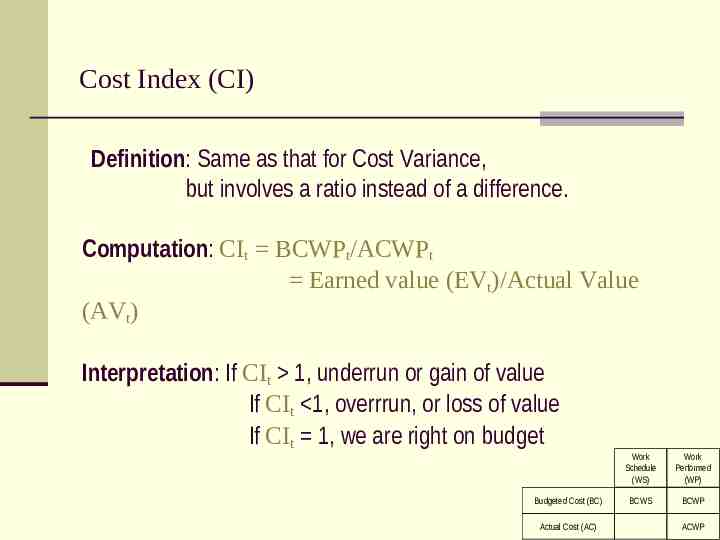
Cost Index (CI) Definition: Same as that for Cost Variance, but involves a ratio instead of a difference. Computation: CIt BCWPt/ACWPt Earned value (EVt)/Actual Value (AVt) Interpretation: If CIt 1, underrun or gain of value If CIt 1, overrrun, or loss of value If CIt 1, we are right on budget Budgeted Cost (BC) Actual Cost (AC) Work Schedule (WS) Work Performed (WP) BCWS BCWP ACWP
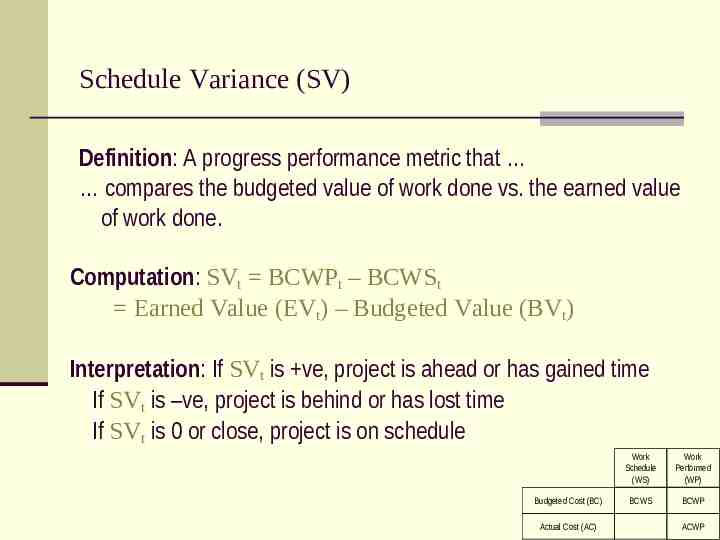
Schedule Variance (SV) Definition: A progress performance metric that compares the budgeted value of work done vs. the earned value of work done. Computation: SVt BCWPt – BCWSt Earned Value (EVt) – Budgeted Value (BVt) Interpretation: If SVt is ve, project is ahead or has gained time If SVt is –ve, project is behind or has lost time If SVt is 0 or close, project is on schedule Budgeted Cost (BC) Actual Cost (AC) Work Schedule (WS) Work Performed (WP) BCWS BCWP ACWP
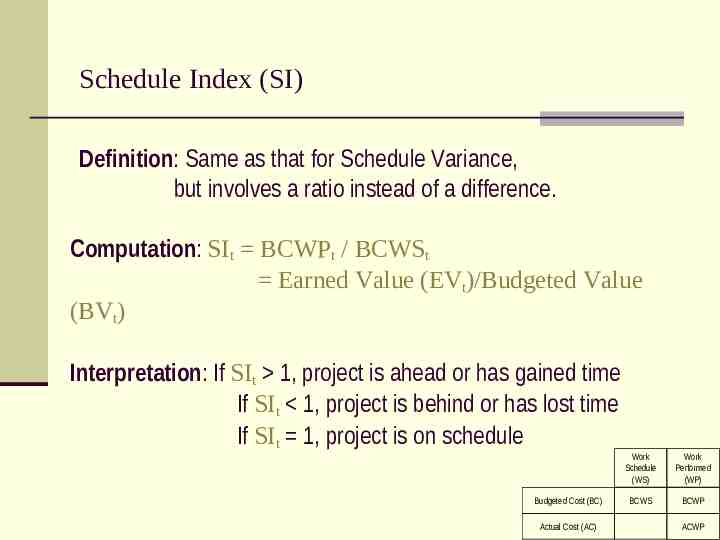
Schedule Index (SI) Definition: Same as that for Schedule Variance, but involves a ratio instead of a difference. Computation: SIt BCWPt / BCWSt Earned Value (EVt)/Budgeted Value (BVt) Interpretation: If SIt 1, project is ahead or has gained time If SIt 1, project is behind or has lost time If SIt 1, project is on schedule Budgeted Cost (BC) Actual Cost (AC) Work Schedule (WS) Work Performed (WP) BCWS BCWP ACWP
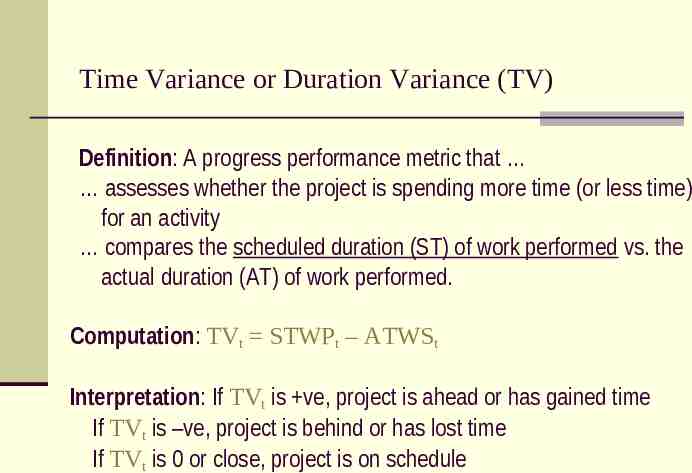
Time Variance or Duration Variance (TV) Definition: A progress performance metric that assesses whether the project is spending more time (or less time) for an activity compares the scheduled duration (ST) of work performed vs. the actual duration (AT) of work performed. Computation: TVt STWPt – ATWSt Interpretation: If TVt is ve, project is ahead or has gained time If TVt is –ve, project is behind or has lost time If TVt is 0 or close, project is on schedule
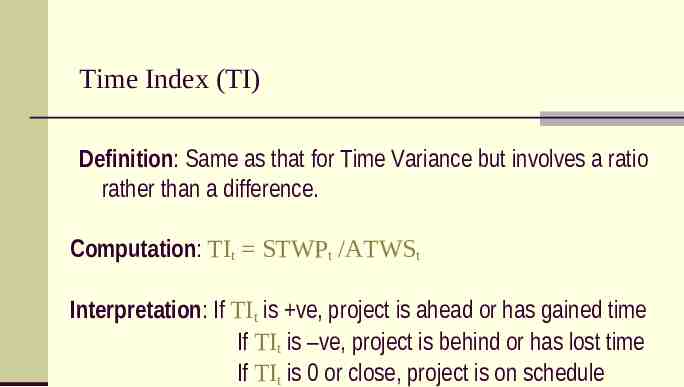
Time Index (TI) Definition: Same as that for Time Variance but involves a ratio rather than a difference. Computation: TIt STWPt /ATWSt Interpretation: If TIt is ve, project is ahead or has gained time If TIt is –ve, project is behind or has lost time If TIt is 0 or close, project is on schedule
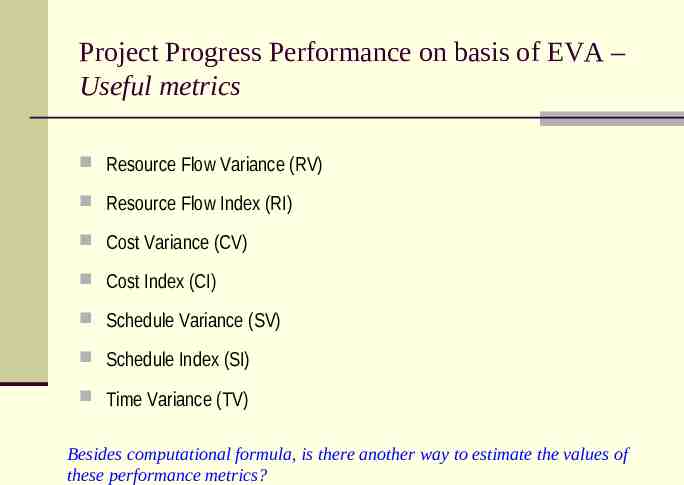
Project Progress Performance on basis of EVA – Useful metrics Resource Flow Variance (RV) Resource Flow Index (RI) Cost Variance (CV) Cost Index (CI) Schedule Variance (SV) Schedule Index (SI) Time Variance (TV) Besides computational formula, is there another way to estimate the values of these performance metrics?
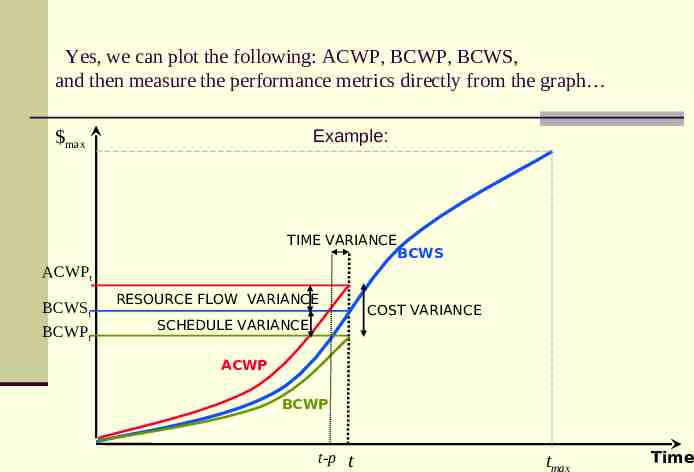
Yes, we can plot the following: ACWP, BCWP, BCWS, and then measure the performance metrics directly from the graph max Example: TIME VARIANCE BCWS ACWPt BCWSt BCWPt RESOURCE FLOW VARIANCE COST VARIANCE SCHEDULE VARIANCE ACWP BCWP t-p t tmax Time
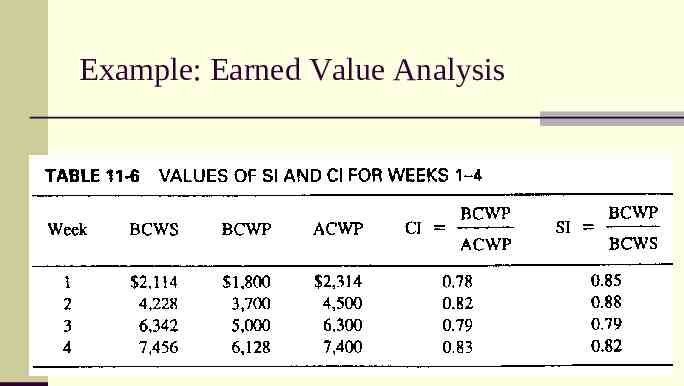
Example: Earned Value Analysis
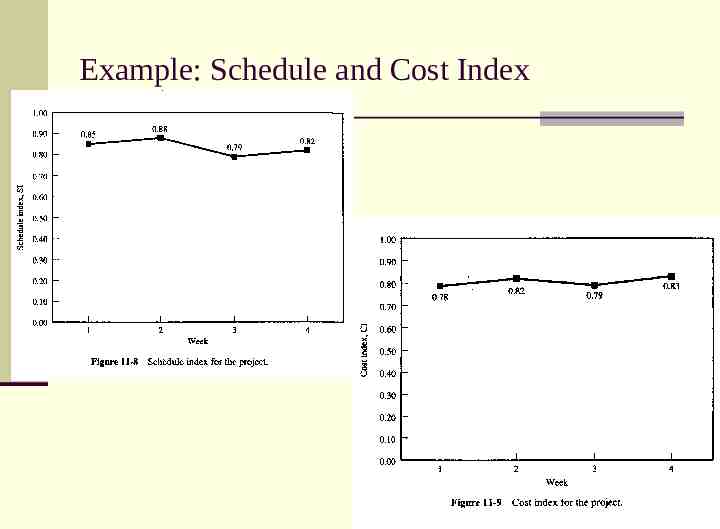
Example: Schedule and Cost Index
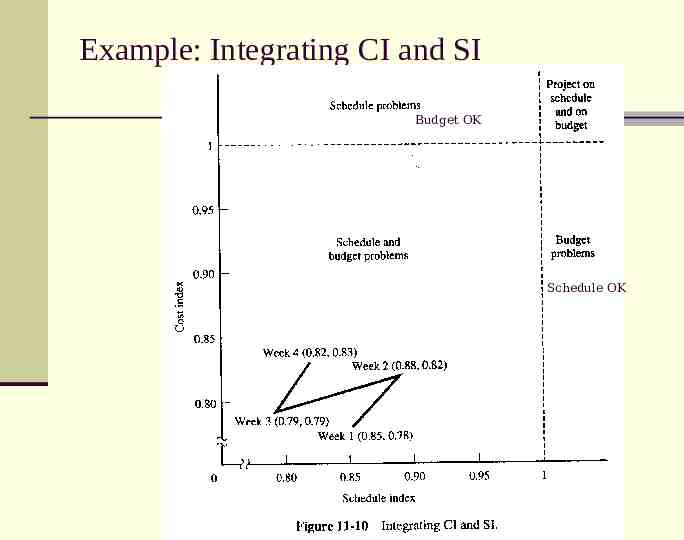
Example: Integrating CI and SI Budget OK Schedule OK
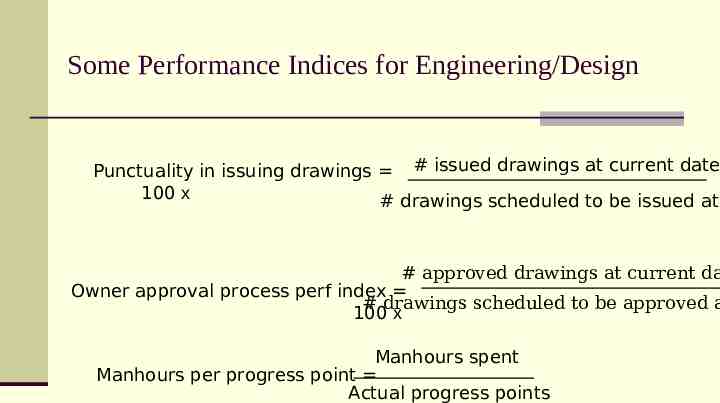
Some Performance Metrics for Design and Procurement
Some Performance Indices for Engineering/Design Punctuality in issuing drawings # issued drawings at current date 100 x # drawings scheduled to be issued at # approved drawings at current da Owner approval process perf index # drawings scheduled to be approved a 100 x Manhours spent Manhours per progress point Actual progress points
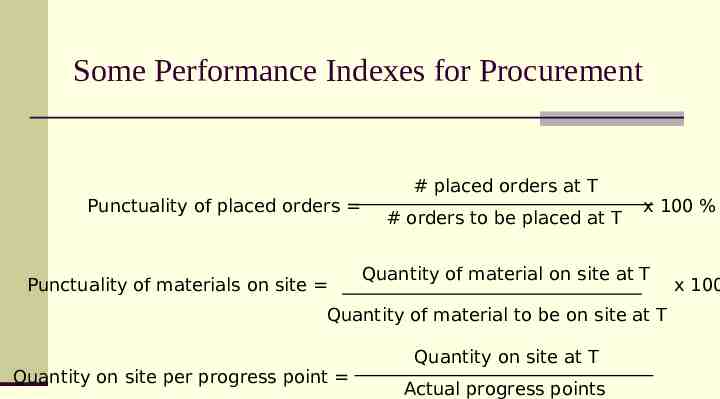
Some Performance Indexes for Procurement Punctuality of placed orders Punctuality of materials on site # placed orders at T # orders to be placed at T x 100 % Quantity of material on site at T Quantity of material to be on site at T Quantity on site per progress point Quantity on site at T Actual progress points x 100
Have a good weekend!