Using a Logic Model Approach to Developing Fundraising Performance


37 Slides814.50 KB
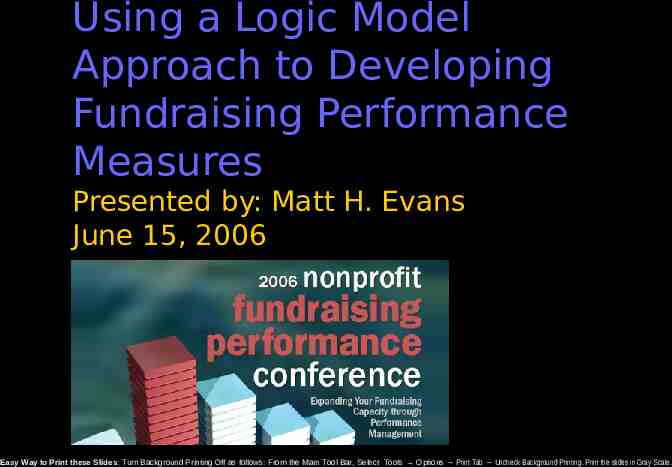
Using a Logic Model Approach to Developing Fundraising Performance Measures Presented by: Matt H. Evans June 15, 2006 Easy Way to Print these Slides: Turn Background Printing Off as follows: From the Main Tool Bar, Select Tools Options Print Tab Uncheck Background Printing. Print the slides in Gray Scale.
Agenda Logic Model Concepts Logic Model Examples Measuring Performance Advanced Concepts Useful Resources 2
Logic Model Concepts 3
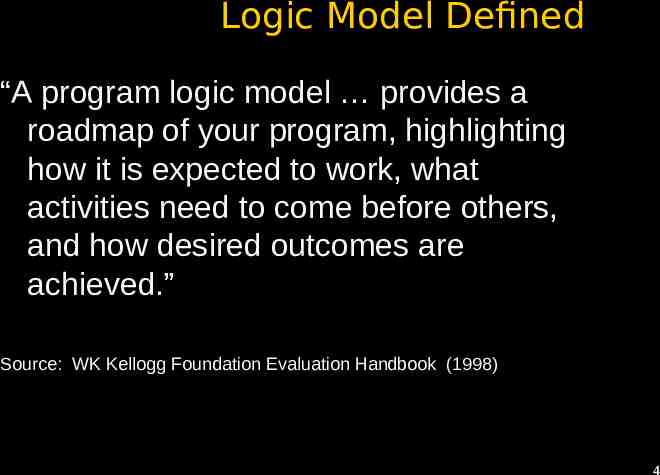
Logic Model Defined “A program logic model provides a roadmap of your program, highlighting how it is expected to work, what activities need to come before others, and how desired outcomes are achieved.” Source: WK Kellogg Foundation Evaluation Handbook (1998) 4
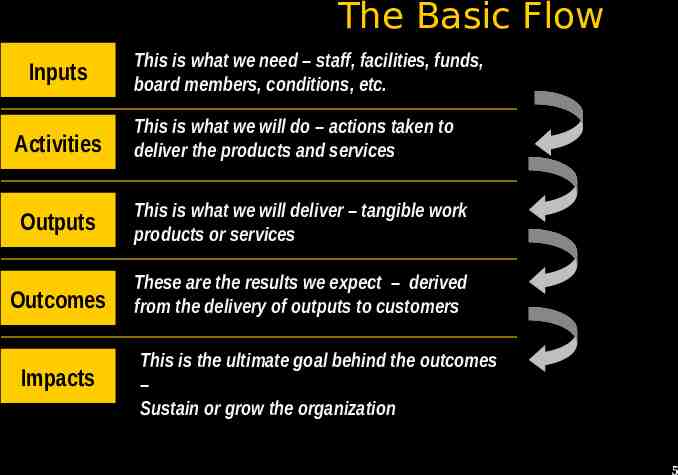
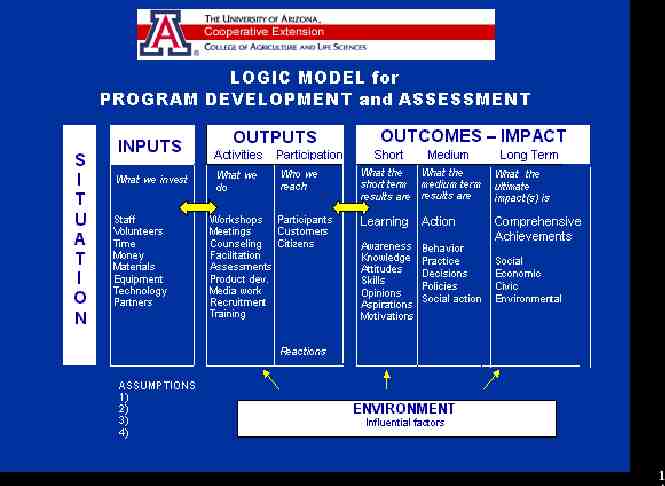
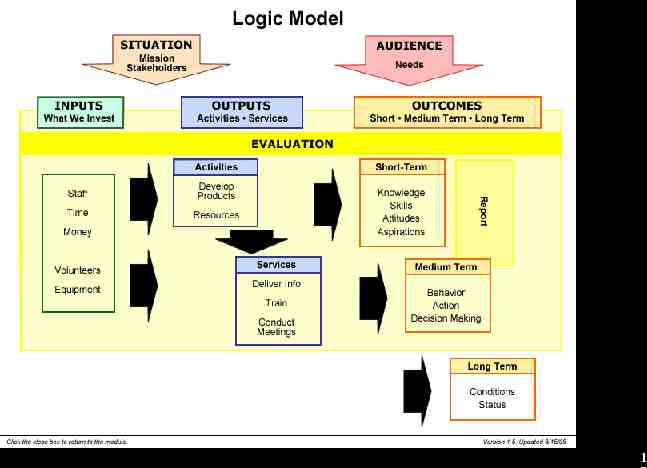
The Basic Flow Inputs Activities This is what we need – staff, facilities, funds, board members, conditions, etc. This is what we will do – actions taken to deliver the products and services Outputs This is what we will deliver – tangible work products or services Outcomes These are the results we expect – derived from the delivery of outputs to customers Impacts This is the ultimate goal behind the outcomes – Sustain or grow the organization 5
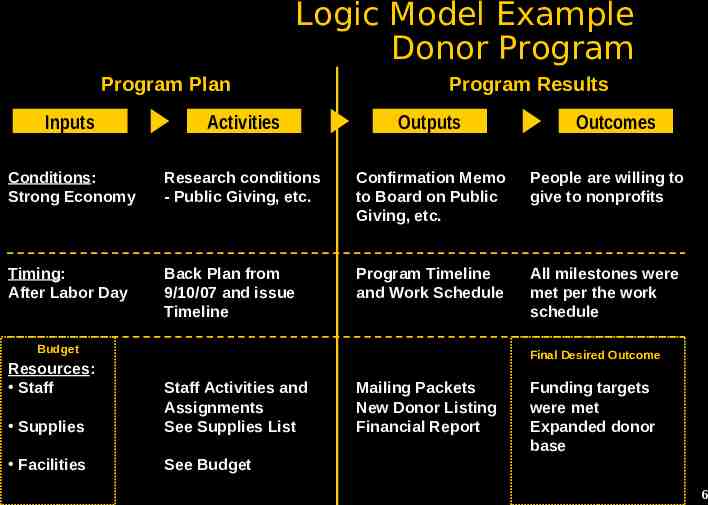
Logic Model Example Donor Program Program Plan Program Results Inputs Activities Outputs Conditions: Strong Economy Research conditions - Public Giving, etc. Confirmation Memo to Board on Public Giving, etc. People are willing to give to nonprofits Timing: After Labor Day Back Plan from 9/10/07 and issue Timeline Program Timeline and Work Schedule All milestones were met per the work schedule Budget Resources: Staff Outcomes Final Desired Outcome Supplies Staff Activities and Assignments See Supplies List Facilities See Budget Mailing Packets New Donor Listing Financial Report Funding targets were met Expanded donor base 6
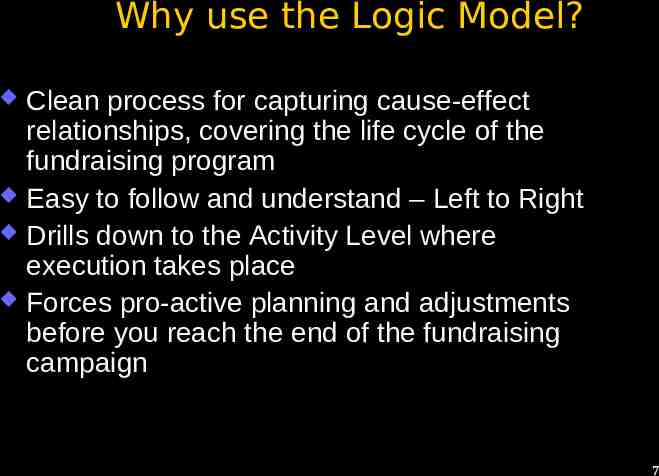
Why use the Logic Model? Clean process for capturing cause-effect relationships, covering the life cycle of the fundraising program Easy to follow and understand – Left to Right Drills down to the Activity Level where execution takes place Forces pro-active planning and adjustments before you reach the end of the fundraising campaign 7
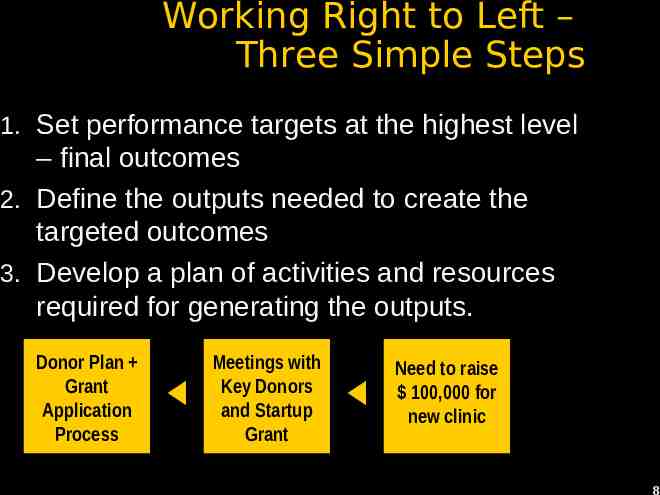
Working Right to Left – Three Simple Steps 1. Set performance targets at the highest level – final outcomes 2. Define the outputs needed to create the targeted outcomes 3. Develop a plan of activities and resources required for generating the outputs. Donor Plan Grant Application Process Meetings with Key Donors and Startup Grant Need to raise 100,000 for new clinic 8
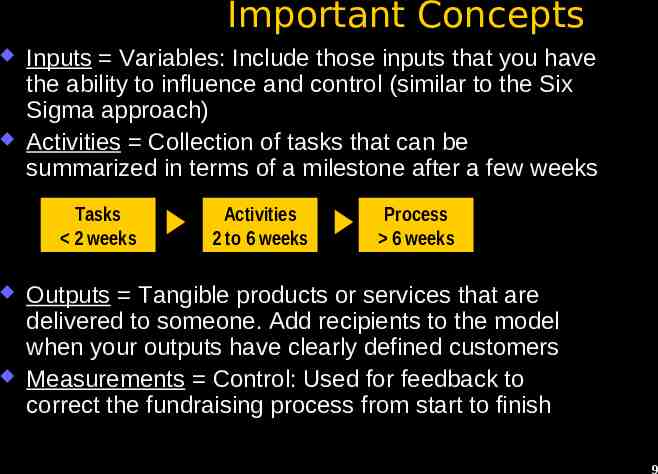
Important Concepts Inputs Variables: Include those inputs that you have the ability to influence and control (similar to the Six Sigma approach) Activities Collection of tasks that can be summarized in terms of a milestone after a few weeks Tasks 2 weeks Activities 2 to 6 weeks Process 6 weeks Outputs Tangible products or services that are delivered to someone. Add recipients to the model when your outputs have clearly defined customers Measurements Control: Used for feedback to correct the fundraising process from start to finish 9
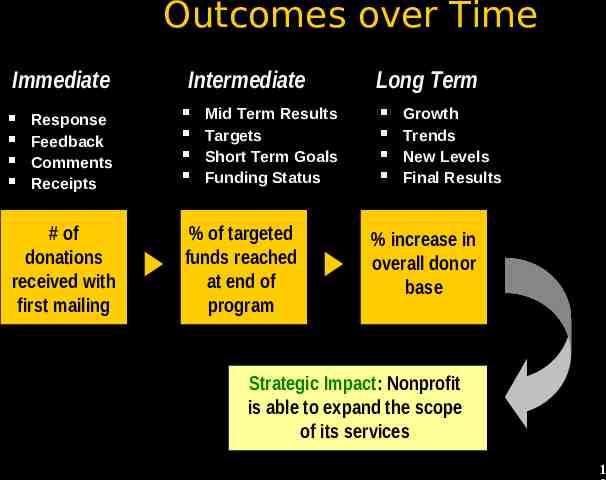
Outcomes over Time Immediate Response Feedback Comments Receipts # of donations received with first mailing Intermediate Mid Term Results Targets Short Term Goals Funding Status % of targeted funds reached at end of program Long Term Growth Trends New Levels Final Results % increase in overall donor base Strategic Impact: Nonprofit is able to expand the scope of its services 1
Logic Model Examples 1
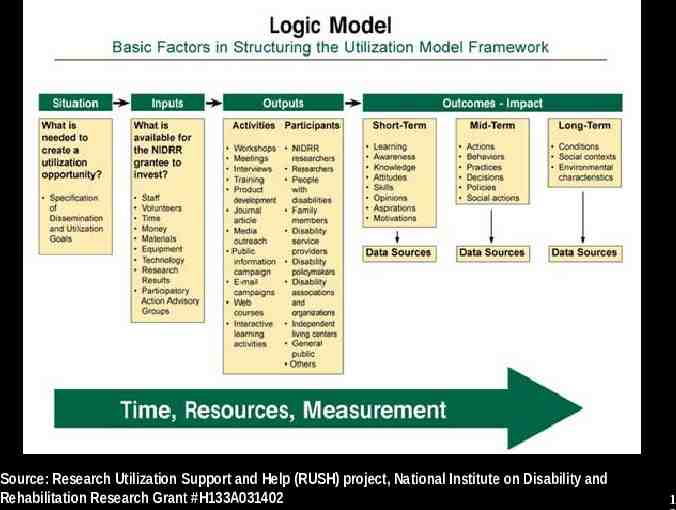
Source: Research Utilization Support and Help (RUSH) project, National Institute on Disability and Rehabilitation Research Grant #H133A031402 1
1
1
1
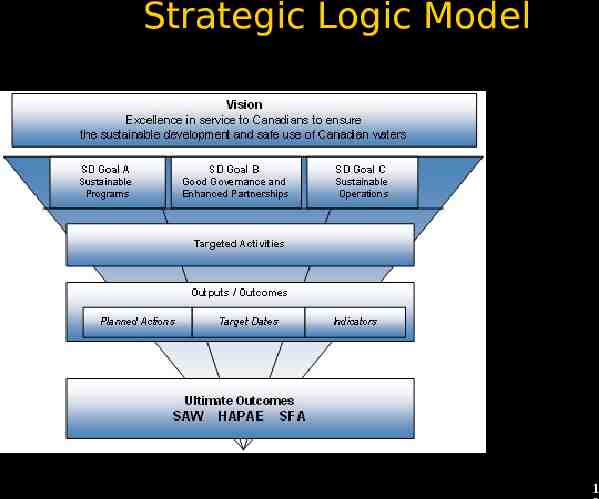
Strategic Logic Model 1
Measuring Performance 1
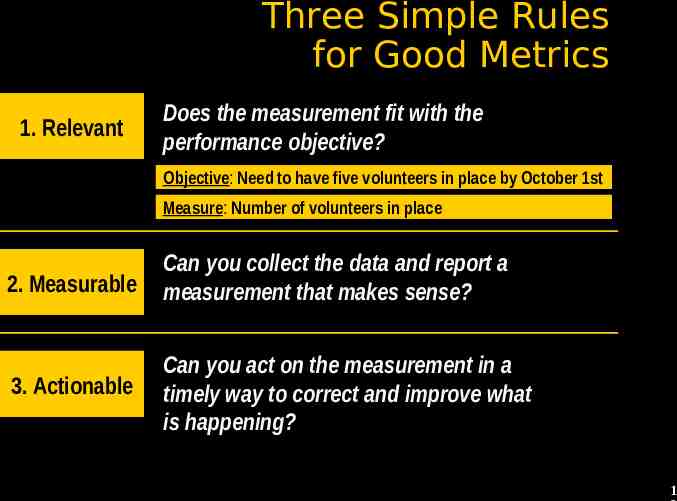
Three Simple Rules for Good Metrics 1. Relevant Does the measurement fit with the performance objective? Objective: Need to have five volunteers in place by October 1st Measure: Number of volunteers in place 2. Measurable Can you collect the data and report a measurement that makes sense? 3. Actionable Can you act on the measurement in a timely way to correct and improve what is happening? 1
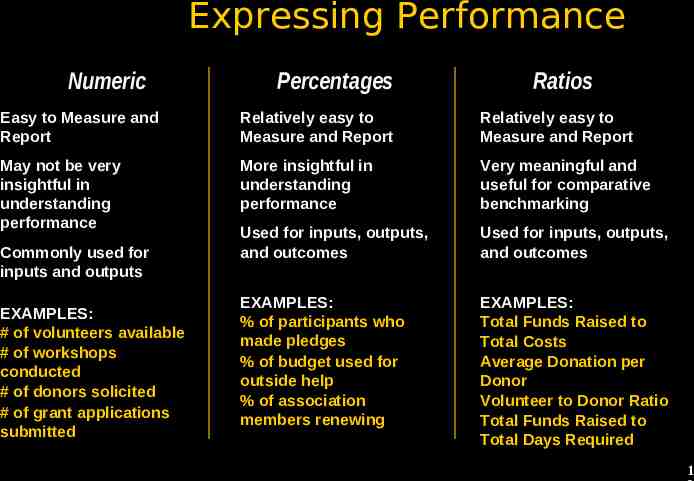
Expressing Performance Numeric Percentages Ratios Easy to Measure and Report Relatively easy to Measure and Report Relatively easy to Measure and Report May not be very insightful in understanding performance More insightful in understanding performance Very meaningful and useful for comparative benchmarking Used for inputs, outputs, and outcomes Used for inputs, outputs, and outcomes EXAMPLES: % of participants who made pledges % of budget used for outside help % of association members renewing EXAMPLES: Total Funds Raised to Total Costs Average Donation per Donor Volunteer to Donor Ratio Total Funds Raised to Total Days Required Commonly used for inputs and outputs EXAMPLES: # of volunteers available # of workshops conducted # of donors solicited # of grant applications submitted 1
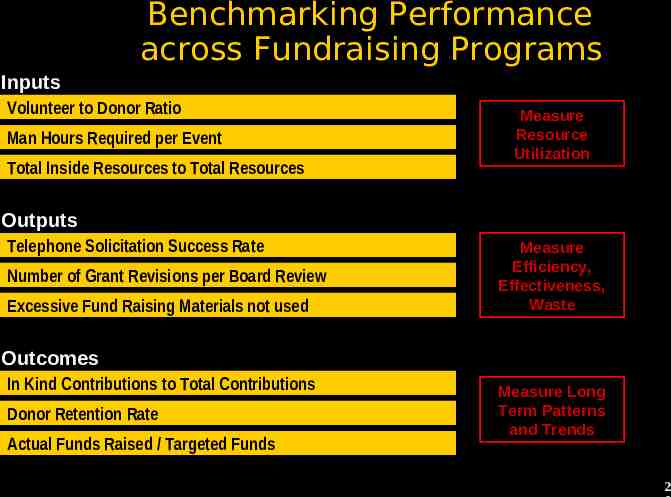
Benchmarking Performance across Fundraising Programs Inputs Volunteer to Donor Ratio Man Hours Required per Event Total Inside Resources to Total Resources Measure Resource Utilization Outputs Telephone Solicitation Success Rate Number of Grant Revisions per Board Review Excessive Fund Raising Materials not used Measure Efficiency, Effectiveness, Waste Outcomes In Kind Contributions to Total Contributions Donor Retention Rate Actual Funds Raised / Targeted Funds Measure Long Term Patterns and Trends 2
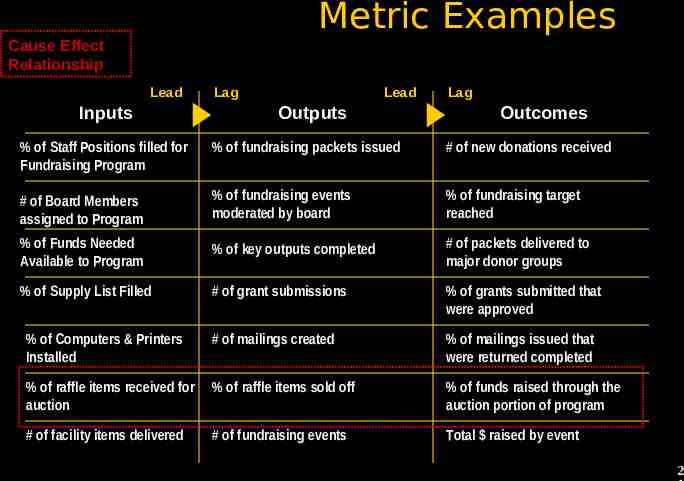
Metric Examples Cause Effect Relationship Lead Inputs Lag Lead Outputs Lag Outcomes % of Staff Positions filled for Fundraising Program % of fundraising packets issued # of new donations received # of Board Members assigned to Program % of fundraising events moderated by board % of fundraising target reached % of Funds Needed Available to Program % of key outputs completed # of packets delivered to major donor groups % of Supply List Filled # of grant submissions % of grants submitted that were approved % of Computers & Printers Installed # of mailings created % of mailings issued that were returned completed % of raffle items received for auction % of raffle items sold off % of funds raised through the auction portion of program # of facility items delivered # of fundraising events Total raised by event 2
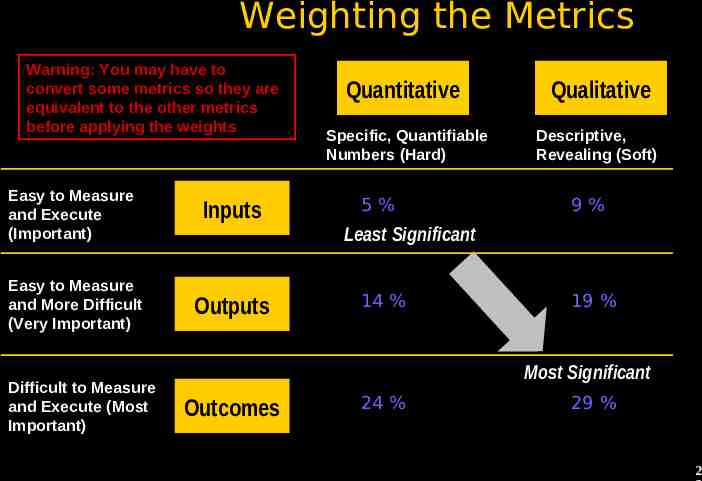
Weighting the Metrics Warning: You may have to convert some metrics so they are equivalent to the other metrics before applying the weights Easy to Measure and Execute (Important) Inputs Easy to Measure and More Difficult (Very Important) Outputs Difficult to Measure and Execute (Most Important) Quantitative Qualitative Specific, Quantifiable Numbers (Hard) Descriptive, Revealing (Soft) 5% 9% Least Significant 14 % 19 % Most Significant Outcomes 24 % 29 % 2
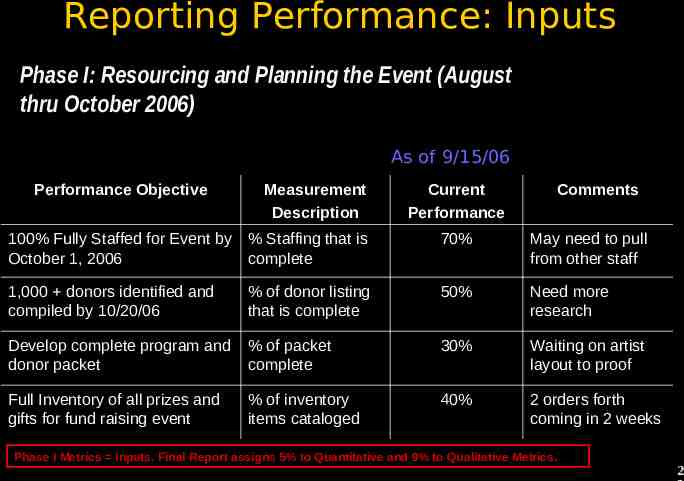
Reporting Performance: Inputs Phase I: Resourcing and Planning the Event (August thru October 2006) As of 9/15/06 Performance Objective Measurement Description Current Performance Comments 100% Fully Staffed for Event by October 1, 2006 % Staffing that is complete 70% May need to pull from other staff 1,000 donors identified and compiled by 10/20/06 % of donor listing that is complete 50% Need more research Develop complete program and donor packet % of packet complete 30% Waiting on artist layout to proof Full Inventory of all prizes and gifts for fund raising event % of inventory items cataloged 40% 2 orders forth coming in 2 weeks Phase I Metrics Inputs. Final Report assigns 5% to Quantitative and 9% to Qualitative Metrics. 2
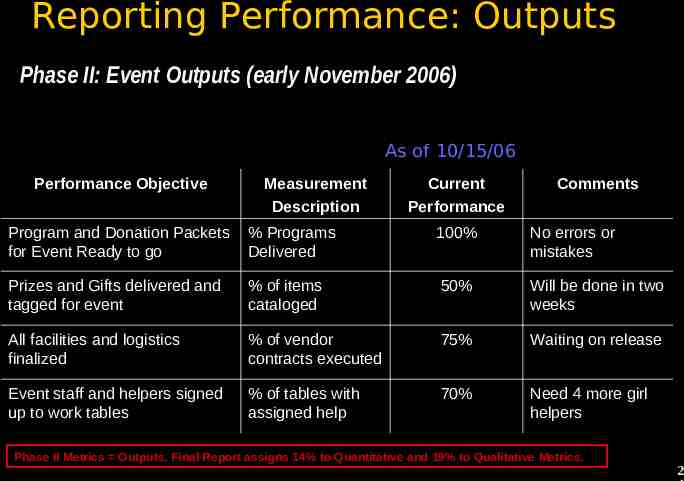
Reporting Performance: Outputs Phase II: Event Outputs (early November 2006) As of 10/15/06 Performance Objective Measurement Description Current Performance Comments Program and Donation Packets for Event Ready to go % Programs Delivered 100% No errors or mistakes Prizes and Gifts delivered and tagged for event % of items cataloged 50% Will be done in two weeks All facilities and logistics finalized % of vendor contracts executed 75% Waiting on release Event staff and helpers signed up to work tables % of tables with assigned help 70% Need 4 more girl helpers Phase II Metrics Outputs. Final Report assigns 14% to Quantitative and 19% to Qualitative Metrics. 2
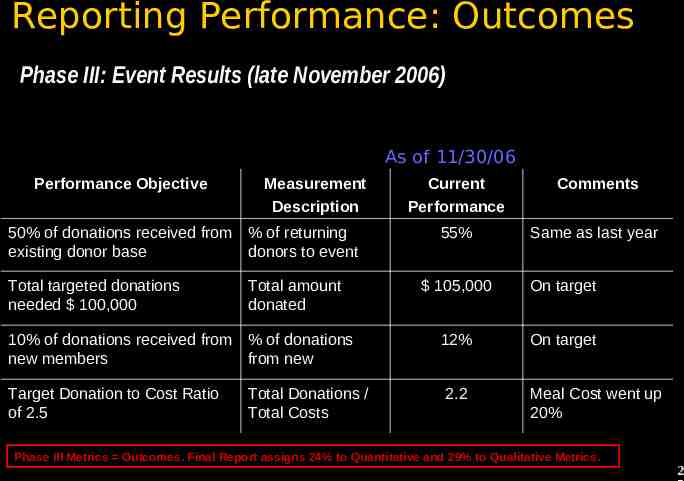
Reporting Performance: Outcomes Phase III: Event Results (late November 2006) As of 11/30/06 Performance Objective Measurement Description 50% of donations received from % of returning existing donor base donors to event Total targeted donations needed 100,000 Total amount donated 10% of donations received from % of donations new members from new Target Donation to Cost Ratio of 2.5 Total Donations / Total Costs Current Performance Comments 55% Same as last year 105,000 On target 12% On target 2.2 Meal Cost went up 20% Phase III Metrics Outcomes. Final Report assigns 24% to Quantitative and 29% to Qualitative Metrics. 2
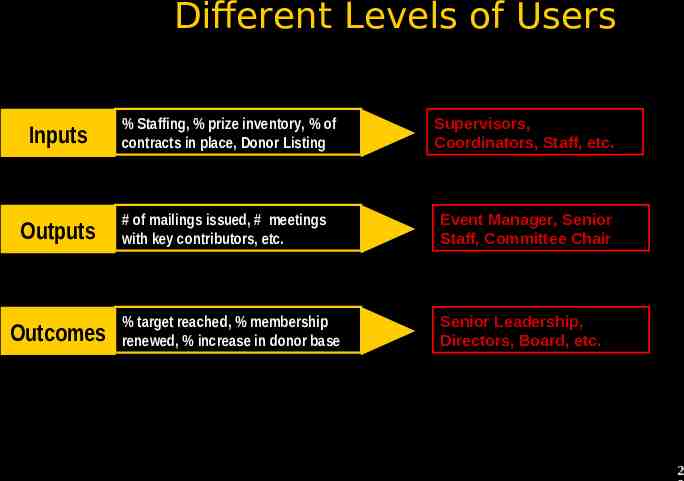
Different Levels of Users Inputs Outputs Outcomes % Staffing, % prize inventory, % of contracts in place, Donor Listing Supervisors, Coordinators, Staff, etc. # of mailings issued, # meetings with key contributors, etc. Event Manager, Senior Staff, Committee Chair % target reached, % membership renewed, % increase in donor base Senior Leadership, Directors, Board, etc. 2
Advanced Concepts 2
Some Pitfalls to Look out for . . Cause Effect Relationships are not always valid – Test early-on and adjust All outcomes are not usually captured or quantified, distorting the ROI (Return on Investment) of the Program – Where possible, recognize the peripheral benefits (new volunteers, ideas, etc.) 2
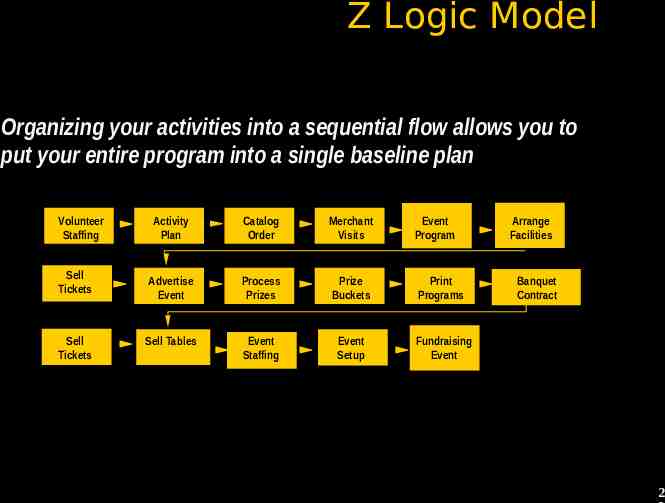
Z Logic Model Organizing your activities into a sequential flow allows you to put your entire program into a single baseline plan Volunteer Staffing Activity Plan Catalog Order Merchant Visits Event Program Sell Tickets Advertise Event Process Prizes Prize Buckets Print Programs Sell Tickets Sell Tables Event Staffing Event Setup Fundraising Event Arrange Facilities Banquet Contract 2
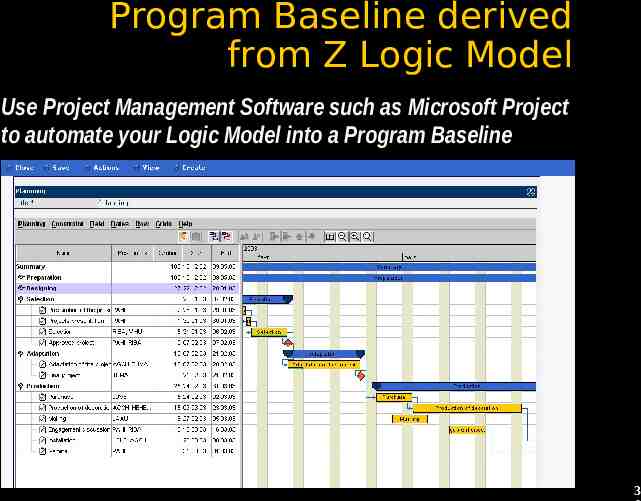
Program Baseline derived from Z Logic Model Use Project Management Software such as Microsoft Project to automate your Logic Model into a Program Baseline 3
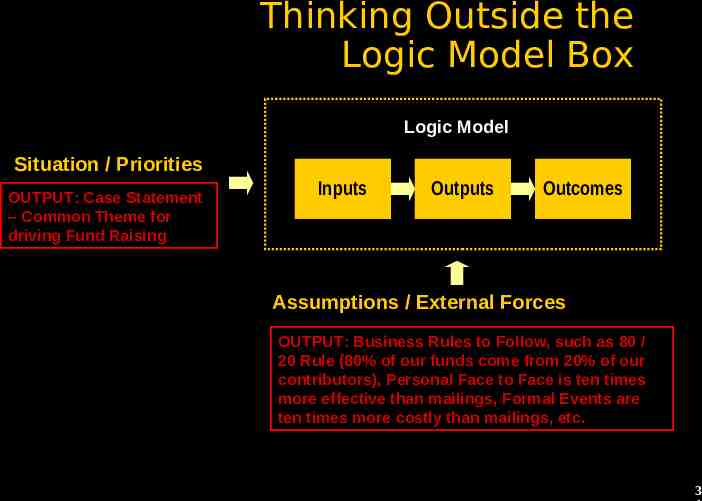
Thinking Outside the Logic Model Box Logic Model Situation / Priorities OUTPUT: Case Statement – Common Theme for driving Fund Raising Inputs Outputs Outcomes Assumptions / External Forces OUTPUT: Business Rules to Follow, such as 80 / 20 Rule (80% of our funds come from 20% of our contributors), Personal Face to Face is ten times more effective than mailings, Formal Events are ten times more costly than mailings, etc. 3
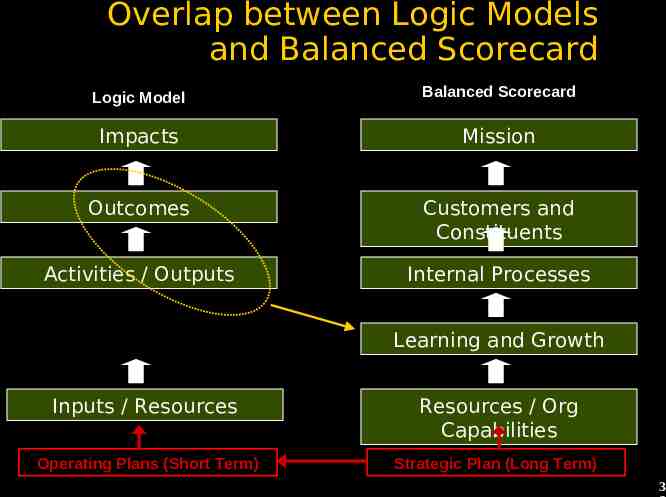
Overlap between Logic Models and Balanced Scorecard Logic Model Balanced Scorecard Impacts Mission Outcomes Customers and Constituents Activities / Outputs Internal Processes Learning and Growth Inputs / Resources Resources / Org Capabilities Operating Plans (Short Term) Strategic Plan (Long Term) 3
Useful Resources 3
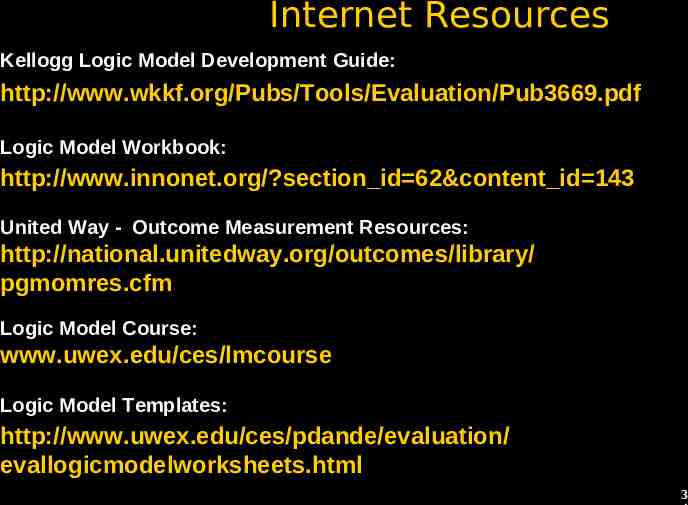
Internet Resources Kellogg Logic Model Development Guide: http://www.wkkf.org/Pubs/Tools/Evaluation/Pub3669.pdf Logic Model Workbook: http://www.innonet.org/?section id 62&content id 143 United Way - Outcome Measurement Resources: http://national.unitedway.org/outcomes/library/ pgmomres.cfm Logic Model Course: www.uwex.edu/ces/lmcourse Logic Model Templates: http://www.uwex.edu/ces/pdande/evaluation/ evallogicmodelworksheets.html 3
Program Evaluation Books touch on Logic Models 3
Flow Charting Tools for drawing Logic Models http://www.rff.com/ http://www.igrafx.com/Products/flowcharter/ http://www.smartdraw.com/exp/dia/home/ http://www.patton-patton.com/ http://www.polarsoftware.com/index.asp 3
Questions and Comments Matt H. Evans 6903 29th St N Arlington, VA 22213 Phone: 1-877-807-8756 Web Site: www.exinfm.com 3