Undergradu ate SIM Fund Student Investment Management


33 Slides380.34 KB
Undergradu ate SIM Fund Student Investment Management Fund INTRODUCTION FUND PERFORMANCE ECONOMIC OVERVIEW W. P. Carey School of Business PORTFOLIO STRUCTURE SELECTION PROCESS INVESTMENT HIGHLIGHTS ATTRIBUTION ANALYSIS Undergraduate Maroon & Gold Value Fund Semi-Annual Meeting December 4th, 2009 CONCLUSION APPENDICES 1
Undergradu ate SIM Fund Today’s Agenda Student Investment Management Fund INTRODUCTION FUND PERFORMANCE ECONOMIC OVERVIEW PORTFOLIO STRUCTURE SELECTION PROCESS INVESTMENT HIGHLIGHTS ATTRIBUTION ANALYSIS CONCLUSION APPENDICES Team introduction & fund objectives Fund performance Economic outlook & market overview Portfolio structure decisions Investment Selection Process Investments to highlight: – American Express Inc (AXP) – CVS Caremark (CVS) Attribution analysis Lessons learned & conclusion 2
Undergradu ate SIM Fund Student Investment Management Fund INTRODUCTION FUND PERFORMANCE ECONOMIC OVERVIEW Fund Performance PORTFOLIO STRUCTURE SELECTION PROCESS INVESTMENT HIGHLIGHTS ATTRIBUTION ANALYSIS CONCLUSION APPENDICES 3
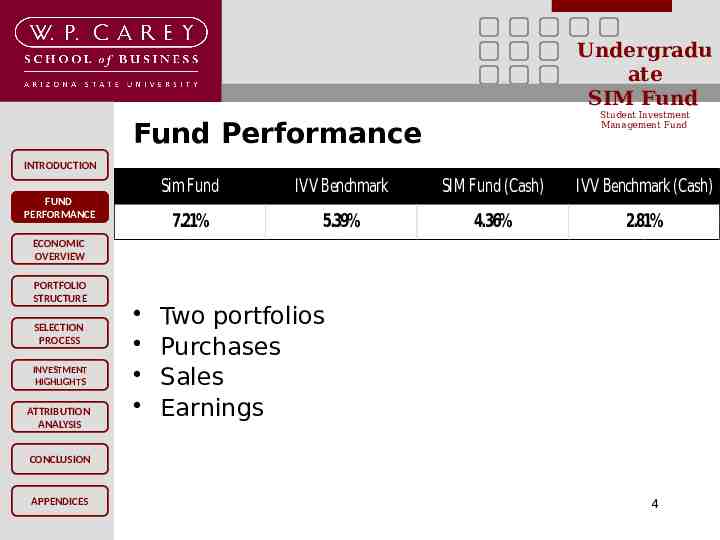
Undergradu ate SIM Fund Student Investment Management Fund Fund Performance INTRODUCTION FUND PERFORMANCE Sim Fund IVV Benchmark SIM Fund (Cash) IVV Benchmark (Cash) 7.21% 5.39% 4.36% 2.81% ECONOMIC OVERVIEW PORTFOLIO STRUCTURE SELECTION PROCESS INVESTMENT HIGHLIGHTS ATTRIBUTION ANALYSIS Two portfolios Purchases Sales Earnings CONCLUSION APPENDICES 4
Undergradu ate SIM Fund 10.00% INTRODUCTION FUND PERFORMANCE 9.00% 8.00% Cumulative Percent Return Student Investment Management Fund SIM 7.21% IVV 5.39% 7.00% ECONOMIC OVERVIEW PORTFOLIO STRUCTURE 6.00% 5.00% 4.00% SELECTION PROCESS INVESTMENT HIGHLIGHTS 3.00% 2.00% 1.00% ATTRIBUTION ANALYSIS CONCLUSION APPENDICES 0.00% SIM Fund IVV Buy/Sell Earnings 9 9 9 9 9 9 9 9 9 9 9 9 9 9 9 9 9 9 9 9 00 200 200 200 200 200 200 200 200 200 200 200 200 200 200 200 200 200 200 200 2 / / / / / / / / / / / / / / / / / / / / -1.00% /5 /9 13 15 19 21 23 27 29 1/2 1/4 1/6 /10 /12 /16 /18 /20 /24 /27 /7 10 10 10 10/ 10/ 10/ 10/ 10/ 10/ 10/ 1 1 1 11 11 11 11 11 11 11 5
FUND PERFORMANCE ECONOMIC OVERVIEW PORTFOLIO STRUCTURE SELECTION PROCESS INVESTMENT HIGHLIGHTS ATTRIBUTION ANALYSIS CONCLUSION APPENDICES 250 225 200 10/5/2009 10/6/2009 10/7/2009 10/8/2009 10/9/2009 10/12/2009 10/13/2009 10/14/2009 10/15/2009 10/16/2009 10/19/2009 10/20/2009 10/21/2009 10/22/2009 10/23/2009 10/26/2009 10/27/2009 10/28/2009 10/29/2009 10/30/2009 11/2/2009 11/3/2009 11/4/2009 11/5/2009 11/6/2009 11/9/2009 11/10/2009 11/11/2009 11/12/2009 11/13/2009 11/16/2009 11/17/2009 11/18/2009 11/19/2009 11/20/2009 11/23/2009 11/24/2009 11/25/2009 11/27/2009 INTRODUCTION BP S Undergradu ate SIM Fund SIM 7.21% IVV 5.39% Basis Points Above IVV Benchmark Student Investment Management Fund 175 150 125 100 75 50 25 0 -25 -50 -75 6
Undergradu ate SIM Fund Student Investment Management Fund INTRODUCTION FUND PERFORMANCE ECONOMIC ECONOMIC OVERVIEW Economic Overview PORTFOLIO STRUCTURE SELECTION PROCESS INVESTMENT HIGHLIGHTS ATTRIBUTION ANALYSIS CONCLUSION APPENDICES 7
Undergradu ate SIM Fund Economic overview Student Investment Management Fund INTRODUCTION FUND PERFORMANCE ECONOMIC ECONOMIC OVERVIEW PORTFOLIO STRUCTURE SELECTION PROCESS INVESTMENT HIGHLIGHTS ATTRIBUTION ANALYSIS We expect slow-to-modest economic growth over next 1-year time frame. We expect large caps to outperform smallto-mid cap stocks as uncertainty and doubt still exists in the market Our belief is the FED will not raise interest rates in the short term, will have a positive benefit for both Equity and Fixed Income markets CONCLUSION APPENDICES 8
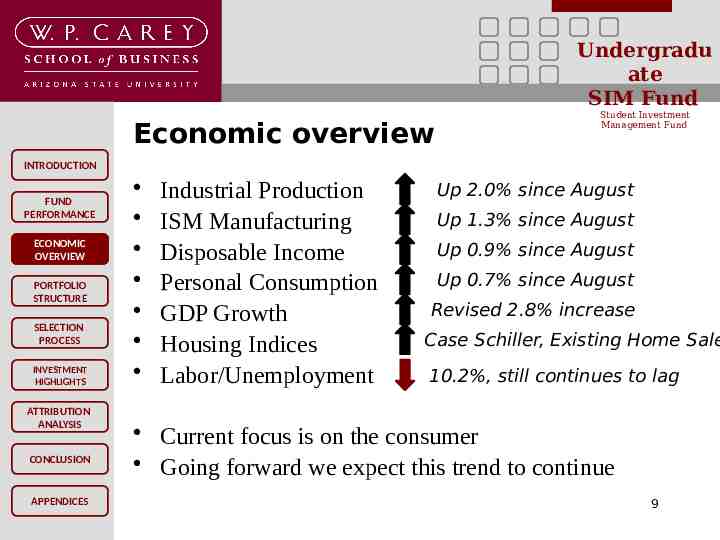
Undergradu ate SIM Fund Economic overview Student Investment Management Fund INTRODUCTION FUND PERFORMANCE ECONOMIC ECONOMIC OVERVIEW PORTFOLIO STRUCTURE SELECTION PROCESS INVESTMENT HIGHLIGHTS ATTRIBUTION ANALYSIS CONCLUSION APPENDICES Industrial Production ISM Manufacturing Disposable Income Personal Consumption GDP Growth Housing Indices Labor/Unemployment Up 2.0% since August Up 1.3% since August Up 0.9% since August Up 0.7% since August Revised 2.8% increase Case Schiller, Existing Home Sale 10.2%, still continues to lag Current focus is on the consumer Going forward we expect this trend to continue 9
Undergradu ate SIM Fund Student Investment Management Fund INTRODUCTION FUND PERFORMANCE ECONOMIC OVERVIEW Portfolio Structural Decisions PORTFOLIO STRUCTURE SELECTION PROCESS Portfolio Allocation INVESTMENT HIGHLIGHTS ATTRIBUTION ANALYSIS CONCLUSION APPENDICES 10
Undergradu ate SIM Fund Portfolio Student Investment Management Fund INTRODUCTION FUND PERFORMANCE ECONOMIC OVERVIEW PORTFOLIO STRUCTURE SELECTION PROCESS INVESTMENT HIGHLIGHTS Diversified, large-cap fund Large-cap with market capitalization of 7bn Global exposure Financially strong & able to take advantage of opportunities More information available ATTRIBUTION ANALYSIS CONCLUSION APPENDICES 11
Undergradu ate SIM Fund Allocation Student Investment Management Fund INTRODUCTION FUND PERFORMANCE ECONOMIC OVERVIEW PORTFOLIO STRUCTURE Diversification Strategy of beating benchmark 9 sectors, 1 potential fixed income position 100,000 ( 10,000 per position) Sector analyst recommended weighting SELECTION PROCESS INVESTMENT HIGHLIGHTS ATTRIBUTION ANALYSIS CONCLUSION APPENDICES 12
Undergradu ate SIM Fund Student Investment Management Fund Sector Allocation INTRODUCTION FUND PERFORMANCE ECONOMIC OVERVIEW PORTFOLIO STRUCTURE SELECTION PROCESS INVESTMENT HIGHLIGHTS ATTRIBUTION ANALYSIS Industrials 8.4% Telecom 8.4% Energy 7.4% Technology 13.3% Discretionary 11.4% Staples 9.3% Financials 11.4% Cash 10.1% Healthcare 10.1% Materials 10.3% CONCLUSION APPENDICES 13
Undergradu ate SIM Fund Student Investment Management Fund INTRODUCTION FUND PERFORMANCE ECONOMIC OVERVIEW Investment Selection Process PORTFOLIO STRUCTURE INVESTMENT SELECTION SELECTION PROCESS INVESTMENT HIGHLIGHTS Sector reports investment selection due diligence committee ATTRIBUTION ANALYSIS CONCLUSION APPENDICES 14
Undergradu ate SIM Fund Sector Reports Student Investment Management Fund INTRODUCTION FUND PERFORMANCE ECONOMIC OVERVIEW PORTFOLIO STRUCTURE Top-down analysis approach Sub-sector focus Determined view by examining: Economic reports, performance charts, industry publications, wall street research reports, etc. INVESTMENT SELECTION SELECTION PROCESS INVESTMENT HIGHLIGHTS ATTRIBUTION ANALYSIS CONCLUSION APPENDICES 15
Undergradu ate SIM Fund Investment Reports Student Investment Management Fund INTRODUCTION FUND PERFORMANCE ECONOMIC OVERVIEW PORTFOLIO STRUCTURE INVESTMENT SELECTION SELECTION PROCESS INVESTMENT HIGHLIGHTS Industry overview What is the current position of the sub-sector Fundamental analysis P/E Price to Book Revenue Growth Business Margins Return on Equity Buy/Sell recommendation ATTRIBUTION ANALYSIS CONCLUSION APPENDICES 16
Undergradu ate SIM Fund Committee, Monitoring Student Investment Management Fund INTRODUCTION FUND PERFORMANCE ECONOMIC OVERVIEW PORTFOLIO STRUCTURE Committee decision Vetting process/due diligence Majority consensus Monitoring Company briefings & industry updates INVESTMENT SELECTION SELECTION PROCESS INVESTMENT HIGHLIGHTS ATTRIBUTION ANALYSIS CONCLUSION APPENDICES 17
Undergradu ate SIM Fund Student Investment Management Fund INTRODUCTION FUND PERFORMANCE ECONOMIC OVERVIEW Stocks to Highlight PORTFOLIO STRUCTURE SELECTION PROCESS American Express (AXP) CVS Caremark (CVS) INVESTMENT INVESTMENT HIGHLIGHTS HIGHLIGHTS ATTRIBUTION ANALYSIS CONCLUSION APPENDICES 18
Undergradu ate SIM Fund American Express (AXP) Student Investment Management Fund INTRODUCTION FUND PERFORMANCE ECONOMIC OVERVIEW PORTFOLIO STRUCTURE SELECTION PROCESS INVESTMENT INVESTMENT HIGHLIGHTS HIGHLIGHTS ATTRIBUTION ANALYSIS CONCLUSION APPENDICES Compared with competitors Visa and Discover Financial Services Reasons for Purchase Strong revenue generator Global business operations Also has world’s largest travel service business Closed-loop business model – allows Amex to capitalize on efficiencies that competitors do not have Credit markets weak, but Amex has high lending standards, which should mitigate delinquencies Ranked highest in 2009 in J.D. Power & Associates Credit Card Satisfaction Survey 19
Undergradu ate SIM Fund American Express (AXP) INTRODUCTION FUND PERFORMANCE ECONOMIC OVERVIEW 30.0% SELECTION PROCESS INVESTMENT INVESTMENT HIGHLIGHTS HIGHLIGHTS ATTRIBUTION ANALYSIS CONCLUSION American Express (AXP) Performance October 5th - November 27th 40.84 25.0% 20.0% PORTFOLIO STRUCTURE Student Investment Management Fund 22.9% 15.0% 10.0% Percentage Return 32.76 5.0% 0.0% 9 9 9 9 9 9 9 9 9 9 9 9 9 9 9 9 9 9 9 9 0 0 2 0 0 2 0 0 2 00 2 00 2 0 0 2 00 2 0 0 2 0 0 2 00 2 0 0 2 0 0 2 0 0 2 0 0 2 00 2 00 2 0 0 2 0 0 2 00 2 0 0 2 / / / / / / / / / / / / / / / / / / / / /7 0/9 /1 3 /15 /1 9 /21 /23 /2 7 /29 1/2 1/4 1 /6 /10 /1 2 /16 /18 /2 0 /24 /2 7 /5 -5.0% 10 10 1 0 0 0 1 1 1 1 1 1 0 0 0 0 1 1 1 1 1 1 1 1 1 1 1 1 1 1 1 1 1 1 -10.0% APPENDICES 20
Undergradu ate SIM Fund CVS Caremark(CVS) INTRODUCTION FUND PERFORMANCE Compared to Walgreens and Wal-Mart Reasons for Purchase Implications of Health Care Bill ECONOMIC OVERVIEW PORTFOLIO STRUCTURE INVESTMENT INVESTMENT HIGHLIGHTS HIGHLIGHTS CONCLUSION APPENDICES Increased sales volume and store traffic Possible decreased in PBM margins Strong presence in sun belt states Most successful customer loyalty program and created savings plus plan targeted at uninsured and underinsured customers SELECTION PROCESS ATTRIBUTION ANALYSIS Student Investment Management Fund Reasons for Sale Unexpected 4.8bn loss of contracts in 2010 Investigation by SEC into 2007 merger Federal Trade Commission investigating business 21 practices
Undergradu ate SIM Fund CVS Caremark(CVS) Student Investment Management Fund INTRODUCTION 37.75 FUND PERFORMANCE CVS Caremark Performance October 21st - November 10th 5.00% ECONOMIC OVERVIEW PORTFOLIO STRUCTURE SELECTION PROCESS INVESTMENT INVESTMENT HIGHLIGHTS HIGHLIGHTS 0.00% ct -5.00%1-O 2 CONCLUSION APPENDICES 9 9 9 9 9 9 9 9 9 9 9 9 9 9 -0 -0 -0 -0 -0 -0 -0 t-0 t-0 t-0 t-0 t-0 t-0 t-0 v v v v v v v c c c c c c c o -O -O -O -O No No -O -O -O No No No No -N 23456922 23 26 27 28 29 30 10 -10.00% 30.15 -15.00% -20.00% ATTRIBUTION ANALYSIS 9 -0 (18.9%) -25.00% Purchased KO (11/30) at 56.97 to replace CVS in Consumer Staples 22
Undergradu ate SIM Fund Student Investment Management Fund INTRODUCTION FUND PERFORMANCE ECONOMIC OVERVIEW Attribution Analysis PORTFOLIO STRUCTURE SELECTION PROCESS INVESTMENT HIGHLIGHTS ATTRIBUTION ATTRIBUTION ANALYSIS CONCLUSION APPENDICES 23
Undergradu ate SIM Fund Weighted Portfolio INTRODUCTION 3.0% FUND PERFORMANCE 2.0% ECONOMIC OVERVIEW 1.0% PORTFOLIO STRUCTURE 0.0% -1.0% SELECTION PROCESS INVESTMENT HIGHLIGHTS ATTRIBUTION ATTRIBUTION ANALYSIS CONCLUSION APPENDICES Student Investment Management Fund what do we ReturnTo attribute a manager’s performance? 2.53% 0.24% -0.40% 0.77% 0.05% -0.04% -0.07% 0.05% - Investing in the right sector? - Stock picking? - A combination? -2.53% Attribution Analysis as means of evaluating our investment thesis -2.0% -3.0% Portfolio Return - Benchmark Return Total Return Difference 3.1% - 0.89% 2.21% 24
Undergradu ate SIM Fund Performance Attribution INTRODUCTION 2.5% FUND PERFORMANCE 2.0% ECONOMIC OVERVIEW Total Effect 2.21% 1.5% 1.0% PORTFOLIO STRUCTURE Student Investment Management Fund 2.07% 0.5% 0.59% SELECTION PROCESS INVESTMENT HIGHLIGHTS 0.0% Allocation Effect Selection Effect Interaction -0.45%Effect -0.5% -1.0% ATTRIBUTION ATTRIBUTION ANALYSIS CONCLUSION APPENDICES - Allocation Effect: Investing in the right sector? 2.07% - Selection Effect: Stock picking? 0.59% - Interaction Effect: Combination? 25
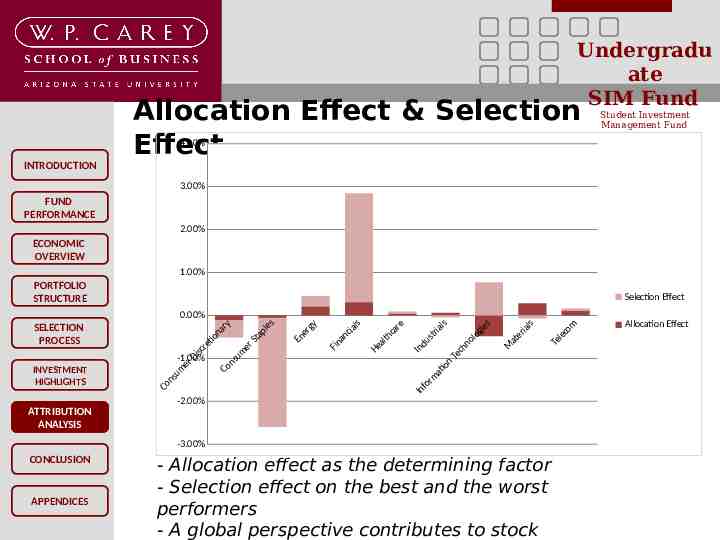
Undergradu ate SIM Fund Allocation Effect & Selection Effect Student Investment Management Fund 4.00% INTRODUCTION 3.00% FUND PERFORMANCE 2.00% ECONOMIC OVERVIEW 1.00% PORTFOLIO STRUCTURE Selection Effect 0.00% SELECTION PROCESS INVESTMENT HIGHLIGHTS ry les na ap o t S ti re er si c m u D -1.00% ns er o C um ns o C -2.00% gy er n E ls cia n a Fin re ca h alt He als tri s du In on ati rm fo In ies og l o hn c Te ls ria e at M ATTRIBUTION ATTRIBUTION ANALYSIS -3.00% CONCLUSION APPENDICES - Allocation effect as the determining factor - Selection effect on the best and the worst performers - A global perspective contributes to stock om lec e T Allocation Effect
Undergradu ate SIM Fund Student Investment Management Fund INTRODUCTION FUND PERFORMANCE ECONOMIC OVERVIEW Lessons Learned & Conclusion PORTFOLIO STRUCTURE SELECTION PROCESS INVESTMENT HIGHLIGHTS ATTRIBUTION ANALYSIS CONCLUSION APPENDICES 27
Undergradu ate SIM Fund Lessons Learned Student Investment Management Fund INTRODUCTION FUND PERFORMANCE ECONOMIC OVERVIEW PORTFOLIO STRUCTURE SELECTION PROCESS INVESTMENT HIGHLIGHTS ATTRIBUTION ANALYSIS Unexpected News Despite in-depth fundamental analysis, it is impossible to predict future events News released Nov. 5 causing stock price of CVS to drop 20% Sell discipline Determine if company is still strong fundamentally Stop-Loss of 15% on all securities Position sold must be replaced to maintain minimal cash position CONCLUSION APPENDICES 28
Undergradu ate SIM Fund Conclusion Student Investment Management Fund INTRODUCTION FUND PERFORMANCE ECONOMIC OVERVIEW PORTFOLIO STRUCTURE SELECTION PROCESS Fund Structure Addressing groupthink Spring 2010 Semester Daniel Stone will be the new fund manager Fund will be investing in a mutual fund specializing in fixed income Accepted five new analysts INVESTMENT HIGHLIGHTS ATTRIBUTION ANALYSIS CONCLUSION APPENDICES 29
Undergradu ate SIM Fund Student Investment Management Fund INTRODUCTION FUND PERFORMANCE ECONOMIC OVERVIEW Appendices PORTFOLIO STRUCTURE SELECTION PROCESS Fund Holdings Transaction History Resumes INVESTMENT HIGHLIGHTS ATTRIBUTION ANALYSIS CONCLUSION APPENDICES 30
Undergradu ate SIM Fund Fund Holdings Student Investment Management Fund INTRODUCTION FUND PERFORMANCE ECONOMIC OVERVIEW PORTFOLIO STRUCTURE SELECTION PROCESS INVESTMENT HIGHLIGHTS ATTRIBUTION ANALYSIS International Business Machines (IBM) American Express (AXP) Coach (COH) Teva Pharmaceuticals (TEVA) BHP Billiton (BHP) Exxon (XOM) Verizon Wireless (VZ) Danaher (DHR) Coca-Cola (KO) CONCLUSION APPENDICES 31
Undergradu ate SIM Fund Transaction History Student Investment Management Fund INTRODUCTION FUND PERFORMANCE ECONOMIC OVERVIEW PORTFOLIO STRUCTURE SELECTION PROCESS INVESTMENT HIGHLIGHTS ATTRIBUTION ANALYSIS Buys: IBM (10/26): 110 shares @ 120.36, return: AXP (10/26): 320 shares @ 34.58, return: COH (10/26): 200 shares @ 50.30, return: TEVA (10/26): 110 shares @ 120.36, return: BHP (10/26): 100 shares @ 73.66, return: XOM (10/26): 110 shares @ 73.81, return: VZ (10/26): 290 shares @ 29.00, return: DHR (10/26): 120 shares @ 70.00, return: CVS (10/26): 250 shares @ 37.16, return: KO (11/30): 175 shares @ 56.97, return: CONCLUSION Sells: APPENDICES CVS (11/10): 250 shares @ 30.15, return: -18.9%32
Alternative Metric- Assumes IVV or SPY Holdover Funds Instead of Cash Position Unweighted IVV Shares Benchmark 958 99,967.30 958 101,356.40 958 101,653.38 958 102,429.36 958 103,032.90 958 103,492.74 958 103,301.14 958 105,092.60 958 105,447.06 INTRODUCTION 958 104,661.50 958 105,542.86 958 105,025.54 958 FUND 104,000.48 PERFORMANCE 958 105,035.12 958 103,904.68 958ECONOMIC 102,688.02 958 OVERVIEW 102,285.66 958 100,360.08 958 102,467.68 PORTFOLIO 958 99,603.26 STRUCTURE 958 100,235.54 958 100,561.26 958SELECTION 100,685.80 958 PROCESS 102,659.28 958 102,994.58 958INVESTMENT 105,303.36 958HIGHLIGHTS 105,274.62 958 105,839.84 958 104,776.46 ATTRIBUTION 958 105,399.16 958 ANALYSIS 106,864.90 958 106,960.70 958 106,931.96 CONCLUSION 958 105,504.54 958 105,274.62 958 106,567.92 958APPENDICES 106,615.82 958 107,018.18 958 105,351.26 Given holdver funds SIMF IVV Total SIMF Shares of Purchased IVV 649 (153) (181) (93) (87) 68 - 649 649 649 649 496 496 496 315 315 222 222 222 135 135 135 135 135 135 135 135 135 135 135 135 135 135 135 135 135 135 135 135 203 203 203 203 203 203 203 Aggregating SIM Fund IVV Funds 67,723.15 68,664.20 68,865.39 69,391.08 53,344.80 53,582.88 53,483.68 34,555.50 34,672.05 24,253.50 24,457.74 24,337.86 14,655.60 14,801.40 14,642.10 14,470.65 14,413.95 14,142.60 14,439.60 14,035.95 14,125.05 14,170.95 14,188.50 14,466.60 14,513.85 14,839.20 14,835.15 14,914.80 14,764.95 14,852.70 15,059.25 15,072.75 22,658.86 22,356.39 22,307.67 22,581.72 22,591.87 22,677.13 22,323.91 Positions 32,285.40 32,824.20 32,902.80 33,101.90 49,925.10 50,266.20 50,178.00 70,694.30 71,129.00 79,971.90 80,933.70 80,470.70 89,580.30 90,958.90 89,287.10 88,819.20 88,820.10 87,265.90 89,373.70 87,333.90 88,097.70 87,851.00 88,033.50 88,194.60 88,518.20 91,047.70 91,022.90 91,648.00 90,567.90 91,594.70 93,013.80 92,675.90 85,081.30 84,294.40 83,892.60 85,428.70 85,373.50 86,218.60 84,774.20 Performance SIM Fund 100,008.55 101,488.40 101,768.19 102,492.98 103,269.90 103,849.08 103,661.68 105,249.80 105,801.05 104,225.40 105,391.44 104,808.56 104,235.90 105,760.30 103,929.20 103,289.85 103,234.05 101,408.50 103,813.30 101,369.85 102,222.75 102,021.95 102,222.00 102,661.20 103,032.05 105,886.90 105,858.05 106,562.80 105,332.85 106,447.40 108,073.05 107,748.65 107,740.16 106,650.79 106,200.27 108,010.42 107,965.37 108,895.73 107,221.11 SIM Fund 0.00% 1.48% 1.76% 2.48% 3.26% 3.84% 3.65% 5.24% 5.79% 4.22% 5.38% 4.80% 4.23% 5.75% 3.92% 3.28% 3.23% 1.40% 3.80% 1.36% 2.21% 2.01% 2.21% 2.65% 3.02% 5.88% 5.85% 6.55% 5.32% 6.44% 8.06% 7.74% 7.73% 6.64% 6.19% 8.00% 7.96% 8.89% 7.21% IVV Relative Performance SIM Fund* Benchmark* Undergradu 0 0 9 ate 00 7.3 2.1 SIM Fund00 19.4 0.00% 1.39% 1.69% 2.46% 3.07% 3.53% 3.33% 5.13% 5.48% 4.70% 5.58% 5.06% 4.03% 5.07% 3.94% 2.72% 2.32% 0.39% 2.50% -0.36% 0.27% 0.59% 0.72% 2.69% 3.03% 5.34% 5.31% 5.87% 4.81% 5.43% 6.90% 7.00% 6.97% 5.54% 5.31% 6.60% 6.65% 7.05% 5.39% Student Investment 31.4 0 Management Fund 31.8 11.4 31 -47.9 -19.5 -26 19.2 68.2 -1.8 55.9 90.6 100.7 130.3 172.5 194.6 141.9 149.5 -4 -0.5 54 54 67.9 51.3 100.5 116.4 74.4 76.4 110.3 88.2 139.8 130.5 183.3 182.6 33 0 0 0 0 0 0 0 0 0 0 0 0 0 0 0 0 0 0 0 0 0 0 0 0 0 0 0 0 0 0 0 0 0