Commercial PACE: A Comparative Analysis February 26, 2015 1

49 Slides4.12 MB
Commercial PACE: A Comparative Analysis February 26, 2015 1 Energy Efficiency and Renewable Energy DOE’s Technical Assistance Program Office of Weatherization and Intergovernmental Programs eere.energy.gov
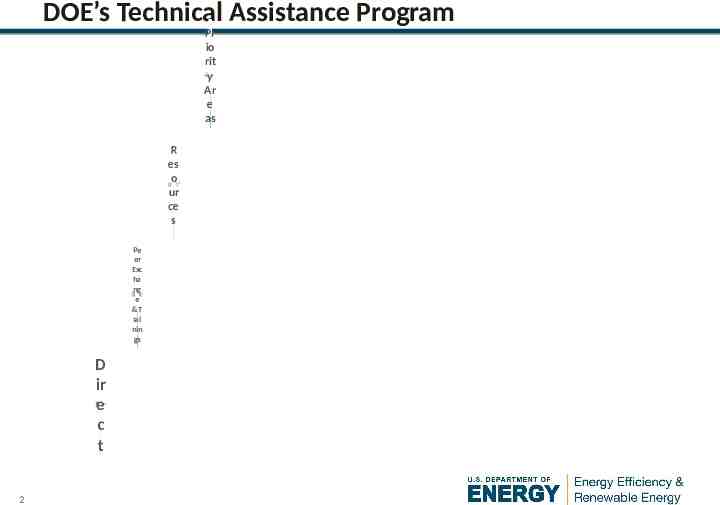
DOE’s Technical Assistance Program Pr io rit y Ar e as S trategic Energy Planning Program & Polic y Design and I mplementation F inanc ing Strategies Data Management and EM&V EE&RE Tec hnologies R es o ur ce s General Educati on (e.g., fact sheets, 101s) Case S tudies Tools for Dec ision-Making Protocols ( e. g., how-to guides, model documents) Pe er Exc ha ng e &T rai nin gs Webinars Conferences & InPerson Trainings D ir e c t I n- depth efforts will be f oc used on: High Impact Eff orts Opportuniti es f or Replicability Filling Gaps in the Technical A ssistanc e Marketplace 2
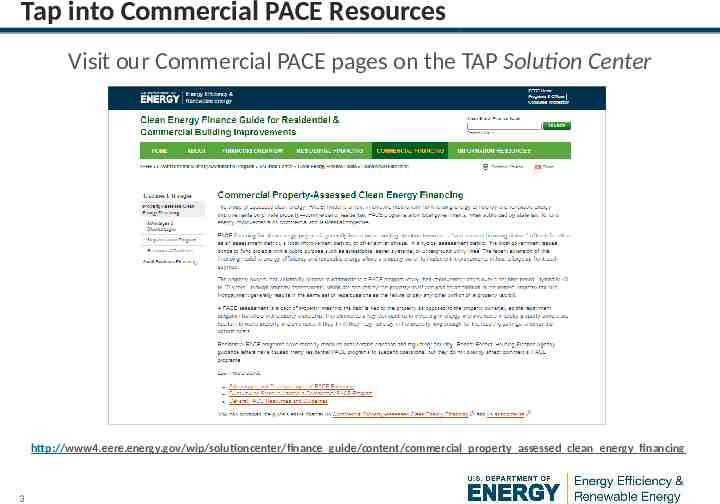
Tap into Commercial PACE Resources Visit our Commercial PACE pages on the TAP Solution Center http://www4.eere.energy.gov/wip/solutioncenter/finance guide/content/commercial property assessed clean energy financing 3
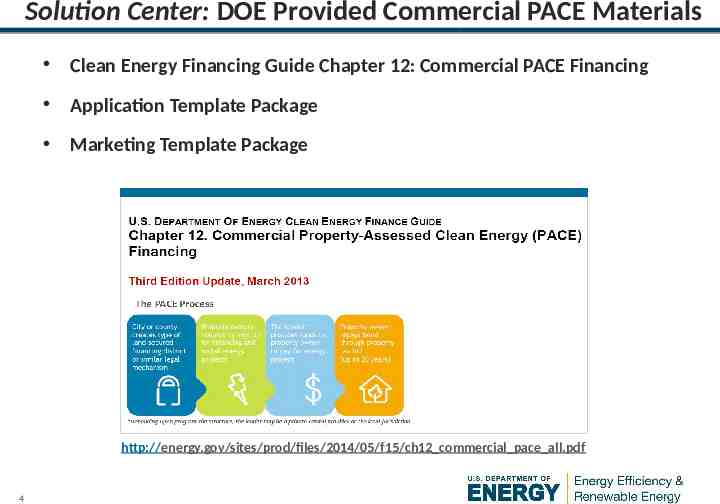
Solution Center: DOE Provided Commercial PACE Materials Clean Energy Financing Guide Chapter 12: Commercial PACE Financing Application Template Package Marketing Template Package http://energy.gov/sites/prod/files/2014/05/f15/ch12 commercial pace all.pdf 4
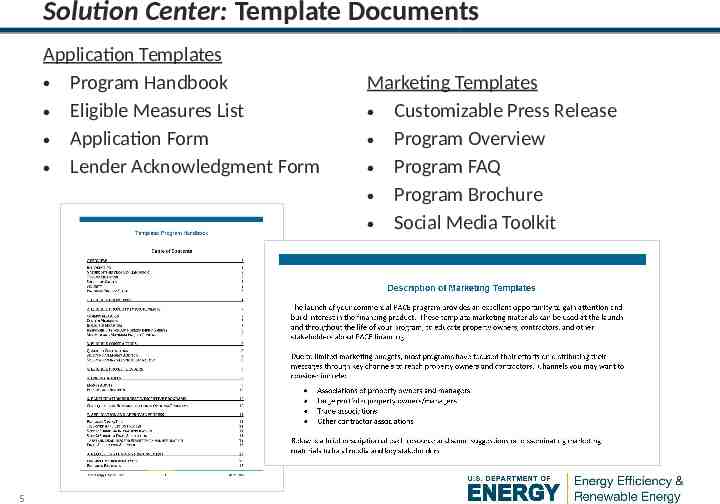
Solution Center: Template Documents Application Templates Program Handbook Eligible Measures List Application Form Lender Acknowledgment Form 5 Marketing Templates Customizable Press Release Program Overview Program FAQ Program Brochure Social Media Toolkit
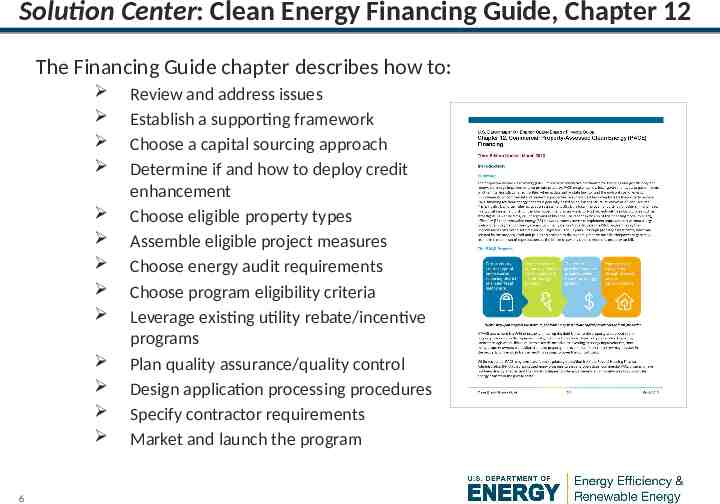
Solution Center: Clean Energy Financing Guide, Chapter 12 The Financing Guide chapter describes how to: 6 Review and address issues Establish a supporting framework Choose a capital sourcing approach Determine if and how to deploy credit enhancement Choose eligible property types Assemble eligible project measures Choose energy audit requirements Choose program eligibility criteria Leverage existing utility rebate/incentive programs Plan quality assurance/quality control Design application processing procedures Specify contractor requirements Market and launch the program
DOE Supported PACE Activity in 2015 NASEO: Analysis of Statewide Property Assessed Clean Energy (PACE) Programs Technical Assistance Program: PACE in the Box Analysis Better Buildings Challenge: Milwaukee PACE Implementation Model 7
Regional Energy Efficiency Organizations SPEER Support C-PACE and public building efficiency across Texas SWEEP Support C-PACE in Colorado, Nevada, and Utah Working with local governments to set up C-PACE programs 8
Commercial Property Assessed Clean Energy (PACE): A Deeper Dive into Program Administration February 2015 Emily Martin Fadrhonc (Lawrence Berkeley National Lab) Chris Kramer (Environmental Futures Group) Supported by DOE’s Office of Weatherization and Intergovernmental Programs Originally prepared for Forth Worth, Texas’s Better Buildings Challenge Finance Sub-Committee 9
Today’s Presentation What is Commercial PACE? How do Commercial PACE Programs Differ? Information from the Field 10 10
What is Commercial PACE? What is PACE? Extension of local governments’ authority to levy special property assessments to fund projects that deliver public benefits What can PACE do? PACE may offer more attractive – Terms (length of assessment) since they are secured by property and can transfer to the next owner – Interest rates because the tax collection mechanism is well understood and considered very secure – Opportunities to fund deeper, longer-payback projects, since PACE assessments may transfer with ownership What PACE isn’t. PACE is one tool among many and it does not, by itself, drive demand for energy efficiency 11 11
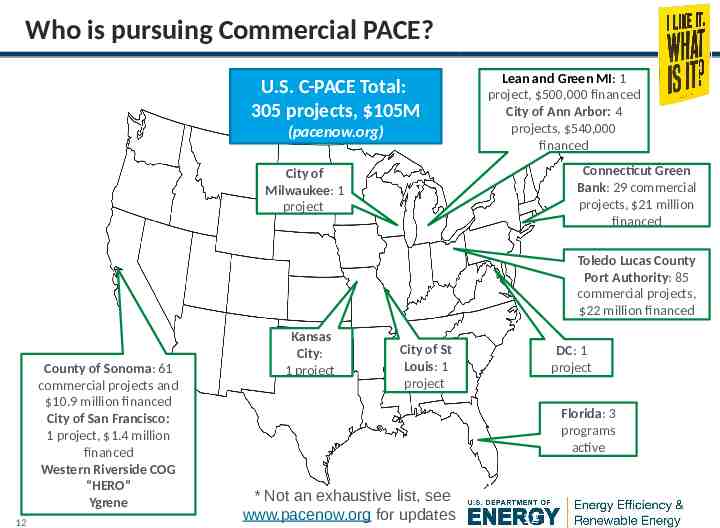
Who is pursuing Commercial PACE? U.S. C-PACE Total: 305 projects, 105M (pacenow.org) Lean and Green MI: 1 project, 500,000 financed City of Ann Arbor: 4 projects, 540,000 financed Connecticut Green Bank: 29 commercial projects, 21 million financed City of Milwaukee: 1 project Toledo Lucas County Port Authority: 85 commercial projects, 22 million financed County of Sonoma: 61 commercial projects and 10.9 million financed City of San Francisco: 1 project, 1.4 million financed Western Riverside COG “HERO” Ygrene 12 Kansas City: 1 project City of St Louis: 1 project DC: 1 project Florida: 3 programs active * Not an exhaustive list, see www.pacenow.org for updates 12
How do programs differ? By level of program organization By type of program administrator By capital source By underwriting criteria By eligible measures By quality assurance processes And more! 13 13
Level of Program Organization PACE programs may be organized at local, regional, or state-wide levels Local organization – Allows greatest flexibility in program design – May also increase the risk of low levels of participation, due to a small pool of potential customers – Local organization was common for the earliest PACE programs Regional and statewide organization – May benefit from economies of scale – May recruit more attractive capital to fund PACE assessments due to the larger pool of potential customers – Often developed where there are existing governance entities willing to act as PACE program sponsors – Individual local governments retain responsibility for placing PACE assessments on properties 14 14
Type of Program Administrator PACE program sponsors may select a public, quasipublic or private administrator to oversee the PACE program Public or Quasi-Public – Allows greatest control and flexibility in program design, but places larger administrative burden on sponsor and increases risk of “lost sunk costs” should participation not meet expectations Private – May be paid for their administration services only (fee for service model) or may provide both administrative services and the exclusive right to finance PACE improvements (one stop shop model) – A one stop shop administrator may offer PACE programs at no cost to program sponsors in exchange for the exclusive right to fund assessments; potential benefit should be weighed against the risks of reducing competition among financiers to deliver attractive capital to participants 15 PACE Program Sponsors are government or quasigovernment entities that establish PACE districts and agree to record, place, and service PACE assessments. PACE Program Administrators implement the PACE program and are responsible for processing applications, marketing, outreach, contractor qualification, data tracking, record keeping, etc. Program Sponsors can also act as Administrators or sponsors may contract with a separate public or private Administrator. 15
Capital Source Up-front capital to fund PACE improvements may come from a range of public and private sources Funding PACE assessments with public capital offers the greatest flexibility in lending terms; however, if demand outstrips the available supply of public capital, the ability to fund additional PACE assessments will be hindered Accessing private capital increases the total amount of funding available to interested PACE participants; three basic models for funding PACE assessments with private capital – Public administrator acts as warehousing entity Requires program administrator to hold assessments until sufficient volume to support a re-sale to private investors; exposes program administrators to the risk that insufficient volume materializes or a private investor cannot be found – Private administrator funds assessments directly Allows for an immediate infusion of private capital; may have higher upfront costs that are passed through to participants, as the private administrator is taking on additional risk by holding assessments – Open market model Brings private capital to bear immediately; open market models may introduce administrative complexities as multiple lenders interact directly with program participants 16 16
Lessons Learned: Options for Funding Assessments Open market model is often viewed as the preferred option – Reduces the need for any outlay of public funds (even temporarily) – Aimed at increasing private market participation However, jurisdictions with the most funded projects have used the warehousing model (e.g., Toledo, Sonoma, Connecticut) – Has allowed them to get off the ground – Some jurisdictions that sought to use open market found low interest among lenders and switched to warehousing – Warehousing can still bring in private capital by issuing a bond backed by PACE projects 17 17
Underwriting Criteria Underwriting criteria (e.g., loan to value ratio, Dun and Bradstreet rating) are rarely applied to non-PACE special assessments Because of their unique nature, no standard underwriting criteria exist for PACE assessments, although a range of criteria have been proposed Ultimately, programs must strike a balance between extending financing responsibly and achieving broad access to attractive financing to achieve wide-scale clean energy and energy efficiency deployment 18 18
Eligible Measures PACE financing can be used to fund a range of improvements, including energy efficiency, renewable power systems, and non-energy upgrades such as wind protection – Allowing a wide range of measures may increase demand and program volume, but risks lower per-project energy savings – A savings to investment ratio (SIR) greater than one is advanced by some as consumer protection, but it has uncertain benefits and may reduce program participation – Including incentives in PACE projects can help achieve an SIR 1 19 19
Lessons Learned: Savings to Investment Ratio SIR 1 required in some jurisdictions Seen by some as a consumer protection (i.e., matching payments to savings) However, not necessarily an accurate reflection of the costeffectiveness of a project – Realized savings may vary from projected – May not reflect “incremental” savings (savings above baseline at the time of replacement) – May not reflect “incremental” costs (costs associated only with EE) Worth considering usefulness of SIR 1 criteria as a consumer protection tool – Disclosure is important – Some customers may be willing to invest for other reasons (non-energy benefits) – May dampen demand by excluding measures that customers find desirable 20 20
Quality Assurance Processes Many existing energy upgrade programs have established quality assurance and quality control protocols – PACE programs should consider leveraging these existing structures (e.g., contractor training requirements, certification, lists of approved contractors), as PACE-financed measures are likely to be similar to those covered by existing programs Ongoing data collection and reporting will allow program sponsors to assess impact and refine PACE programs over time, but may be seen as burdensome by participants – A program administrator may wish to take on this effort on participants’ behalf 21 21
Savings from PACE Projects No studies have been conducted on PACE projects in particular, due to the few completed projects and few years of data – However, in general, “realization rates” (defined as ex post verified energy savings divided by ex ante predictions of energy savings) in the commercial sector are estimated at approximately 80% – This figure is highly variable however, with some programs saving more (120%) energy than expected – Performance of a single retrofit compared to modeled savings will vary Several PACE programs are collecting data in order to assess project performance over their lifetime – Connecticut collects utility bill data after installation – Michigan requires that projects include a plan and funding for ongoing M&V (most projects meet this requirement using Portfolio Manager) – Milwaukee asks buildings to join the Better Buildings Challenge and use Portfolio Manager to document savings over time Several PACE programs report energy savings of 15 to 30 % compared to baseline – These are likely projected, not verified, savings Source: Resources for the Future “Energy Efficiency Program Evaluations: Opportunities for Learning” 22 22
Lessons Learned: Set Realistic Expectations Significant administrative requirements in development and implementation Low uptake seen in most programs so far – Likely due to novelty of the PACE approach and “breaking in” period – Most commercial PACE programs have low uptake so far (many have 1 or 0 funded projects) – Leading jurisdictions are doing tens of projects annually However, the number of programs and projects are growing – 25 active programs – Over 220 projects completed 23 23
PACE Program Costs When discussing program costs, differentiate between program sponsors and program administrators Program administrators take a range of approaches to recovering their costs; three main strategies are: – One-time fees (0.2-5% of assessment) – Annual fees (0.25-3% of outstanding balance) – “Adder” to interest rate (3-4%) Any fees should be carefully weighed against their potential “demand dampening” effects – Anecdotally, some PACE programs have seen low volume, may be in part due to high fees and interest rates – Also, some programs have experienced slow “ramp up” periods, so consider timing of cost recovery – Some programs offer fee waivers or reduced fees for early projects 24 24
PACE Interest Rates In general, PACE assessments are competitive with standard propertysecured loan interest rates – Range from 5-8.25% for 15-20 year terms PACE assessments may be more expensive than financing available to investment-grade commercial properties – Municipalities can emphasize the extra benefits of PACE (property attachment, longer terms, possible off-balance sheet treatment) as a reason to pursue PACE Difficult to draw conclusions between programs, due to variation in how administrative fees are included (or not included) in interest rates – Some programs have significant interest rate adders for program costs (up to 4 percentage points extra), others isolate these costs as one-time fees 25 25
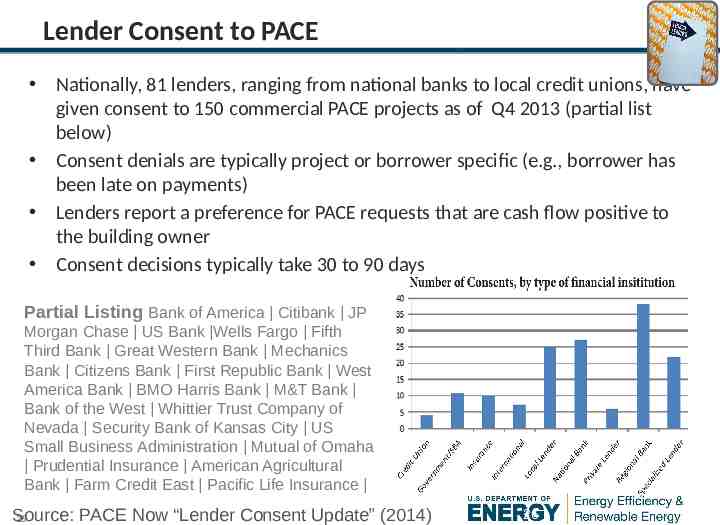
Lender Consent to PACE Nationally, 81 lenders, ranging from national banks to local credit unions, have given consent to 150 commercial PACE projects as of Q4 2013 (partial list below) Consent denials are typically project or borrower specific (e.g., borrower has been late on payments) Lenders report a preference for PACE requests that are cash flow positive to the building owner Consent decisions typically take 30 to 90 days Partial Listing Bank of America Citibank JP Morgan Chase US Bank Wells Fargo Fifth Third Bank Great Western Bank Mechanics Bank Citizens Bank First Republic Bank West America Bank BMO Harris Bank M&T Bank Bank of the West Whittier Trust Company of Nevada Security Bank of Kansas City US Small Business Administration Mutual of Omaha Prudential Insurance American Agricultural Bank Farm Credit East Pacific Life Insurance Source: PACE Now “Lender Consent Update” (2014) 26 26
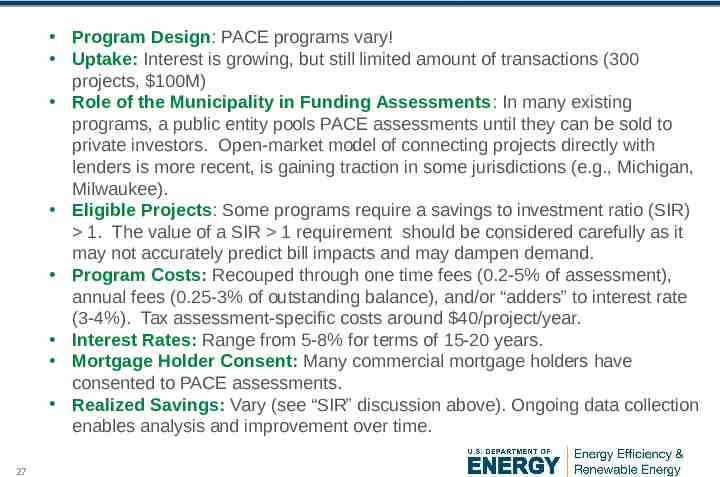
Bottom Line Program Design: PACE programs vary! Uptake: Interest is growing, but still limited amount of transactions (300 projects, 100M) Role of the Municipality in Funding Assessments: In many existing programs, a public entity pools PACE assessments until they can be sold to private investors. Open-market model of connecting projects directly with lenders is more recent, is gaining traction in some jurisdictions (e.g., Michigan, Milwaukee). Eligible Projects: Some programs require a savings to investment ratio (SIR) 1. The value of a SIR 1 requirement should be considered carefully as it may not accurately predict bill impacts and may dampen demand. Program Costs: Recouped through one time fees (0.2-5% of assessment), annual fees (0.25-3% of outstanding balance), and/or “adders” to interest rate (3-4%). Tax assessment-specific costs around 40/project/year. Interest Rates: Range from 5-8% for terms of 15-20 years. Mortgage Holder Consent: Many commercial mortgage holders have consented to PACE assessments. Realized Savings: Vary (see “SIR” discussion above). Ongoing data collection enables analysis and improvement over time. 27
Chris Kramer 802-482-5001 ckramer@energyfutures group.com Emily Martin Fadrhonc (510) 486-7584 [email protected] Eleni Pelican (202) 586-4922 [email protected] WIPO State and Local Solution Center: http://energy.gov/eere/slsc/state-and-local-solution-center 28 28
References and Further Reading 29
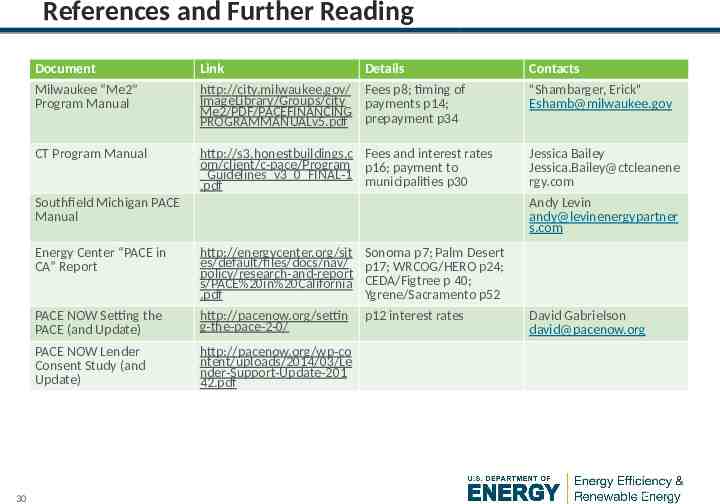
References and Further Reading Document Link Details Milwaukee “Me2” Program Manual http://city.milwaukee.gov/ Fees p8; timing of ImageLibrary/Groups/city payments p14; Me2/PDF/PACEFINANCING PROGRAMMANUALv5.pdf prepayment p34 "Shambarger, Erick" [email protected] CT Program Manual http://s3.honestbuildings.c Fees and interest rates om/client/c-pace/Program p16; payment to Guidelines v3 0 FINAL-1 municipalities p30 .pdf Jessica Bailey Jessica.Bailey@ctcleanene rgy.com Southfield Michigan PACE Manual 30 Contacts Andy Levin andy@levinenergypartner s.com Energy Center “PACE in CA” Report http://energycenter.org/sit es/default/files/docs/nav/ policy/research-and-report s/PACE%20in%20California .pdf Sonoma p7; Palm Desert p17; WRCOG/HERO p24; CEDA/Figtree p 40; Ygrene/Sacramento p52 PACE NOW Setting the PACE (and Update) http://pacenow.org/settin g-the-pace-2-0/ p12 interest rates PACE NOW Lender Consent Study (and Update) http://pacenow.org/wp-co ntent/uploads/2014/03/Le nder-Support-Update-201 42.pdf David Gabrielson [email protected] 30
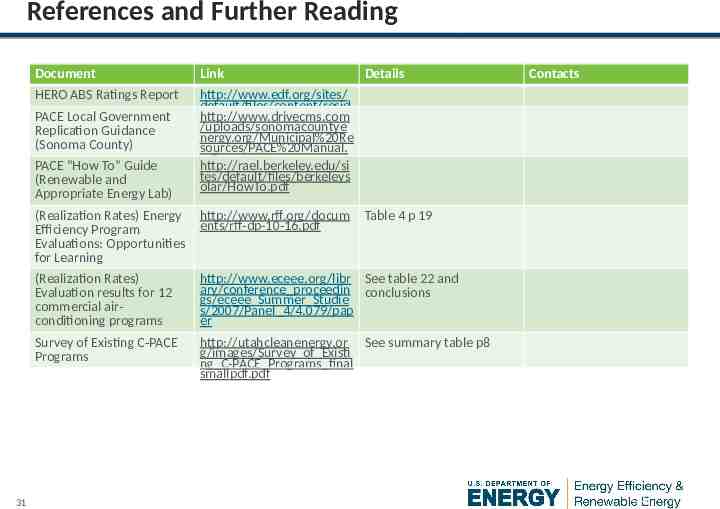
References and Further Reading Document Link HERO ABS Ratings Report http://www.edf.org/sites/ default/files/content/resid ential pace rating aa at http://www.drivecms.com 97 advance rate 1.pdf /uploads/sonomacountye nergy.org/Municipal%20Re sources/PACE%20Manual. pdf http://rael.berkeley.edu/si tes/default/files/berkeleys olar/HowTo.pdf PACE Local Government Replication Guidance (Sonoma County) PACE “How To” Guide (Renewable and Appropriate Energy Lab) 31 Details (Realization Rates) Energy Efficiency Program Evaluations: Opportunities for Learning http://www.rff.org/docum ents/rff-dp-10-16.pdf (Realization Rates) Evaluation results for 12 commercial airconditioning programs http://www.eceee.org/libr See table 22 and ary/conference proceedin conclusions gs/eceee Summer Studie s/2007/Panel 4/4.079/pap er Survey of Existing C-PACE Programs http://utahcleanenergy.or See summary table p8 g/images/Survey of Existi ng C-PACE Programs final smallpdf.pdf Contacts Table 4 p 19 31
Appendix 32
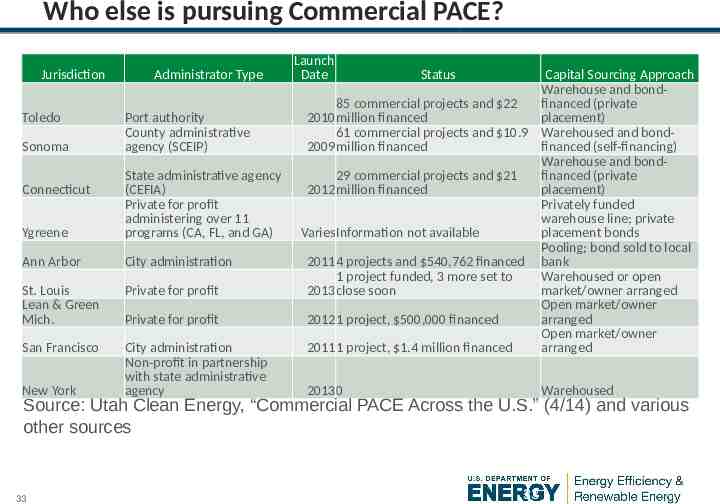
Who else is pursuing Commercial PACE? Jurisdiction Toledo Sonoma Administrator Type Port authority County administrative agency (SCEIP) Ygreene State administrative agency (CEFIA) Private for profit administering over 11 programs (CA, FL, and GA) Ann Arbor City administration St. Louis Lean & Green Mich. Private for profit San Francisco City administration Non-profit in partnership with state administrative agency Connecticut New York Private for profit Launch Date Status Capital Sourcing Approach Warehouse and bond85 commercial projects and 22 financed (private 2010 million financed placement) 61 commercial projects and 10.9 Warehoused and bond2009 million financed financed (self-financing) Warehouse and bond29 commercial projects and 21 financed (private 2012 million financed placement) Privately funded warehouse line; private VariesInformation not available placement bonds Pooling; bond sold to local 20114 projects and 540,762 financed bank 1 project funded, 3 more set to Warehoused or open 2013 close soon market/owner arranged Open market/owner 20121 project, 500,000 financed arranged Open market/owner 20111 project, 1.4 million financed arranged 20130 Warehoused Source: Utah Clean Energy, “Commercial PACE Across the U.S.” (4/14) and various other sources 33 33
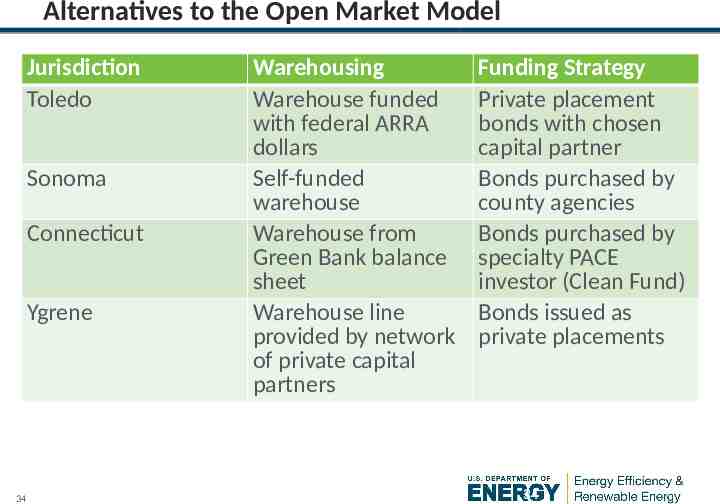
Alternatives to the Open Market Model Jurisdiction Toledo Sonoma Connecticut Ygrene 34 Warehousing Warehouse funded with federal ARRA dollars Self-funded warehouse Warehouse from Green Bank balance sheet Warehouse line provided by network of private capital partners Funding Strategy Private placement bonds with chosen capital partner Bonds purchased by county agencies Bonds purchased by specialty PACE investor (Clean Fund) Bonds issued as private placements 34
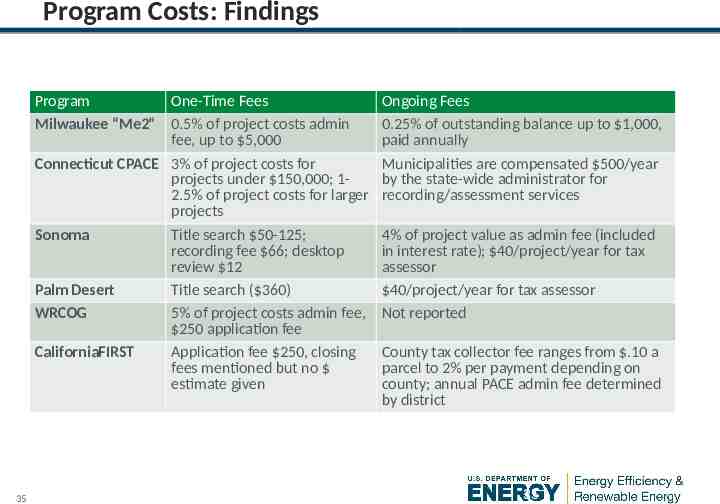
Program Costs: Findings Program One-Time Fees Milwaukee “Me2” 0.5% of project costs admin fee, up to 5,000 Connecticut CPACE 3% of project costs for projects under 150,000; 12.5% of project costs for larger projects Sonoma Title search 50-125; recording fee 66; desktop review 12 Palm Desert Title search ( 360) WRCOG 5% of project costs admin fee, 250 application fee CaliforniaFIRST Application fee 250, closing fees mentioned but no estimate given 35 Ongoing Fees 0.25% of outstanding balance up to 1,000, paid annually Municipalities are compensated 500/year by the state-wide administrator for recording/assessment services 4% of project value as admin fee (included in interest rate); 40/project/year for tax assessor 40/project/year for tax assessor Not reported County tax collector fee ranges from .10 a parcel to 2% per payment depending on county; annual PACE admin fee determined by district 35
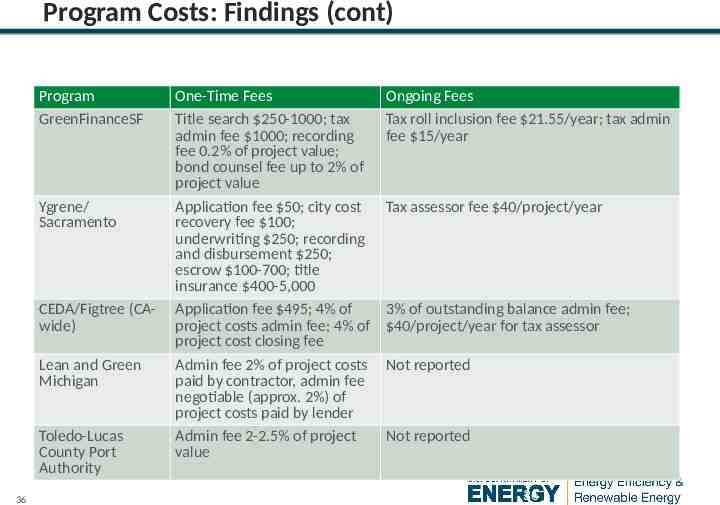
Program Costs: Findings (cont) Program GreenFinanceSF Ygrene/ Sacramento CEDA/Figtree (CAwide) Lean and Green Michigan Toledo-Lucas County Port Authority 36 One-Time Fees Title search 250-1000; tax admin fee 1000; recording fee 0.2% of project value; bond counsel fee up to 2% of project value Application fee 50; city cost recovery fee 100; underwriting 250; recording and disbursement 250; escrow 100-700; title insurance 400-5,000 Application fee 495; 4% of project costs admin fee; 4% of project cost closing fee Admin fee 2% of project costs paid by contractor, admin fee negotiable (approx. 2%) of project costs paid by lender Admin fee 2-2.5% of project value Ongoing Fees Tax roll inclusion fee 21.55/year; tax admin fee 15/year Tax assessor fee 40/project/year 3% of outstanding balance admin fee; 40/project/year for tax assessor Not reported Not reported 36
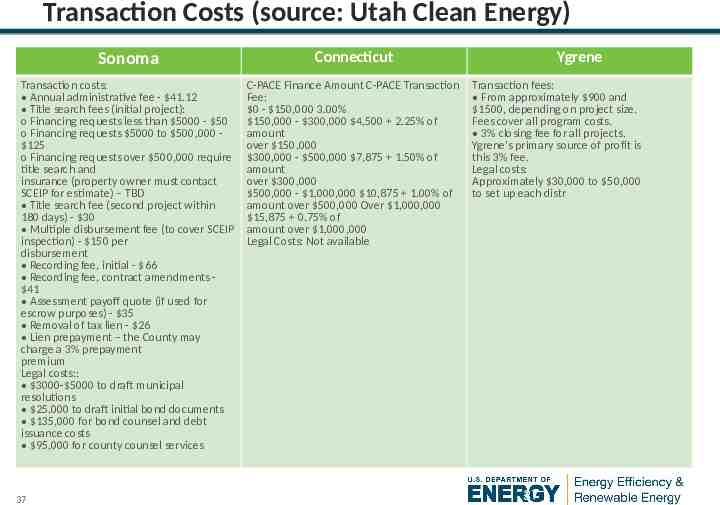
Transaction Costs (source: Utah Clean Energy) Sonoma Connecticut Transaction costs: Annual administrative fee - 41.12 Title search fees (initial project): o Financing requests less than 5000 - 50 o Financing requests 5000 to 500,000 125 o Financing requests over 500,000 require title search and insurance (property owner must contact SCEIP for estimate) – TBD Title search fee (second project within 180 days) - 30 Multiple disbursement fee (to cover SCEIP inspection) - 150 per disbursement Recording fee, initial - 66 Recording fee, contract amendments 41 Assessment payoff quote (if used for escrow purposes) - 35 Removal of tax lien - 26 Lien prepayment – the County may charge a 3% prepayment premium Legal costs:: 3000- 5000 to draft municipal resolutions 25,000 to draft initial bond documents 135,000 for bond counsel and debt issuance costs 95,000 for county counsel services C-PACE Finance Amount C-PACE Transaction Fee: 0 - 150,000 3.00% 150,000 - 300,000 4,500 2.25% of amount over 150,000 300,000 - 500,000 7,875 1.50% of amount over 300,000 500,000 - 1,000,000 10,875 1.00% of amount over 500,000 Over 1,000,000 15,875 0.75% of amount over 1,000,000 Legal Costs: Not available 37 Ygrene Transaction fees: From approximately 900 and 1500, depending on project size. Fees cover all program costs. 3% closing fee for all projects. Ygrene’s primary source of profit is this 3% fee. Legal costs: Approximately 30,000 to 50,000 to set up each distr 37
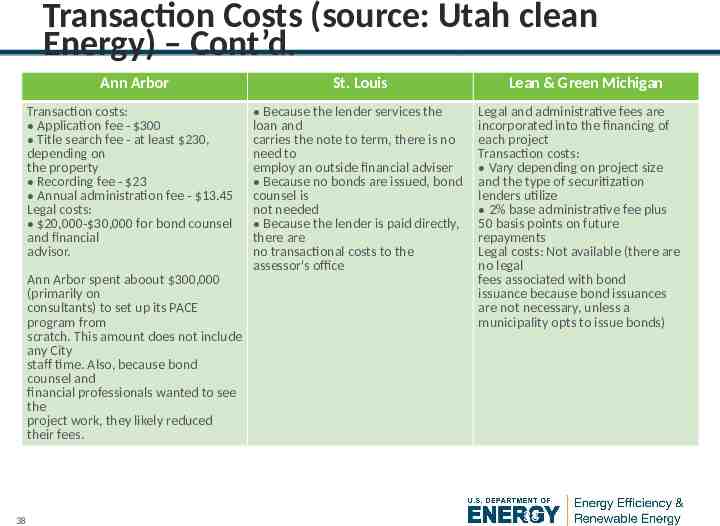
Transaction Costs (source: Utah clean Energy) – Cont’d. Ann Arbor St. Louis Transaction costs: Application fee - 300 Title search fee - at least 230, depending on the property Recording fee - 23 Annual administration fee - 13.45 Legal costs: 20,000- 30,000 for bond counsel and financial advisor. Because the lender services the loan and carries the note to term, there is no need to employ an outside financial adviser Because no bonds are issued, bond counsel is not needed Because the lender is paid directly, there are no transactional costs to the assessor's office Ann Arbor spent aboout 300,000 (primarily on consultants) to set up its PACE program from scratch. This amount does not include any City staff time. Also, because bond counsel and financial professionals wanted to see the project work, they likely reduced their fees. 38 Lean & Green Michigan Legal and administrative fees are incorporated into the financing of each project Transaction costs: Vary depending on project size and the type of securitization lenders utilize 2% base administrative fee plus 50 basis points on future repayments Legal costs: Not available (there are no legal fees associated with bond issuance because bond issuances are not necessary, unless a municipality opts to issue bonds) 38
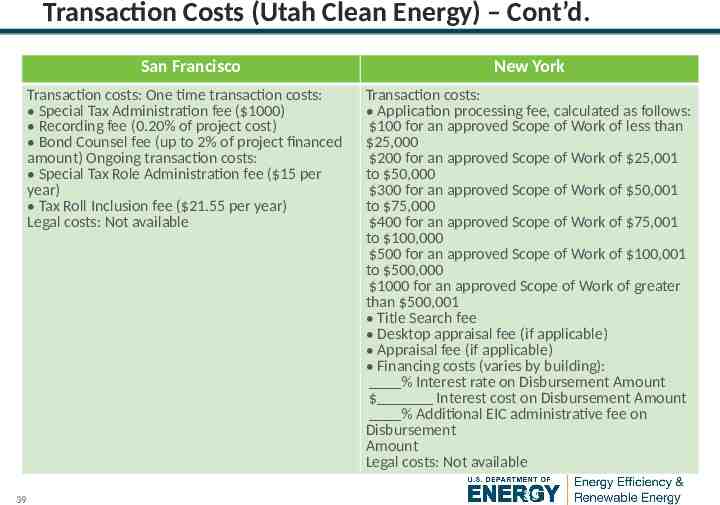
Transaction Costs (Utah Clean Energy) – Cont’d. San Francisco Transaction costs: One time transaction costs: Special Tax Administration fee ( 1000) Recording fee (0.20% of project cost) Bond Counsel fee (up to 2% of project financed amount) Ongoing transaction costs: Special Tax Role Administration fee ( 15 per year) Tax Roll Inclusion fee ( 21.55 per year) Legal costs: Not available 39 New York Transaction costs: Application processing fee, calculated as follows: 100 for an approved Scope of Work of less than 25,000 200 for an approved Scope of Work of 25,001 to 50,000 300 for an approved Scope of Work of 50,001 to 75,000 400 for an approved Scope of Work of 75,001 to 100,000 500 for an approved Scope of Work of 100,001 to 500,000 1000 for an approved Scope of Work of greater than 500,001 Title Search fee Desktop appraisal fee (if applicable) Appraisal fee (if applicable) Financing costs (varies by building): % Interest rate on Disbursement Amount Interest cost on Disbursement Amount % Additional EIC administrative fee on Disbursement Amount Legal costs: Not available 39
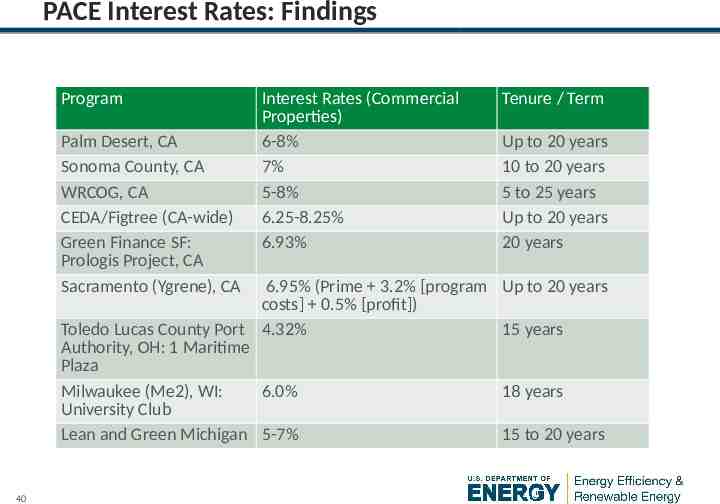
PACE Interest Rates: Findings Program Palm Desert, CA Sonoma County, CA WRCOG, CA CEDA/Figtree (CA-wide) Green Finance SF: Prologis Project, CA Sacramento (Ygrene), CA Interest Rates (Commercial Properties) 6-8% 7% 5-8% 6.25-8.25% 6.93% Tenure / Term Up to 20 years 10 to 20 years 5 to 25 years Up to 20 years 20 years 6.95% (Prime 3.2% [program Up to 20 years costs] 0.5% [profit]) Toledo Lucas County Port 4.32% 15 years Authority, OH: 1 Maritime Plaza Milwaukee (Me2), WI: 6.0% 18 years University Club Lean and Green Michigan 5-7% 15 to 20 years 40 40
Lender Consent to PACE: Best Practices Best practices in requesting lender consent include providing lenders: – Standard request forms and supporting information (e.g., project summary, improvements, estimated savings) – Financial data and projections – Borrower statistics (e.g., loan to value, debt service coverage ratio) – Energy audit or third party review – Program overview, enabling legislation summary – Industry information on PACE 41 41
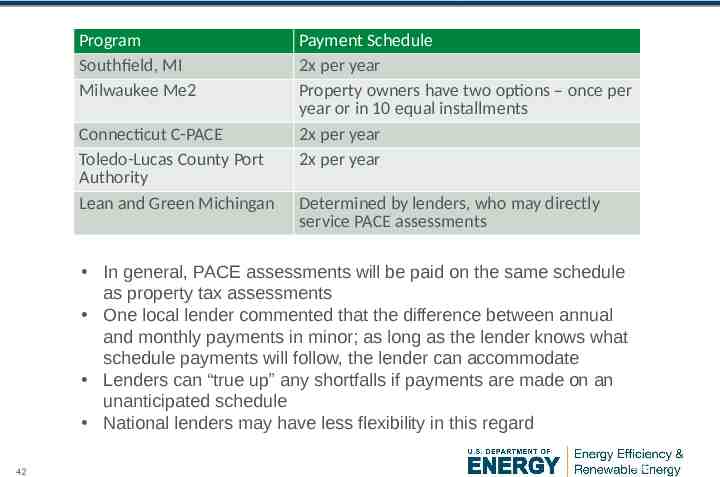
PACE Payment Frequency: Findings Program Southfield, MI Milwaukee Me2 Connecticut C-PACE Toledo-Lucas County Port Authority Lean and Green Michingan Payment Schedule 2x per year Property owners have two options – once per year or in 10 equal installments 2x per year 2x per year Determined by lenders, who may directly service PACE assessments In general, PACE assessments will be paid on the same schedule as property tax assessments One local lender commented that the difference between annual and monthly payments in minor; as long as the lender knows what schedule payments will follow, the lender can accommodate Lenders can “true up” any shortfalls if payments are made on an unanticipated schedule National lenders may have less flexibility in this regard 42 42
PACE Payment Frequency: Observations The importance of payment frequency will depend on source of capital and choice of loan servicer If municipal bonds initially fund projects, lenders will not directly interact with PACE assessments and should not have a timing preference – The bond itself will have a payment timing that is predictable to lenders If private capital is used to fund projects, lenders will need to negotiate timing of payments with borrowers and possibly use an escrowing approach – If lenders can service PACE assessments directly any payment frequency can be accommodated – Michigan offers this option – direct servicing and collections by lenders without involvement of tax collectors 43 43
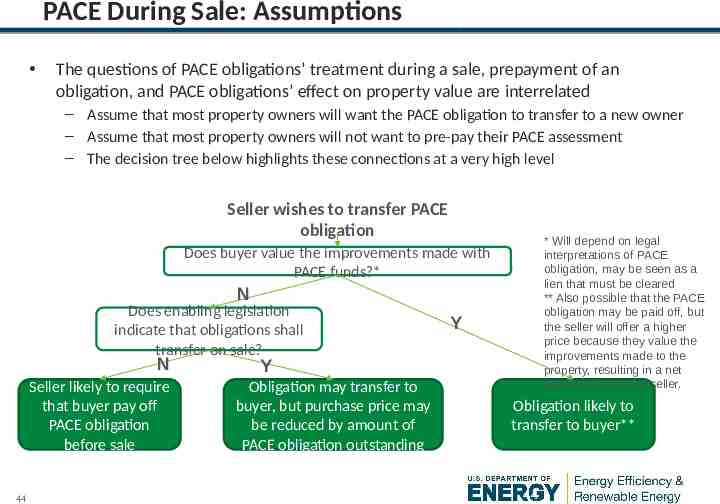
PACE During Sale: Assumptions The questions of PACE obligations’ treatment during a sale, prepayment of an obligation, and PACE obligations’ effect on property value are interrelated – Assume that most property owners will want the PACE obligation to transfer to a new owner – Assume that most property owners will not want to pre-pay their PACE assessment – The decision tree below highlights these connections at a very high level Seller wishes to transfer PACE obligation * Will depend on legal interpretations of PACE obligation, may be seen as a lien that must be cleared ** Also possible that the PACE obligation may be paid off, but the seller will offer a higher price because they value the improvements made to the property, resulting in a net neutral effect to the seller. Does buyer value the improvements made with PACE funds?* N Does enabling legislation indicate that obligations shall transfer on sale? N Seller likely to require that buyer pay off PACE obligation before sale 44 Y Y Obligation may transfer to buyer, but purchase price may be reduced by amount of PACE obligation outstanding Obligation likely to transfer to buyer** 44
PACE During Sale: Findings PACE Obligation During Sale To our knowledge, no commercial sales have been publically disclosed In the residential sector properties with PACE obligations follow one of two paths during sale: – PACE assessment transfers to the next owner and that owner resumes payment of assessments – PACE assessment is paid off in full at the point of sale The California WRCOG/HERO program reports that a minority of properties choose to pay off the assessment in full at the time of sale; most PACE obligations transfer to the next owner Prepayments Are allowed, explicitly, in Wisconsin Are discouraged, explicitly, in Connecticut Are penalized in the California, CEDA/Figtree – Early payoff fee of 2-5% of outstanding balance 45 45
PACE During Sale: Findings Effects on Property Value Underwriting and due diligence during a sale is more detailed in the commercial sector than in the residential sector Buyer is likely to take utility bill reductions due to PACE improvements into account Buyer is likely to take higher rent potential due to PACE improvements into account To our knowledge, no studies explicitly link PACE improvements to resale value 46 46
PACE During Sale: Observations Some states’ legislation clearly attempts to define the PACE obligation as “non-accelerating” – that is, it should not be paid off at sale (e.g., CT, FL) Likely that PACE obligations will be a point of negotiation between buyer and seller – Handling of the obligation will depend on if a buyer values the energy improvements made through PACE – This negotiation will also depend on bargaining power (i.e., is it a “buyers” or “sellers” market) – Municipalities can help support sellers in communicating the value of PACE assessments by offering materials on the program and commitments, helping sellers to share their third-party verified energy savings estimates, etc 47 47
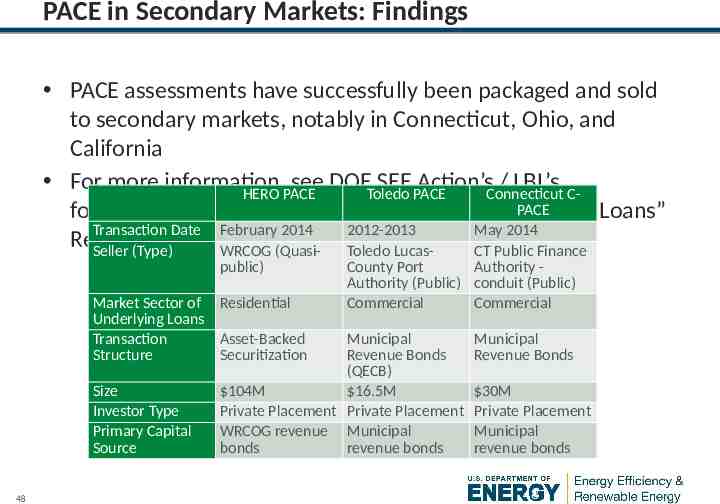
PACE in Secondary Markets: Findings PACE assessments have successfully been packaged and sold to secondary markets, notably in Connecticut, Ohio, and California For more information, see DOEToledo SEE PACE Action’sConnecticut / LBL’s CHERO PACE PACE forthcoming “Secondary Markets for Energy Efficiency Loans” Transaction Date February 2014 2012-2013 May 2014 Report (Q1 2015) Seller (Type) WRCOG (QuasiToledo LucasCT Public Finance public) Market Sector of Residential Underlying Loans Transaction Asset-Backed Structure Securitization Size Investor Type Primary Capital Source 48 County Port Authority Authority (Public) conduit (Public) Commercial Commercial Municipal Revenue Bonds (QECB) 104M 16.5M Private Placement Private Placement WRCOG revenue Municipal bonds revenue bonds Municipal Revenue Bonds 30M Private Placement Municipal revenue bonds 48
PACE in Secondary Markets: Observations PACE assessments have been successfully packaged and sold to secondary market investors Early sales indicate that investors view the security of the PACE obligation in a positive light – For example, the CA WRCOG/HERO sale was AA-rated, indicating high quality and low risk Secondary market transactions are generally not cost-effective until significant deal volume has materialized – Particularly true for non-municipal bonds, which are typically 100M or more 49 49